


Abstract
We observed the 2018 November outburst of CS Ind and confirmed that it was a genuine superoutburst with a very long [0.12471(1) d on average] superhump period. The superoutburst was preceded by a long precursor, which was recorded for the first time in SU UMa-type dwarf novae. Our interpretation is that the combination of a sufficient amount of mass in the disk before the ignition of the outburst and the slow development of tidal instability near the borderline of the 3 : 1 resonance caused a cooling front to start before the full development of tidal instability. This finding provides more support to the recent interpretation of slow development of the tidal instability causing various phenomena similar to WZ Sge-type dwarf novae in SU UMa-type dwarf novae with very long orbital periods.
1 Introduction
Cataclysmic variables (CVs) are composed of a white dwarf and a mass-transferring secondary, and the transferred matter forms an accretion disk around the white dwarf. Thermal instability in the accretion disk causes outbursts in some cataclysmic variables and these objects are called dwarf novae. SU UMa-type dwarf novae are a class of dwarf novae which show long, bright outbursts (superoutbursts) in addition to normal outbursts, and these superoutbursts are believed to be caused by the tidal instability when the disk radius expands to the 3 : 1 resonance during an outburst (Osaki 1989). During superoutbursts, variations with periods slightly longer than the orbital period (Porb) are observed and they are called superhumps. Dwarf novae which show only normal outbursts are called SS Cyg-type dwarf novae. For general information on CVs, dwarf novae, SU UMa-type dwarf novae, and superhumps, see, e.g., Warner (1995).
As CVs evolve, the secondary star loses mass and the orbital period shortens until the secondary becomes degenerate. During this evolution, the mass ratio (q = M2/M1) becomes smaller. In large-q systems, the radius of the 3 : 1 resonance cannot be inside the tidal truncation radius or even inside the Roche lobe in the extreme case, and there is an upper limit for q for a system to be an SU UMa-type dwarf nova. This limit is suggested to be around 0.24 based on modern three-dimensional numerical simulation (Smith et al. 2007), and it can be larger (0.33) under conditions of reduced mass transfer (Murray et al. 2000). Observations have shown that orbital periods of SU UMa-type dwarf novae are almost exclusively below 0.11 d (see Kato et al. 2017a). The single traditional exception was TU Men (Stolz & Schoembs 1981, 1984), whose orbital and superhump periods are 0.1172 d and 0.1257 d, respectively (Mennickent 1995). In 2016, this record was broken by the discovery of OT J002656.6+284933 (CSS 101212:002657+284933) with a superhump period of 0.13225(1) d (Kato et al. 2017b), although a few more objects had been suggested to be SU UMa-type dwarf novae with longer periods, but with poorer statistics (Mroz et al. 2013; see also the discussion in “Note added in proof” in Kato et al. 2017b). OT J002656.6+284933 was shown to have a smaller q than expected from the superhump period and it was suggested that the condition of the 3 : 1 resonance is difficult to meet in long-Porb systems (Kato et al. 2017b).
We report on the discovery of the SU UMa-type dwarf nova CS Ind with a long superhump period (∼0.125 d). This object not only showed ordinary evolution of superhumps as in other SU UMa-type dwarf novae but also showed a long-lasting precursor outburst, which has been recorded for the first time in SU UMa-type dwarf novae.
2 Observation and analysis
CS Ind (=NSV 13983) has been known as a dwarf nova. Based on an approximate measurement of a long Porb of 0.11 d (Contreras & Tappert 2008) and the historical light curve in the ASAS-3 data (Pojmański 2002), this object had been regarded as an SS Cyg-type dwarf nova. Upon visual detection of a precursor outburst by R. Stubbings and a subsequent bright outburst in 2018 November (vsnet-alert 22783),1 this object was suspected to be an SU UMa-type dwarf nova and its nature was finally confirmed by the detection of superhumps (vsnet-alert 22796). We observed this object with the support of the VSNET Collaboration (Kato et al. 2004). The observers used 35–44 cm telescopes. All observers used unfiltered CCD cameras. They used aperture photometry and extracted magnitudes relative to comparison stars whose constancy has been confirmed by comparison with check stars. The remaining small zero-point differences between observers were corrected by adding constants to minimize the squared sum of adjacent observations in the combined light curve. The analysis of superhumps was performed in the same way as described in Kato et al. (2009, 2014). We mainly used R software2 for data analysis. We used locally weighted polynomial regression (LOWESS: Cleveland 1979) for de-trending the data before superhump analysis. The times of superhump maxima were determined by the template fitting method as described in Kato et al. (2009). The times of all observations are expressed in barycentric Julian days (BJD).
3 Results and discussion
3.1 Course of outburst and long-term behavior
Although it was not known at the time of detection of a precursor outburst by R. Stubbings, the entire course of the outburst was recorded by the All-Sky Automated Survey for Supernovae (ASAS-SN) Sky Patrol (Shappee et al. 2014; Kochanek et al. 2017; see also vsnet-alert 23339). The course of the outburst was typical (Kato et al. 2009) for an SU UMa-type dwarf nova except for the initial long-lasting precursor, which will be discussed later (figure 1).

Light curve of CS Ind during the 2018 November outburst. The filled circles and filled squares represent our CCD photometry and ASAS-SN data, respectively. A long-lasting precursor outburst followed by a dip and a superoutburst are clearly seen. (Color online)
The long-term behavior based on the ASAS-SN data is shown in figure 2. Most outbursts lasted shorter than 10 d and the general behavior resembled that of an SS Cyg-type dwarf nova. Only the 2018 November outburst (see figure 1 and the bottom panel of figure 2) was peculiar with a long precursor, a subsequent dip, and a long outburst. The entire duration of this event was at least 30 d. No similar outburst was recorded in the ASAS-3 data between 2001 and 2009. Visual observations by R. Stubbings between 2010 and 2014 did not record such an outburst.
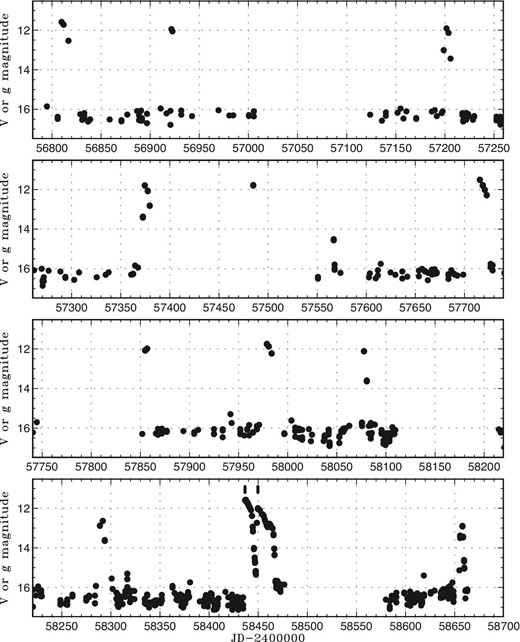
Light curve of CS Ind based on the ASAS-SN data. The vertical ticks in the bottom panels represent the precursor outburst and superoutburst.
3.2 Superhumps
We first demonstrate the presence of superhumps. Figure 3 shows a phase dispersion minimization (PDM; Stellingwerf 1978) analysis of the plateau phase (BJD 2458452–2458466) of the outburst. Superhumps were already present at the start of our campaign. The mean superhump period during the outburst plateau was 0.12471(1) d, where the error was estimated by the methods of Fernie (1989) and Kato et al. (2010).
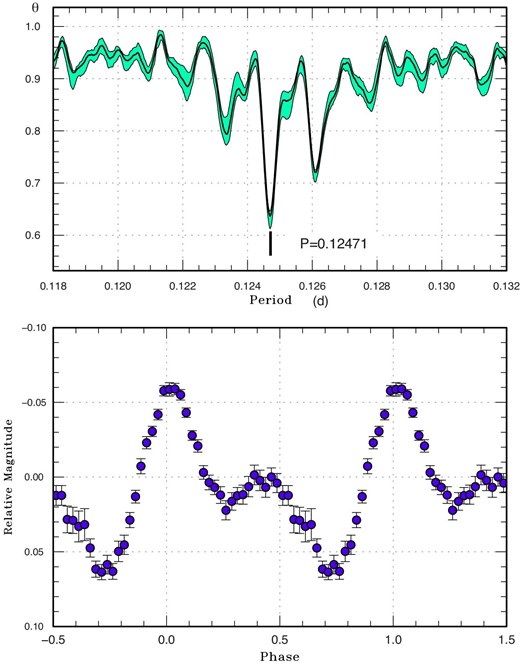
Superhumps in CS Ind during the superoutburst plateau. Upper: PDM analysis. Lower: Phase-averaged profile. (Color online)
The times of superhump maxima are listed in table 1. Due to the long superhump period and the limited duration of nightly observations, the maxima of superhumps at later epochs fell in the observing runs and the times of maxima were not determined. Superhump variation, however, was definitely present and there was no doubt that superhumps were present throughout the entire superoutburst plateau. The light curve of the superoutburst showed slight brightening after BJD 2458460. This feature is usually associated with the stage transition of superhumps (called stages B and C; see Kato et al. 2009). The mean superhump periods before and after this were 0.12638(3) d and 0.12488(3) d, respectively. The period decreased by 1.2%, which is a typical value for stage B–C transition (Kato et al. 2009). We conclude that the object showed a pattern of stage B–C transition typical for an SU UMa-type dwarf nova. The object was already stage B at the start of observation and stage A was not observed.
Superhump maxima of CS Ind.
| E | Max* | Error | O − C† | N ‡ |
|---|---|---|---|---|
| 0 | 58452.5577 | 0.0008 | 0.0011 | 39 |
| 3 | 58452.9214 | 0.0043 | −0.0157 | 33 |
| 4 | 58453.0637 | 0.0006 | −0.0002 | 140 |
| 5 | 58453.2016 | 0.0018 | 0.0109 | 43 |
| 6 | 58453.3163 | 0.0004 | −0.0013 | 256 |
| 7 | 58453.4521 | 0.0014 | 0.0077 | 76 |
| 8 | 58453.5675 | 0.0005 | −0.0037 | 25 |
| 16 | 58454.5915 | 0.0030 | 0.0057 | 23 |
| 24 | 58455.5968 | 0.0015 | −0.0036 | 39 |
| 32 | 58456.6142 | 0.0024 | −0.0009 | 27 |
*BJD−2400000.
†Against max = 2458452.5566 + 0.126827E.
‡Number of points used to determine the maximum.
On two nights after the superoutburst (between BJD 2458468 and 2458470), when dense observations were available, a period of 0.1242(1) d was detected. This period probably represents that of late-stage superhumps. No superhump signal was confirmed after these observations.
3.3 Long precursor outburst
The most striking feature of this outburst was the long precursor preceding the confirmed superoutburst.3 Such behavior has never been recorded in SU UMa-type dwarf novae. Precursors in SU UMa-type dwarf novae are considered to occur when the disk reaches the 3 : 1 resonance (see Osaki & Meyer 2003, figure 4; Osaki 2005, figure 4). A cooling wave immediately starts (as in normal outbursts) and ignition of the tidal instability causes brightening to the superoutburst. In this picture there is no room for a long precursor.
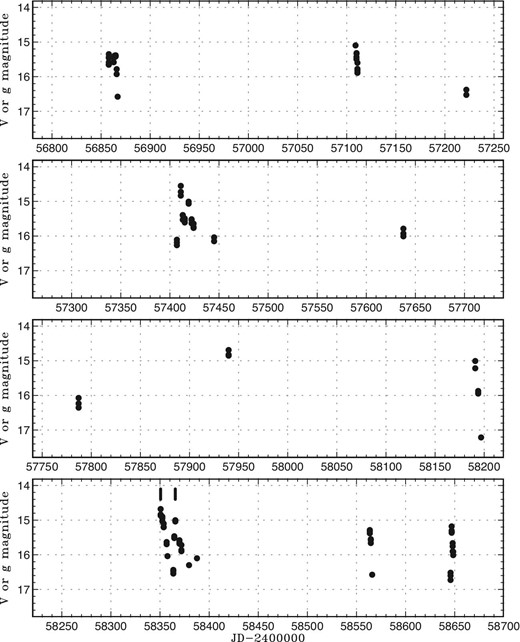
Light curve of V544 Her based on the ASAS-SN data. The vertical ticks in the bottom panels represent double outbursts.
The entire light curve of the 2018 November outburst may look like a “type-E” superoutburst of WZ Sge-type dwarf novae (see, e.g., Kato 2015, figure 9; Kimura et al. 2018, figures 3 and 7). WZ Sge-type dwarf novae are an extreme extension of SU UMa-type dwarf novae and their q values are small enough to enable the 2 : 1 resonance (Osaki & Meyer 2002); the “type-E” superoutburst is the most extreme type of outburst when q is extremely low (Kato 2015). During a “type-E” superoutburst, the initial outburst is interpreted to be dominated by the 2 : 1 resonance, which suppresses the 3 : 1 resonance (Lubow 1991). Once the phase of the 2 : 1 resonance ends, the 3 : 1 resonance starts to develop. In very low-q systems, the growth time of the 3 : 1 resonance is very slow (Lubow 1991) enabling a dip or an even longer faint state before the 3 : 1 resonance brings the disk back to the outburst state again (Kato et al. 2013). This picture is less likely to be applicable to CS Ind since the 2 : 1 resonance is impossible to achieve in such a long-Porb (i.e., high-q) system.
The most likely explanation for the present event is that a sufficient amount of mass was stored in the disk before the precursor, and when the outburst started, the radius of the expanded disk stayed around the tidal truncation radius for a long time (as in Osaki 2005, figure 5). In ordinary SU UMa-type dwarf novae, tidal instability develops quickly enough before a cooling wave starts and there is no dip during the superoutburst. In CS Ind, it is most likely that the development of the 3 : 1 resonance was slow enough, as in the case of a low-q WZ Sge-type dwarf novae, which enabled a cooling wave to start.
Slow growth of the 3 : 1 resonance has been suggested as an interpretation of the unusual behavior (simulating WZ Sge-type dwarf novae) in long-Porb SU UMa-type dwarf novae close to the stability border of the 3 : 1 resonance. Such behavior includes a long duration for the growing phase of superhumps (Kato et al. 2014, subsection 4.7) and post-superoutburst rebrightenings (Kato et al. 2016).
The present finding for CS Ind provides additional support to the slow growth of the 3 : 1 resonance when the 3 : 1 resonance is difficult to excite near the stability border. It has been well known that the historically exceptional object TU Men has three types of outbursts (normal outbursts, long normal outbursts, and superoutbursts), and long normal outbursts are considered to be outbursts starting with a sufficient amount of mass in the disk but failing to excite the 3 : 1 resonance. Recently, two long-Porb systems have been confirmed to show these three types of outbursts: NY Ser (Pavlenko et al. 2014; Kato et al. 2019) and V1006 Cyg (Kato et al. 2016).
Looking at the long-term light curve in figure 2, CS Ind also showed both short and long outbursts. The long outbursts can thus be regarded as long normal outbursts (pending observations confirming the lack of superhumps), and this object is expected to join this small group of SU UMa-type dwarf novae.
In such systems it is apparent that the tidal instability is very difficult to excite considering the low number of genuine superoutbursts: three times in TU Men in the past 56 yr, once in V1006 Cyg in the past 13 yr, once in CS Ind in the past 19 yr. The case of NY Ser is more complex as it showed standstills and two superoutbursts in 2018 (Kato et al. 2019). Before these, only one superoutburst was documented in 1996 (Nogami et al. 1998). Further systematic observations of these extreme objects will clarify the behavior of the disk around the stability limit of the tidal instability.
3.4 Candidate object
While studying the ASAS-SN light curves of dwarf novae, one of the authors (T.K.) noticed the presence of a double outburst in V544 Her in 2018 August similar to CS Ind (figure 4). Since such outbursts are hardly met in SS Cyg-type dwarf novae, this object would be a candidate SU UMa-type dwarf nova close to the stability limit of the tidal instability. Previous observations of two long outbursts of this object did not show superhumps (VSNET Collaboration, unpublished). Future observations of (probably) rare double outbursts or the measurement of the orbital parameters would clarify this possibility.
Acknowledgements
The authors express thanks to Y. Wakamatsu, who helped with processing the data reported to VSNET.
Supplementary data
The raw observation data: indcs.bjd.
Footnotes
1The VSNET alert message can be accessed at 〈http://ooruri.kusastro.kyoto-u.ac.jp/pipermail/vsnet-alert/〉.
2The R Foundation for Statistical Computing 〈http://cran.r-project.org/〉.
We call this phenomenon “precursor” since it occurred before the superoutburst as defined by the presence of well-defined superhumps.
References
