


Abstract
We present the large-scale structure over a more than 50 comoving Mpc scale at |$z \sim 0.9$| where the CL1604 supercluster, which is one of the largest structures ever known at high redshifts, is embedded. The wide-field deep imaging survey by the Subaru Strategic Program with the Hyper Suprime-Cam reveals that the already-known CL1604 supercluster is a mere part of larger-scale structure extending to both the north and the south. We confirm that there are galaxy clusters at three slightly different redshifts in the northern and southern sides of the supercluster by determining the redshifts of 55 red-sequence galaxies and 82 star-forming galaxies in total via follow-up spectroscopy with Subaru/FOCAS and Gemini-N/GMOS. This suggests that the structure known as the CL1604 supercluster is the tip of the iceberg. We investigate the stellar population of the red-sequence galaxies using 4000 Å break and Balmer H|$\delta$| absorption lines. Almost all of the red-sequence galaxies brighter than |$21.5\:$|mag in the z band show an old stellar population of |$\gtrsim\! 2\:$|Gyr. The comparison of composite spectra of the red-sequence galaxies in the individual clusters show that the galaxies at a similar redshift have a similar stellar population age, even if they are located |$\sim\! 50\:$|Mpc apart from each other. However, there could be a large variation in the star formation history. Therefore, it is likely that galaxies associated with the large-scale structure on a 50 Mpc scale formed at almost the same time, have assembled into the denser regions, and then have evolved with different star formation history along the hierarchical growth of the cosmic web.
1 Introduction
The canonical model of the cold dark matter structure formation suggests that small-scale building blocks merge via gravitational interactions and then grow into more massive structures in the universe. Distribution of dark matter deviates from uniformity as time goes on, and large-scale structures of dark matter haloes that consist of voids, filaments, groups, and clusters become prominent gradually (e.g., Springel et al. 2005; Vogelsberger et al. 2014; Schaye et al. 2015). Given that galaxies are hosted in dark matter haloes, galaxy formation and evolution is expected to be closely linked to the growth of large-scale structures. Therefore, it is important to understand how galaxies have evolved while the dark matter haloes grow hierarchically. The cosmological simulations predict that the local clusters consist of galaxies that were located in the wide areas over a several tens of Mpc at high redshifts and then assembled into the high-density regions, although the cluster member galaxies are currently bounded within about an Mpc scale (Muldrew et al. 2015; Chiang et al. 2017). This suggests that when we investigate the large-scale structures at higher redshifts, a wider survey volume is essential to reveal the structure formation.
Observationally, the cosmic web structures of galaxies at |$z \lesssim 1$| are revealed by wide-field spectroscopic surveys such as the Sloan Digital Sky Survey (SDSS, Blanton et al. 2003; Abazajian et al. 2009), the 2dF Galaxy Redshift Survey (2dFGRS, Colless et al. 2001), the VIMOS VLT Deep Survey (VVDS, Garilli et al. 2008), the VIMOS Public Extragalactic Redshift Survey (VIPERS, Guzzo et al. 2014), the Observations of Redshift Evolution in Large-Scale Environments (ORELSE) Survey (Lubin et al. 2009; Gal et al. 2008), the DEEP2 survey (Gerke et al. 2012; Newman et al. 2014), the Prism multi-object survey (PRIMUS, Skibba et al. 2014; Coil et al. 2011), and the HectoMAP survey (Hwang et al. 2016; Sohn et al. 2018). Indeed, as seen in cosmological simulations of the cold dark matter model, it is observed that galaxy clusters are located at the intersections of filamentary structures over several tens of Mpc area and galaxy clusters also compose larger-scale superclusters embedded in the cosmic web (Haynes & Giovanelli 1986; Nakata et al. 2005; Swinbank et al. 2007; Tanaka et al. 2009; Einasto et al. 2011; Liivamägi et al. 2012; Chow-Martínez et al. 2014; Tully et al. 2014; Nevalainen et al. 2015; Kim et al. 2016; Lietzen et al. 2016; Pompei et al. 2016; Kraan-Korteweg et al. 2017; Haines et al. 2018; Paulino-Afonso et al. 2018; Koyama et al. 2018). As
represented by large-scale structures such as the XLSSsC N01 supercluster at |$z \sim 0.3$| (Guglielmo et al. 2018), the BOSS Great Wall at |$z \sim 0.47$| (Lietzen et al. 2016), the Cl J021734|$-$|0513 supercluster at |$z \sim 0.65$| (Galametz et al. 2018), the COSMOS Wall at |$z \sim 0.73$| (Iovino et al. 2016), the RCS 2319|$+$|00 supercluster (Gilbank et al. 2008), and the Lynx supercluster at |$z \sim 1.3$| (Nakata et al. 2005), there are many known structures at high redshifts and they are interesting and important from the perspective of the growth of the structures in the universe. Among the high-z structures surveyed, the CL1604 supercluster at |$z \sim 0.9$| investigated by the ORELSE survey is one of the largest complex structures ever known at high redshifts over an |$\sim\! 0.^{\!\!\!\circ }5$| area (|$\sim\! 26$| comoving Mpc), which consists of three galaxy clusters with |$M_{\rm cl}\gt 10^{14}\, M_{\odot }$| and at least five galaxy groups with |$M_{\rm g}\gt 10^{13}\, M_{\odot }$| (Lemaux et al. 2012; Hung et al. 2019).
At present, there are wide-field imaging surveys covering several hundreds to about a thousand deg|$^2$| such as Pan-STARRS (Panoramic Survey Telescope and Rapid Response System, Chambers et al. 2016), DES (Dark Energy Survey, Dark Energy Survey Collaboration 2016), and KiDS (Kilo-Degree Survey, de Jong et al. 2015). Among them, the Subaru Strategic Program (SSP) with the Hyper Suprime-Cam (HSC, Miyazaki et al. 2018; Komiyama et al. 2018; Kawanomoto et al. 2018; Furusawa et al. 2018) is an ongoing imaging survey in five bands, |$grizy$|, that combines both a coverage of |$1400\:$|deg|$^2$| and a depth of |$r_{AB}\approx 26$| by making full use of a field of view (FoV) of the HSC, |$1.77\:$|deg|$^2$|, and the 8 m class Subaru telescope (Aihara et al. 2018a). The HSC-SSP survey provides us with wide-field, deep data set that is essential to investigating large-scale structures at high redshifts. The survey area of the HSC-SSP covers the regions including the already-known structures of the CL1604 supercluster. The HSC data in the five broadbands of |$grizy$| became available in the DR1 S16A internal release in 2016 August (Aihara et al. 2018b). Then, the second public data release (PDR2) of HSC-SSP data was in 2019 May (Aihara et al. 2019).1 Interestingly, we have found strong evidence that the already-known CL1604 supercluster is embedded within more extended large-scale structures (figure 1). We are on the verge of revealing a complete picture of the CL1604 supercluster with a greater than 50 comoving Mpc scale (|$\gt\!\! 1^{\circ }$|) at |$z \sim 0.9$|.
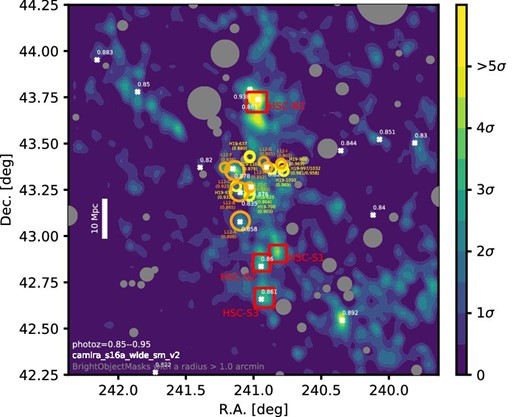
Distribution of galaxies at |$z\sim 0.9$| is shown using a kernel-density estimate with a Gaussian kernel. The galaxies are selected from the HSC-SSP S16A data by applying the criteria of photometric redshifts (ephor_ab, Tanaka et al. 2018) of 0.85–0.95. The contours are drawn on the grid of |$1 \times 1$| arcmin|$^2$| and a bandwidth two times larger than the bin size is used in the Gaussian kernel. The sigma is estimated from the standard deviation of the densities in the bins. The bright object masks with a radius larger than |$1^{\prime }$| are shown in gray (Coupon et al. 2018). The galaxy clusters and groups with |$\gt\!\! 10^{13.5}\, M_{\odot }$| at redshifts of 0.8–1.0 reported by Lemaux et al. (2012) and Hung et al. (2019) are shown by the orange and yellow circles with the redshift information. The white crosses are galaxy clusters selected on the HSC-SSP S16A data by the red-sequence finder named CAMIRA (Oguri 2014; Oguri et al. 2018). The white numbers are the redshifts of the clusters estimated by CAMIRA. The overdense regions of galaxies selected based on the photometric redshifts traces both the clusters/groups currently known and the CAMIRA clusters. The red squares are overdense regions where the spectroscopic follow-up observations are conducted by this study. (Color online)
This paper aims to reveal the whole picture of the large-scale structures around the CL1604 using the HSC-SSP imaging data and confirm them spectroscopically, which is described in section 2. This undoubtedly allows us to investigate how the galaxies associated with the large-scale structures have assembled into the denser regions and then evolved along the hierarchical growth of the cosmic web of the underlying dark matter haloes. In section 3, we investigate the stellar populations of red-sequence galaxies, compare the stellar populations between the galaxies in different clusters confirmed, and discuss the formation process of the large-scale structure. Finally, our conclusions are presented in section 4. Throughout this paper, magnitudes are presented in the AB system (Oke & Gunn 1983). The cosmological parameters of |$\mbox{H}_0 = 70\:\mbox{km}\:\mbox{s}^{-1}\:$|Mpc|$^{-1}$|, |$\Omega _m = 0.3$|, and |$\Omega _\Lambda = 0.7$| are adopted.
2 Revealing the whole picture of the CL1604 supercluster
2.1 Wide-field imaging survey with Subaru HSC
The HSC data around the CL1604 supercluster are available from both the HSC-SSP S16A internal release and PDR2. Among the three layers of the HSC-SSP survey—Wide, Deep, and UltraDeep—the CL1604 supercluster is located in the Wide layer with a field name of HECTOMAP (Aihara et al. 2019). The HECTOMAP field is designed to cover the field of |${13^{\rm h}20^{\rm m}}\leqq \rm {RA} \leqq {16^{\rm h}40^{\rm m}}$| and |$42^{\circ } \leqq \rm {Dec} \leqq 44{^{\circ}_{.}}5$|, i.e., |$\sim\! 90\:$|deg|$^2$| (Aihara et al. 2018a). In this paper, the limited |$\sim\! 2\times 2$| deg|$^2$| area is used to reveal the large-scale structures around the CL1604 supercluster. The HSC-SSP is an on-going survey and the pipeline used for data processing is also still developing (Aihara et al. 2019). The different versions of the data release mean that the data are processed by different versions of the pipeline. The S16A data are processed with the pipeline hscPipe v4.0.2 (Bosch et al. 2018), and the PDR2 data are processed with the latest pipeline, hscPipe v6 (Bosch et al. 2018; Aihara et al. 2019). Measurement flags given by a version of the pipeline to each object, which are used for, e.g., object selection, validation of data quality, and reliability of photometry, are not necessarily coincident with those by another version of the pipeline. Therefore, HSC data used in this section are extracted from the S16A internal release (Aihara et al. 2018b), not PDR2, to maintain consistency between our original investigation of the galaxy distribution around the CL1604 supercluster and the subsequent target selection for the follow-up spectroscopy. A composite model magnitude named cmodel is used for the photometry of galaxies. The cmodel photometry measures fluxes of objects by simultaneously fitting two components of a de Vaucouleur and an exponential profile convolved with a point-spread function (PSF) (see Bosch et al. 2018 for more details).
The number density map of the photo-z selected galaxies with |$z_{\rm ph}= 0.85$|–0.95 (Aihara et al. 2018b; Tanaka et al. 2018) shows the large-scale structures extending in the north-to-south direction well beyond the already-known structures of the CL1604 supercluster (figure 1). In the S16A release, the photometric redshifts calculated by six different codes are available. Among them, we use the photo-z calculated by the code named ephor_ab and the photo-z quality is |$\sigma _z\sim 0.035$| (Tanaka et al. 2018). Note that even if we use the photo-z calculated by any of the other codes, the number density map of galaxies with |$z_{\rm ph}= 0.85$|–0.95 is consistent with each other. As shown in figure 1, the structure of the photo-z selected galaxies coincides with the distribution of the galaxy clusters at |$z_{\rm ph,cl} = 0.9\pm 0.1$| (|$\sigma _{z_{\rm ph,cl}}\sim 0.01$|) identified by a red sequence galaxy finder named CAMIRA (Oguri 2014; Oguri et al. 2018), suggesting that we are seeing the real global structures at |$z\sim 0.9$|. We also make sure that galaxies with photometric redshifts of 0.70–0.80 or 0.95–1.05 do not show the similar structure of overdensity regions and structures of galaxies with photometric redshifts of 0.75–0.85 or 0.90–1.00 are not so prominent as shown in figure 1. These facts support the suggestion that the large-scale structure of galaxies with photometric redshifts of 0.85–0.95 is real. Figure 2 shows the color–magnitude diagram of the galaxies selected in the several overdense regions, where the prominent red sequence is seen compared with that in the general fields. Note that we define the boundary of |$r-z=1.7$| to distinguish red-sequence galaxies from star-forming galaxies (figure 2). The concentration of red galaxies also convinces us that the galaxies selected are associated with the large-scale structures including the CL1604 supercluster.
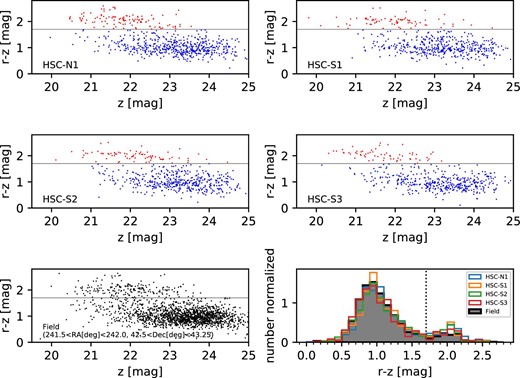
Color–magnitude diagram showing |$r-z$| colors as a function of z magnitude in the four regions where our follow-up spectroscopy was conducted. The galaxies with |$r-z\gt 1.7$| are classified as red-sequence galaxies, while the galaxies with |$r-z \lt 1.7$| are classified as star-forming galaxies. For the comparison, we arbitrarily define the field as a region with |$241{^{\circ}_{.}}5\lt $| RA |$\lt 242{^{\circ}_{.}}0$| and |$42{^{\circ}_{.}}5\lt $| Dec |$\lt 43.{^{\circ}_{.}}5$|. In the lower right-hand panel, the normalized histograms of |$r-z$| colors in each region are shown. The dashed line show the color of |$r-z=1.7$|. Compared with the field, the overdense regions show a larger number of red-sequence galaxies, which can be visible by prominent red sequence. (Color online)
Figure 1 demonstrates that the Subaru HSC has the unique capability to survey the large-scale structures at high redshifts thanks to both the wide-field coverage and the depth of the data. However, these pieces of evidence are all based on the photometric data. The spectroscopic confirmation is essential to proceed with further detailed studies on the structure formation and cluster galaxy evolution. To do that, we visually select four regions showing the highest number density based on figure 1; one is to the north of the already-known CL1604 supercluster and three are to the south.
2.2 Spectroscopic confirmation of the large-scale structure
2.2.1 Spectroscopy with Subaru and Gemini-N
We used Faint Object Camera and Spectrograph (FOCAS) installed on the Subaru telescope (Kashikawa et al. 2002) and Gemini Multi-Object Spectrograph (GMOS) installed on the Gemini North telescope (Hook et al. 2004) to conduct follow-up observations for galaxies selected in subsection 2.1 and then confirm four overdense regions associated with the extended large-scale structures at |$z\sim 0.9$| (figure 1). The observations were conducted through two programs of S18A-125 for the FOCAS run (PI: T. Kodama) and GN-2018A-FT-107 for the GMOS run (PI: M. Hayashi). The FOCAS run was in classical mode on 2018 March 8 (UT) and the GMOS run was in queue mode on 2018 June 14 and 16 (UT). The multi-object spectroscopy (MOS) observations are summarized in table 1.
Summary of the MOS observations.
| Observed* | Confirmed* | Integration | Seeing | ||||||
|---|---|---|---|---|---|---|---|---|---|
| Mask | Cluster | red/blue† | red/blue† | Telescope | Spectrograph | Grating | [min] | [|$^{\prime \prime }$|] | Program ID |
| 1 | HSC-N1 | 15/14 | 15/14 | Subaru | FOCAS | VPH850 | 105 | 0.72–0.93 | S18A-125 |
| 2 | HSC-N1 | 16/22 | 11/14 | Gemini-N | GMOS | R400 | 72.3 | 0.74–0.90 | GN-2018A-FT-107 |
| 3 | HSC-S1 | 10/21 | 10/16 | Gemini-N | GMOS | R400 | 72.3 | 0.77–0.89 | GN-2018A-FT-107 |
| 4 | HSC-S2 | 12/22 | 12/17 | Gemini-N | GMOS | R400 | 72.3 | 0.60–0.68 | GN-2018A-FT-107 |
| 5 | HSC-S3 | 7/25 | 7/21 | Gemini-N | GMOS | R400 | 72.3 | 0.61–0.69 | GN-2018A-FT-107 |
*The number of galaxies that are observed or confirmed by the observations.
†The galaxies with |$r-z\gt 1.7$| are classified as red galaxies, and the others are blue galaxies (see also figure 2).
FOCAS has a circular FoV of |$6^{\prime }$| in diameter. We used a MOS mask in the FOCAS run to observe the galaxies in the N1 region. Among the candidates within the FoV, red-sequence galaxies with z-band magnitude |$\lt\! 22.5$| and |$r-z= 1.8$|–2.3 are selected as a first priority and then star-forming galaxies with |$r-z\lt 1.6$| are selected. Higher priority is given to brighter galaxies. In the mask, 28 slits are allocated to 29 galaxies, i.e., a pair of close targets is observed with a single slit (15 red-sequence galaxies and 14 star-forming galaxies). A slit is allocated to a star for monitoring the sky condition such as seeing and transparency. The slit width is |${0^{\prime\prime}_{.}}8$|. We use a VPH850 grating and SO58 order sorting filter, which provides spectral resolution of |$R=750$| for |${0^{\prime\prime}_{.}}8$| slit and wavelength coverage of 5800–10350 Å. Since two pixels are binned along the spatial direction in each readout of frame, the pixel scale is 1.19 Å and |${0^{\prime\prime}_{.}}2076$| per pixel. The spectra in the sequence of the exposures were obtained by dithering by |$\pm 1^{\prime \prime }$| from the central position along the slit. We took seven exposures with |$900\:$|s on-source integration each, and thus the total integration time is 1.75 hr. The seeing ranges between |${0^{\prime\prime}_{.}}72$| and |${0^{\prime\prime}_{.}}93$|, measured from the spectra of the monitoring star. The sky was in almost photometric condition during the observation with this mask.
GMOS has a rectangular FoV of |$5.5\times 5.5\:$|arcmin|$^2$|. We used a MOS mask in the GMOS run to observe the galaxies in each candidate of galaxy cluster, i.e., four MOS masks were used in total. We selected the target galaxies based on the same strategy as in the FOCAS run. We targeted red-sequence galaxies with z-band magnitude |$\lt\! 22.3$| and |$r-z= 1.85$|–2.3 and star-forming galaxies with |$r-z\lt 1.45$|. As shown in table 1, 31–38 slits are allocated to red-sequence galaxies and star-forming galaxies. Furthermore, a slit is allocated to a star in each mask for monitoring the sky condition. The slit width is |${1^{\prime\prime}_{.}}0$|. We use R400 grating and OG515 blocking filter, which provides spectral resolution of |$R=959$| for |${1^{\prime\prime}_{.}}0$| slit and wavelength coverage of |$\gt\!\! 6150{\,\rm \mathring{\rm A}}$|. Since two pixels are binned along both spatial and spectral direction in each readout of frame, the pixel scale is 1.52 Å and |${0^{\prime\prime}_{.}}1614$| per pixel. The spectra were obtained by dithering along spectral direction at three central wavelengths of 7800, 7900, and 8000 Å to fill the gap between the detectors. Note that we did not use the “Nod & Shuffle” mode. Five exposures with 868 s on-source integration each were taken under the dark night condition of cloud cover (CC) |$= 50\%$| (clear) and image quality (IQ) |$= 70$| (good), and thus the total integration time is |$1.21\:$|hr. The seeing ranges between |${0^{\prime\prime}_{.}}60$| and |${0^{\prime\prime}_{.}}90$|, which are measured from the spectra of the monitoring star.
Consequently, we observed 164 galaxies (60 red-sequence galaxies and 104 star-forming galaxies) in the north FoV (HSC-N1) and the south FoVs (HSC-S1, HSC-S2, and HSC-S3) in total (see also table 1). Among the selected galaxies in each FoV, |$58\%$|, |$50\%$|, |$44\%$|, and |$32\%$| of the red-sequence galaxies were observed in the N1, S1, S2, and S3 regions, respectively. For star-forming galaxies, |$16\%$|, |$17\%$|, |$21\%$|, and |$16\%$| of the selected galaxies were observed in the N1, S1, S2, and S3 regions, respectively. Although we targeted almost the same fraction of star-forming galaxies in each FoV, the fraction of red-sequence galaxies observed in the S3 FoV is smaller than those in the other FoVs.
2.2.2 Reduction of the spectroscopic data
We used the FOCASRED package, which includes the IRAF scripts, for the Subaru/FOCAS data reduction.2 We also used the Gemini IRAF2 package and reduced the Gemini-N/GMOS data with PyRAF3 according to the GMOS Data Reduction Cookbook hosted on the US National Gemini Office (NGO) pages.4
We reduced both the FOCAS and GMOS data in a standard manner. All of the bias subtraction, overscan subtraction, flat fielding, distortion correction, wavelength calibration, sky-subtraction, coadd, and flux calibration are conducted in order. The wavelength calibration is based on the bright sky emission lines for FOCAS data and the CuAr spectrum for GMOS data. As a spectroscopic standard star, HZ44 and Feige66 are observed with FOCAS and GMOS, respectively. The spectra of the standard stars are used to correct for telluric absorption. Furthermore, to correct for the flux loss from the slit, we normalize the flux density of the spectrum to the broadband photometry for the red-sequence galaxies with stellar continuum detected. We perform no correction to the star-forming galaxies that were only detected in the emission line, because we do not use the fluxes of emission lines in this paper.
2.2.3 Redshift measurement
The redshifts for red-sequence galaxies are measured based on the stellar continuum of the observed spectra as well as HSC broadband photometry. For the redshift measurement, the optical broadband photometry of the galaxies is extracted from the latest database of HSC-SSP PDR2 (Aihara et al. 2019). The measurement values for the individual galaxies are shown in appendix 2. If required, readers can obtain additional information of the galaxies provided by the HSC-SSP survey in the data release website.1
We use the |${\rm C}{+}{+}$| version of the FAST code (Kriek et al. 2009) to fit the model spectral energy distribution (SED) derived by stellar population synthesis to the observed stellar continuum, where the redshift is one of the free parameters.5 The model SED templates are generated by the code of Bruzual and Charlot (2003) and the Chabrier (2003) initial mass function (IMF) is assumed. The star formation histories of the exponentially declining model are adopted, where we set an e-folding time of |$\mathrm{log}(\tau /\mathrm{yr})=8.5\rm {-}10.0$| with |${\rm {\Delta }}\mathrm{log}(\tau /\mathrm{yr})=0.1$| (Wuyts et al. 2011). Ages of 0.1–|$10.0\:$|Gyr are acceptable with a step of |${\rm {\Delta }}\mathrm{log}(\mathrm{age}/\mathrm{yr})=0.1$|. The extinction curve of Calzetti et al. (2000) is assumed, and |$A_V$| ranges from 0.0 to 3.0. Metallicity is fixed to the solar value. The absorption lines of Ca H|$+$|K and Balmer series are well-fitted by the model SED and useful to determine a redshift. The uncertainty of the redshifts is |$\Delta z = 0.001$|. Among the 60 red-sequence galaxies observed, we obtain the redshifts for 55 galaxies with the stellar continuum detected with enough signal-to-noise ratio. The success rate of the confirmation for red-sequence galaxies is |$91.7\%$|. The redshifts for the confirmed red-sequence galaxies are listed in the appendix in table 4.
The redshifts for star-forming galaxies are determined based on the [O ii]|$\lambda 3727$| emission line. Among the 104 star-forming galaxies observed, emission lines are detected from 82 galaxies. The detection of emission lines is visually inspected on both 1D and 2D spectra for the individual galaxies. The success rate of the confirmation for star-forming galaxies is |$78.8\%$|. Although 28 galaxies have a single line detected in the spectrum, 54 galaxies have multiple emission lines such as H|$\beta$| and/or [O iii]|$\lambda \lambda 4959{,}5007$| detected. In the case of the single line detected in the individual spectrum, we assume that the emission line is [O ii]|$\lambda 3727$|. The assumption should be reasonable, because the lines are detected around |$\sim\! 7000$| Å in the observed frame and the wavelength of the line detection is consistent with the expectation from the photometric redshifts estimated with the optical broadband photometry. Note that the spectra of nine galaxies with only a single line detected do not cover the wavelength of H|$\beta$| and/or [O iii]|$\lambda \lambda 4959{,}5007$|. The redshifts of the galaxies with multiple emission lines detected are more securely determined. The redshifts are measured from the peak wavelength of the profile of [O ii] emission line derived by Gaussian fitting. The redshifts and the emission lines detected for star-forming galaxies confirmed are listed in table 5 in appendix 2.
In total, we confirm 137 galaxies at |$z = 0.8$|–1.1 among the 164 galaxies observed. Figure 3 shows the comparison between the photometric redshifts used in the target selection and the spectroscopic redshifts determined by this study. The spectroscopic redshifts tend to be systematically higher than the photometric redshifts by |$\sim\! 0.03$|, which indicates the importance of follow-up spectroscopic observations. The systematic difference between the photometric and spectroscopic redshifts is similar for both red-sequence galaxies and star-forming galaxies. However, the dispersion of the redshift difference is slightly larger in the star-forming galaxies than the red-sequence galaxies (lower panel of figure 3). The larger dispersion in star-forming galaxies seems to be due to a larger fraction of star-forming galaxies with underestimated photometric redshifts. This systematic offset of photometric redshift towards lower values suggests that our photo-z selection of galaxies can cause a lower completeness of galaxies at lower redshifts among the redshift range of 0.85–0.95. Indeed, we find that among the galaxies confirmed in Lemaux et al. (2012), 67% of the galaxies at spectroscopic redshifts of 0.90–1.0 are selected by our photometric redshift selection, while 45% of the galaxies at spectroscopic redshifts of 0.85–0.90 are selected. This is why in figure 1 the position of the cluster-B at |$z=0.865$| is not as overdense as the other clusters at higher redshifts of |$z \gtrsim 0.9$| among the clusters presented by Lemaux et al. (2012). We make sure that the spatial distribution of galaxies selected with a photometric redshift range shifted lower by 0.05 is more similar to the structures presented by Lemaux et al. (2012). The accuracy of the photometric redshifts demonstrates that most of the member galaxies associated with the galaxy clusters and groups at |$z\gtrsim 0.9$| should be surely selected by the criteria we apply.
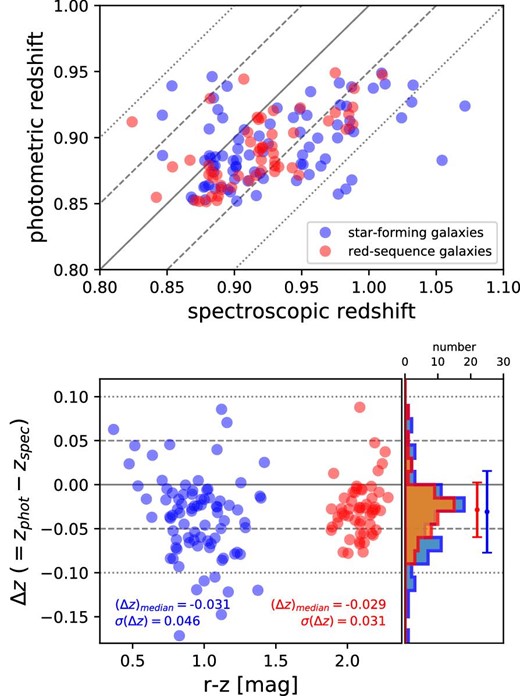
Spectroscopic redshifts are compared with the ephor_ab photometric redshifts in the upper panel. The red-sequence galaxies are shown by red symbols, while star-forming galaxies are shown by blue symbols. The solid, dashed, and dotted line shows the difference of the two redshifts by |$\pm 0.0$|, |$\pm 0.05$|, and |$\pm 0.1$|. In the lower panels, the difference between photometric and spectroscopic redshifts is shown as a function of the |$r-z$| color of galaxies. The histograms on the right-hand side show the distribution of the redshift difference in red-sequence (red) and star-forming (blue) galaxies. The dots and bars are the median and dispersion of the redshift difference. (Color online)
Figure 4 shows redshift distributions of the red-sequence galaxies (red histogram) and the star-forming galaxies (blue histogram) confirmed in each overdensity region. The peaks of redshift distribution are coincident between red-sequence galaxies and star-forming galaxies. The individual redshift peaks show a wide range of the fraction of red-sequence galaxies. Some overdensity regions show about |$\gtrsim\! 50$|% of the fraction of red-sequence galaxies, while some regions show as small as one-third. In particular, the S3 region shows the strong concentration of star-forming galaxies, suggesting that the cluster is less mature than the others. We note that there is a bias in the target selection where the fraction of red-sequence galaxies observed in the S3 region is smaller than those in the other regions (sub-subsection 2.2.1). Even if we correct for the bias, the fraction of red-sequence galaxies in the S3 region is not as high as those in the other regions. The difference of the red fraction may reflect the structure formation in this supercluster region, which is discussed in section 3 along with stellar population of red-sequence galaxies.
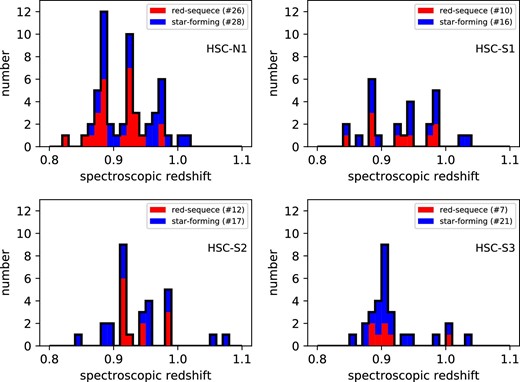
Distribution of redshifts spectroscopically confirmed in each overdense region. The red histograms show the redshift distribution of red-sequence galaxies, the blue ones show those of star-forming galaxies. Note that the red histogram is stacked with the blue histogram, and the solid black histogram shows the total number of galaxies including red-sequence and star-forming galaxies. The number of the galaxies is shown in the legend. (Color online)
2.3 Overview of the large-scale structure of CL1604 supercluster
Figure 5 shows a close-up view of the spatial distribution, the color–magnitude diagram, and the redshift distribution of the confirmed galaxies, where the symbols are color-coded based on the redshift range. The red-sequence galaxies in the N1 region show three peaks in the distribution, suggesting three clusters/groups are superposed and thus this region looks as if there is prominent structure in the projected 2D map of galaxies (figures 1 and 5). The spatial distribution of galaxies with different redshift ranges cannot be separated. The difference of the redshifts in three peaks corresponds to more than 6000–|$7000\:$|km|$\:$|s|$^{-1}$| away from each other. Since a typical velocity dispersion of member galaxies in galaxy clusters is |$\sim\!\! 1000$|–|$2000\:$|km|$\:$|s|$^{-1}$| depending on the cluster richness (e.g., Girardi et al. 1993), the structures at the different redshifts are likely to be independent. The comoving distance between three peaks with different redshifts is |$\sim\!\! 100$| comoving Mpc. The S1 region shows three small peaks. Interestingly, although these are not as prominent as the peaks in the N1 region, the redshifts of the peaks are quite similar. Given that both the structures are located |$\sim\! 43$| comoving Mpc apart from each other, there is likely to be three layers of the large-scale structures at three different redshifts. The galaxies in the regions between the N1 and S1 also show similar redshift distribution (figure 6; Lemaux et al. 2012; Gal et al. 2008). The south part of S2 that consists of galaxies at |$z\approx 0.9$| seems to be connected to the structure of S3. The redshift distribution is similar between the S2 and S3 overdense regions. Therefore, we confirm that this supercluster extends towards not only the north–south direction but also the redshift direction, namely, this is a complex three-dimensional structure more extended than is already known. As shown in figure 6, since there is a large spatial gap between galaxies observed by this study and those confirmed by Lemaux et al. (2012), it is difficult to conclude whether the structures are sheets/filaments or the assembly of galaxy clusters. However, since the local concentrations of galaxies are seen in both declination and redshift directions, it must be certain that the galaxy groups/clusters comprise large-scale structures. These results may suggest that the assembly of galaxies associated with the large-scale structures is synchronized over 50 comoving Mpc area. The structures confirmed are summarized in table 2.

Overview of the structures that we confirmed by this study. The map shown at the lower left is the same as figure 1. In each panel surrounding the map, the left, upper right, middle right, and lower right sub-panels show the zoomed-in view of the spatial distribution of the galaxies, the color–magnitude diagram, and the redshift distribution in the four individual regions surveyed by this study. Note that each red square in the whole map corresponds to the field size of the zoomed-in view and all of the bright object masks are shown in the zoomed-in distribution. The galaxies confirmed spectroscopically are shown with the colors according to the redshifts. The black dots are galaxies selected with the photometric redshifts located in the zoomed-in region. (Color online)
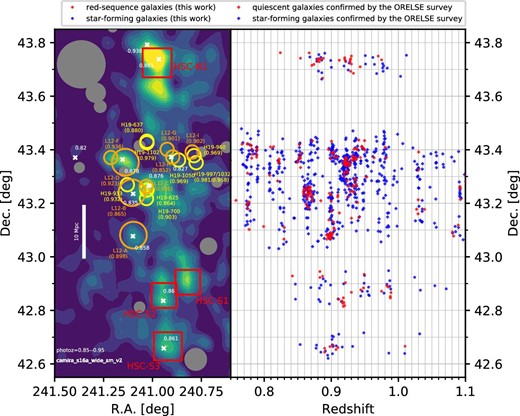
Distribution of the confirmed galaxies in the redshift–declination space (right-hand panel). The red (blue) circles are red-sequence (star-forming) galaxies confirmed by this work, while the red (blue) diamonds are quiescent (star-forming) galaxies confirmed by the ORELSE survey (Lemaux et al. 2012, 2018). In the ORELSE survey, the quiescent galaxies are classified based on the rest-frame |$NUV-r$| and |$r-J$| colors, the criteria of which are defined by Lemaux et al. (2014). In the left-hand panel, as a reference, the same image as in figure 1 is shown. (Color online)
Summary of the structures confirmed.*
| Structure | HSC-N1 | HSC-S1 | HSC-S2 | HSC-S3 | ||||
|---|---|---|---|---|---|---|---|---|
| (|${16^{\rm h}03^{\rm m}54{^{\rm s}_{.}}297}$|, | (|${16^{\rm h}03^{\rm m}16{^{\rm s}_{.}}652}$|, | (|${16^{\rm h}03^{\rm m}45{^{\rm s}_{.}}784}$|, | (|${16^{\rm h}03^{\rm m}41{^{\rm s}_{.}}025}$|, | |||||
| |${+43D43^{\prime }28{^{\prime\prime}_{.}}604}$|) | |${+42D54^{\prime }18{^{\prime\prime}_{.}}768}$|) | |${+42D51^{\prime }20{^{\prime\prime}_{.}}389}$|) | |${+42D39^{\prime }58{^{\prime\prime}_{.}}111}$|) | |||||
| |$\langle z \rangle$| | N | |$\langle z \rangle$| | N | |$\langle z \rangle$| | N | |$\langle z \rangle$| | N | |
| a ........ | 0.881 | 22 | 0.884 | 8 | 0.915 | 14 | 0.901 | 21 |
| b ........ | 0.927 | 17 | 0.946 | 7 | – | – | – | – |
| c ........ | 0.973 | 12 | 0.983 | 7 | – | – | – | – |
| Field ... | 3 | 4 | 15 | 7 | ||||
*RA and Dec are mean coordinates of the galaxies confirmed in the region. |$\langle z \rangle$| shows the median redshift of the galaxies confirmed. N shows the number of member galaxies associated with the structures.
3 Formation history of the large-scale structure
3.1 Stellar population of red-sequence galaxies
Stellar populations of galaxies associated with the large-scale structures are useful for understanding how the galaxies have evolved along the hierarchical growth of host dark matter haloes. To do that, we measure the strength of the 4000 Å break of stellar continuum, |$D_n4000$|, and the strength of the Balmer H|$\delta$| absorption line. The |$D_n4000$| index is sensitive to stellar population age in the sense that young galaxies have small 4000 Å breaks and old metal-rich galaxies have large 4000 Å breaks (Kauffmann et al. 2003). The equivalent width of H|$\delta$|, EW(H|$\delta$|), is sensitive to the time scale of star formation history, in the sense that the absorption is the strongest 0.1–|$1.0\:$|Gyr after the burst of star formation (Kauffmann et al. 2003). Therefore, a diagram of H|$\delta$| versus |$D_n4000$| is widely used to characterize the stellar population of galaxies.
We apply the definition by Balogh et al. (1999) for the measurement of |$D_n4000$| index, where flux densities of stellar continuum at 3850–3950 Å and 4000–4100 Å are measured as a blue and red side continuum level, respectively. There are several frequently used definitions for EW(H|$\delta$|) depending on the difference in the wavelength range of the continuum level and/or absorption line (Worthey & Ottaviani 1997; Fisher et al. 1998). Worthey and Ottaviani (1997) define H|$\delta _A$| as a measurement from the blue continuum of 4041.60–4079.75 Å, the red continuum of 4128.50–4161.00 Å, and the absorption band of 4083.50–4122.25 Å, while Fisher et al. (1998) define it as the blue continuum of 4017.0–4057.0 Å, the red continuum of 4153.0–4193.0 Å, and the absorption band of 4083.5–4122.25 Å. The difference between the two definitions of H|$\delta$| is how the continuum level is determined. We apply the definition of Worthey and Ottaviani (1997) for the measurement of EW(H|$\delta$|) here. The positive value of EW means that H|$\delta$| is an absorption line.
Figure 7 shows the measurements of the H|$\delta$| spectral feature as a function of those of |$D_n4000$|. The error shows the standard deviation of 100 measurements for the individual spectrum with |$1\sigma$| noise added following a normal distribution. We measure the spectral indices for only the 33 red-sequence galaxies with z-band magnitudes brighter than 21.5, because the other 22 fainter galaxies have too large an uncertainty in their measurement to determine the indices on an individual basis. The limiting magnitude corresponds to a stellar mass of |$\gtrsim\! 10^{10.8}\, M_{\odot }$|, and 85% of the bright galaxies have a stellar mass larger than |$10^{11}\, M_{\odot }$|. For comparison with the stellar population synthesis model, model tracks of the Bruzual and Charlot (2003) spectra (updated version 2016) with different star formation histories are also plotted in figure 7.6 The star formation histories that we consider are a simple stellar population (SSP), an exponentially declining one with e-folding times of |$0.1\:$|Gyr, |$0.3\:$|Gyr, and |$1.0\:$|Gyr, and constant star formation. When the |$D_n4000$| index ranges have values less than 1.4, which corresponds to ages |$\lesssim\! 2\:$|Gyr, EW(H|$\delta$|) can take different values depending on the time scale of star formation. However, after |$\sim\! 2\:$|Gyr, the tracks with different star formation histories converge. Furthermore, as a reference, the distribution of the line indices of galaxies at |$z = 0.04$|–0.1, which are extracted from the SDSS DR7 catalog of spectrum measurements released by the MPA-JHU7 is also shown (Kauffmann et al. 2003).
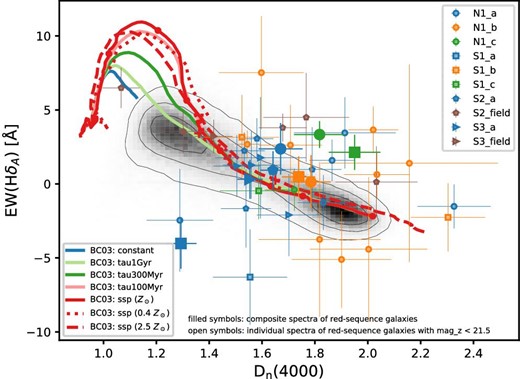
Strength of the Balmer H|$\delta$| absorption line as a function of strength of the 4000 Å break for red-sequence galaxies. For individual galaxies, only red-sequence galaxies with z-band magnitude brighter than 21.5 are investigated, while all of the red-sequence galaxies are used for the composite spectra. We apply the definitions by Worthey and Ottaviani (1997) and Balogh et al. (1999) to measure the equivalent width of H|$\delta$| and |$D_n4000$|, respectively. Symbols and colors of the individual galaxies are different depending on their position and redshift (figure 5 and table 2). The open symbols show the measurement for the individual galaxies, and the filled symbols show the measurement for the composite spectra of red-sequence galaxies (figure 8). The solid lines are model tracks of the stellar population synthesis of Bruzual and Charlot (2003) with different star formation histories: simple stellar population (red), e-folding time of |$0.1\:$|Gyr (pink), |$0.3\:$|Gyr (green), and |$1.0\:$|Gyr (yellow green) in exponentially declining star formation history, and constant star formation (blue). Stellar ages of 0.1, 0.5, 1, 2, 3, 5, and |$10\:$|Gyr are shown by red filled dots for SSP. The dotted and dashed lines show model tracks of SSP with |$0.4\, Z_{\odot }$| and |$2.5\, Z_{\odot }$|, respectively, where the stellar age of |$2\:$|Gyr is marked by the plus symbol. The gray-scale histogram shows the distribution of the SDSS galaxies at |$z= 0.04$|–0.1 with the contours of |$30\%$|, |$68\%$|, and |$90\%$| of the galaxies enclosed. (Color online)
Most of the bright red-sequence galaxies have old ages, although the individual galaxies show large variations on the H|$\delta$|–|$D_n4000$| diagram (figure 7). Different symbols denote the different locations on the sky, and different colors reflect different redshifts (the color coding is the same as in figure 5). The red-sequence galaxies in the N1 region tend to have larger values of |$D_n4000$|, compared with the galaxies in southern structures. On the other hand, irrespective of the clusters where the galaxies are located, there seems to be a weak trend that the red-sequence galaxies associated with the structure at similar redshifts (i.e., symbols with the same color) have similar spectral indices. However, the individual measurements of EW(H|$\delta$|) and |$D_n4000$| have large uncertainties even for bright galaxies with z-band magnitude |$\lt\! 21.5$|. Hereafter, we use composite spectra of the red-sequence galaxies in each sub-structure to investigate the average properties. Then, we discuss the formation history of the CL1604 supercluster and stellar populations of the red-sequence galaxies.
To make composite spectra of the red-sequence galaxies in each sub-structure, we first convert the wavelength in the observed frame to that in rest frame and then normalize the flux densities of each spectrum at 4000 Å. After that, we stack the spectra with an equal weight. We do not use a weight of |$1/\sigma ^2$| for stacking, because we prefer not to be biased towards bright targets. However, even if the spectra are stacked with a weight of |$1/\sigma ^2$|, our discussions in this paper do not change. For this analysis, all of the confirmed red-sequence galaxies are used; namely, we include not only bright galaxies but also fainter galaxies with z-band magnitude |$\gt\!\! 21.5$|. The composite spectra of red-sequence galaxies are shown in figure 8, and the number of galaxies stacked for each composite spectrum is shown in table 3. The spectral indices of the composite spectra are measured in the same manner as for the spectra of individual galaxies. The strength of H|$\delta$| for the composite spectra is also shown as a function of that of the 4000 Å break in figure 7, while the measurements are listed in table 3. In the next section, we discuss the evolution of the large-scale structure around the CL1604 supercluster.
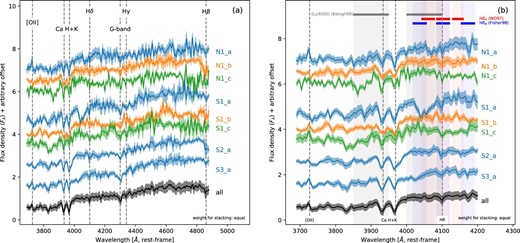
Composite spectra of the red-sequence galaxies in each sub-structure (table 2). The flux densities of each spectrum are normalized at 4000 Å, and then stacked with an equal weight, i.e., we do not use a weight of |$1/\sigma ^2$| for stacking, because we prefer not to be biased towards bright targets. The pale region around the spectrum shows the |$1\sigma$| uncertainty. The color-coding in the spectra is the same as in figure 5. In this plot, the spectra are shifted arbitrarily towards the vertical direction to avoid overlapping each other. The wavelength shown in the horizontal axis is in rest frame. The left-hand panel (a) shows the spectra at the whole wavelength range of 3670–4900 Å, while the right-hand panel (b) shows the spectra at the limited range of 3670–4200 Å that are important for the spectral indices. In panel (b), the bars and pale-color regions show the wavelength ranges for each spectral index. (Color online)
The spectral indices of the composite spectra.
| EW(H|$\delta )[{\rm \mathring{\rm A}} $|] | EW(H|$\delta )[{\rm \mathring{\rm A}} $|] | |$D_n4000$| | ||
|---|---|---|---|---|
| Cluster | N* | WO97† | Fisher98† | Balogh99† |
| HSC-N1_a | 11 | 2.37 |$\pm$| 1.74 | 3.43 |$\pm$| 1.78 | 1.67 |$\pm$| 0.08 |
| HSC-N1_b | 12 | 0.13 |$\pm$| 1.82 | 0.94 |$\pm$| 1.61 | 1.78 |$\pm$| 0.07 |
| HSC-N1_c | 2 | 3.34 |$\pm$| 0.90 | 2.80 |$\pm$| 0.87 | 1.82 |$\pm$| 0.10 |
| HSC-S1_a | 3 | −4.03 |$\pm$| 1.71 | −6.21 |$\pm$| 2.03 | 1.29 |$\pm$| 0.06 |
| HSC-S1_b | 3 | 0.48 |$\pm$| 1.38 | −2.75 |$\pm$| 1.32 | 1.74 |$\pm$| 0.06 |
| HSC-S1_c | 3 | 2.14 |$\pm$| 1.19 | 5.77 |$\pm$| 1.08 | 1.95 |$\pm$| 0.10 |
| HSC-S2_a | 7 | 0.93 |$\pm$| 1.28 | 0.69 |$\pm$| 1.37 | 1.64 |$\pm$| 0.05 |
| HSC-S3_a | 6 | 0.31 |$\pm$| 1.32 | −3.22 |$\pm$| 1.42 | 1.55 |$\pm$| 0.05 |
3.2 Implication for the evolution of the large-scale structure
The composite spectra of red-sequence galaxies in the structures at similar redshifts have comparable values of the spectral indices within the errors. All but one (S1_a) indicate spectra with stellar populations older than |$2\:$|Gyr, which is comparable with the measurement by Lemaux et al. (2012) for the already known CL1604 clusters. Although the red-sequence galaxies are located in the large-scale structures over the 50 Mpc area, our results suggest that the formation epoch is likely to be similar over the all of the structures.
There are several composite spectra of red-sequence galaxies with spectral indices deviating from the model tracks towards the upper right-hand direction. Since the Balmer H|$\delta$| is sensitive to the time scale of star formation, one possibility is that the star-formation activity is dependent on the sub-structures along the growth of the large-scale structure. Figure 4 shows that there is a large variation in the fraction of star-forming galaxies between the substructures. The sub-structures at higher redshift, i.e., the N1_c and S1_c, with the larger deviation, may have a higher fraction of star-forming galaxies, although the S3_a with the spectral indices on the model tracks also seems to be dominated by star-forming galaxies. We should note that the target selection for our spectroscopic observation can cause a bias in the fraction of the population (see also the discussion of target selection bias in sub-subsection 2.2.3). However, it is possible that the star formation activity, i.e., the fraction of star-forming galaxies, is different between clusters depending on the assembly process such as timing of accretion into a more massive halo and interaction with surroundings. In the model of stellar population synthesis, we assume the SSP or smooth history of star formation declining exponentially with time, which means that the model cannot take account of the small recently-occurred starburst and/or on-going weak dusty star formation. Recent studies of post-starburst galaxies with strong Balmer absorption which are selected by principal component analysis (PCA) show that there are post-starburst galaxies in the red sequence rejuvenated by a minor merger with a gas-rich galaxy, and that dusty starburst galaxies are a population of major contaminants of post-starburst galaxies (Pawlik et al. 2018, 2019). Given the facts, the second small starburst in the later phase can change the strength of spectral indices (Kauffmann et al. 2003; Marcillac et al. 2006; Lemaux et al. 2012). However, although the 4000 Å break (H|$\delta$| absorption) gets small (strong) soon after the burst, as time passes the effect of the second starburst becomes negligible. The spectral indices observed in the continuum spectra cannot be explained by only stellar continuum with multiple starbursts.
If star formation occurs in the galaxies, emission lines from H ii regions should be superposed on the stellar continuum spectra. In fact, there are composite spectra showing an [O ii] emission line (figure 8), suggesting non-negligible star formation activity. That is, the sample of the red-sequence galaxies can include a large fraction of so-called “E |$+$| A” galaxies (Dressler et al. 1999; Poggianti et al. 1999). The PCA for galaxy spectra shows that there are post-starburst galaxies with emission lines (Wild et al. 2007; Pawlik et al. 2018). The red-sequence galaxies do not seem to be purely quiescent galaxies. There is another possibility that the emission lines come from the existence of active galactic nuclei (Yan et al. 2006). They all suggest that the star formation history of the red-sequence galaxies is not as simple as the assumption in the stellar population synthesis model, but the red-sequence galaxies have more complex and varied histories of star formation.
Both the 4000 Å break and H|$\delta$| absorption are sensitive to metallicity and dust attenuation as well (Kauffmann et al. 2003; Marcillac et al. 2006), in the sense that more metal-rich and/or heavier dust attenuation make the galaxies move slightly towards the upper right-hand direction on the H|$\delta$|–|$D_n4000$| diagram. It is probable that dusty starburst galaxies at higher redshifts make a larger contribution to the spectral indices. Several previous studies report that the dusty starburst galaxies are found in the overdense regions at high redshifts (Geach et al. 2009; Koyama et al. 2010, 2011).
Lemaux et al. (2012) found that the red-sequence galaxies in the central clusters of this large-scale structure have stellar populations consistent with that of a single starburst. Therefore, by combining those results with ours, a picture of the formation of the large-scale structure is that the galaxies in the central massive halo are already mature and the galaxies in the course of accretion into the denser region can have a chance of rejuvenation with small multiple starburst showing a complex star formation history.
4 Conclusions
In this paper, we reveal the whole picture of the CL1604 supercluster at |$z\sim 0.9$|. Although the CL1604 supercluster was already known as a large-scale structure over an |$\sim\! 26$| comoving Mpc area consisting of three galaxy clusters with |$M_{\rm cl}\gt 10^{14}\, M_{\odot }$| and at least five galaxy groups with |$M_{\rm g}\gt 10^{13}\, M_{\odot }$| (Lemaux et al. 2012), the HSC-SSP deep wide-field imaging survey reveals that the larger-scale structures extend to the north and south over a more than 50 comoving Mpc scale using galaxies selected with photometric redshifts of |$z \sim 0.9$|. We then confirm that there are galaxy clusters and/or groups in both the northern and southern sides by determining the redshifts of 55 red-sequence galaxies and 82 star-forming galaxies in total. It is found that the already-known CL1604 supercluster is a mere part of larger-scale structures; the tip of the iceberg.
We investigate the stellar population of the red sequence galaxies by measuring the strength of the 4000 Å break, |$D_n4000$|, and the equivalent width of the Balmer H|$\delta$| absorption line, EW(H|$\delta$|). Almost all of the red-sequence galaxies brighter than |$21.5\:$|mag in the z band show the old stellar population with |$D_n4000 \gt 1.5$|, which corresponds to stellar ages of |$\gtrsim\! 2\:$|Gyr. A comparison of composite spectra of red-sequence galaxies in individual clusters shows that even if the red-sequence galaxies are located |$\gt\!\! 50\:$|Mpc apart, those at a similar redshift have similar stellar population ages. However, there is a large variation in the star formation history. Therefore, it is likely that galaxies associated with the large-scale structures at a 50 Mpc scale formed at almost the same time, have assembled into the denser regions, and then evolved along the hierarchical growth of the cosmic web.
Acknowledgment
We thank the anonymous referee for providing constructive comments and suggestions. We thank Dr. Brian C. Lemaux and Prof. Lori M. Lubin for kindly providing us with the catalog of the confirmed galaxies used in Lemaux et al. (2012) and Lemaux et al. (2018). We are also grateful to Dr. Brian C. Lemaux for his comments and suggestions. All of them were useful in improving this paper.
This paper is based on data collected at Subaru Telescope and Gemini-North Telescope via the time exchange program between Subaru and the Gemini Observatory and data retrieved from the Hyper Suprime-Cam (HSC) data archive system, which is operated by the Subaru Telescope and Astronomy Data Center at National Astronomical Observatory of Japan.
The HSC collaboration includes the astronomical communities of Japan and Taiwan, and Princeton University. The HSC instrumentation and software were developed by the National Astronomical Observatory of Japan (NAOJ), the Kavli Institute for the Physics and Mathematics of the Universe (Kavli IPMU), the University of Tokyo, the High Energy Accelerator Research Organization (KEK), the Academia Sinica Institute for Astronomy and Astrophysics in Taiwan (ASIAA), and Princeton University. Funding was contributed by the FIRST program from Japanese Cabinet Office, the Ministry of Education, Culture, Sports, Science and Technology (MEXT), the Japan Society for the Promotion of Science (JSPS), Japan Science and Technology Agency (JST), the Toray Science Foundation, NAOJ, Kavli IPMU, KEK, ASIAA, and Princeton University. The Pan-STARRS1 Surveys (PS1) have been made possible through contributions of the Institute for Astronomy, the University of Hawaii, the Pan-STARRS Project Office, the Max-Planck Society and its participating institutes, the Max Planck Institute for Astronomy, Heidelberg and the Max Planck Institute for Extraterrestrial Physics, Garching, The Johns Hopkins University, Durham University, the University of Edinburgh, Queen’s University Belfast, the Harvard-Smithsonian Center for Astrophysics, the Las Cumbres Observatory Global Telescope Network Incorporated, the National Central University of Taiwan, the Space Telescope Science Institute, the National Aeronautics and Space Administration under Grant No. NNX08AR22G issued through the Planetary Science Division of the NASA Science Mission Directorate, the National Science Foundation under Grant No. AST-1238877, the University of Maryland, and Eotvos Lorand University (ELTE). This paper makes use of software developed for the Large Synoptic Survey Telescope. We thank the LSST Project for making their code available as free software at |$\langle$|http://dm.lsst.org|$\rangle$|.
Appendix 1. The measurement of H|$\delta$| with the different spectral index
Here, we use the definition by Fisher et al. (1998) for the measurement of Balmer H|$\delta$| absorption line in the composite spectra. This is because Lemaux et al. (2012) use the definition of H|$\delta$| for the galaxies in the already-known central structures. Compared with the measurement using the definition from Worthey and Ottaviani (1997), there is a large dispersion in the H|$\delta$| strength (figure 9 and table 3). As shown in figure 8, the difference between the indices is the wavelength range used to estimate the stellar continuum level. Since the index of Fisher et al. (1998) uses the wavelength range apart from the H|$\delta$| rather than the index of Worthey and Ottaviani (1997), the measurement of H|$\delta$| is more sensitive to the stellar continuum, which could cause the larger dispersion. Although the reason for the large dispersion is unknown, there are several sky lines around H|$\delta$| and the accuracy of subtraction of the sky lines can affect the signal-to-noise ratio of the continuum spectrum. Note that we did not use the “Nod & Shuffle” mode in the spectroscopic observations. Therefore, we use the definition from Worthey and Ottaviani (1997) for the discussion in section 3. The measurements by Lemaux et al. (2012) are plotted in figure 9 for comparison with our results.

Appendix 2. The catalogs of galaxies confirmed
Tables 4 and 5 shows the catalogs of the red-sequence galaxies and star-forming galaxies that are confirmed by the observations, where the information of object_id, coordinates, magnitude, and color are extracted from the HSC-SSP PDR2 data (Aihara et al. 2019). For reference, only object_id of the S16A data is shown. The S16A data are internally released and used in the original target selection described in section 2. For the red-sequence galaxies, the redshift, equivalent width of H|$\delta$|, and |$D_n4000$| index are measured from the spectra of individual galaxies in sub-subsection 2.2.3 and subsection 3.1. For the star-forming galaxies, the last column of table 5 shows the emission lines detected in the spectra of individual galaxies. In the case that a single emission line is detected, we assume that the line is [O ii] and then the redshift is measured. If required, additional information on the individual galaxies can be extracted from the HSC-SSP PDR2 database, based on object_id.1
List of the 55 confirmed red-sequence galaxies.|$^*$|
| EW(H|$\delta$|) [Å] | EW(H|$\delta$|) [Å] | |$D_n4000$| | |||||||||
|---|---|---|---|---|---|---|---|---|---|---|---|
| Object_id (S16A) | Object_id (PDR2) | RA | Dec | Cluster | z mag. | |$r-z$| | Spectrograph | Redshift | (WO97)† | (Fisher98)† | (Balogh99)† |
| 69617112015996160 | 69617112015996479 | 16:03:40.395 | +42:38:38.425 | S3 | 21.02 | 2.14 | GMOS | 0.890 | −2.10 |$\pm$| 2.77 | −6.05 |$\pm$| 2.78 | 1.70 |$\pm$| 0.12 |
| 69617112015996904 | 69617112015998074 | 16:03:33.596 | +42:39:13.880 | S3 | 21.45 | 2.26 | GMOS | 0.907 | 1.77 |$\pm$| 4.10 | −4.20 |$\pm$| 4.55 | 1.59 |$\pm$| 0.17 |
| 69617112015997316 | 69617112015998454 | 16:03:46.199 | +42:39:30.601 | S3 | 20.20 | 2.15 | GMOS | 0.890 | 1.21 |$\pm$| 2.08 | −4.10 |$\pm$| 2.65 | 1.50 |$\pm$| 0.09 |
| 69617112015972551 | 69617112015998558 | 16:03:40.219 | +42:39:40.821 | S3 | 21.78 | 2.08 | GMOS | 0.910 | — | — | — |
| 69617112015997717 | 69617112015998746 | 16:03:51.500 | +42:39:53.591 | S3 | 21.78 | 2.04 | GMOS | 0.898 | — | — | — |
| 69617112015997796 | 69617112015998848 | 16:03:47.229 | +42:39:57.713 | S3 | 21.11 | 2.03 | GMOS | 1.010 | 3.21 |$\pm$| 1.13 | 4.49 |$\pm$| 0.90 | 1.42 |$\pm$| 0.07 |
| 69617112015997981 | 69617112015999018 | 16:03:34.390 | +42:40:07.680 | S3 | 21.00 | 2.38 | GMOS | 0.903 | 1.27 |$\pm$| 2.26 | 1.05 |$\pm$| 2.21 | 1.56 |$\pm$| 0.11 |
| 69617116310940051 | 69617116310939901 | 16:03:55.668 | +42:50:28.562 | S2 | 20.70 | 1.98 | GMOS | 0.911 | 3.06 |$\pm$| 1.38 | 4.00 |$\pm$| 0.94 | 1.58 |$\pm$| 0.06 |
| 69617116310938517 | 69617116310964806 | 16:03:46.843 | +42:48:53.180 | S2 | 21.94 | 2.14 | GMOS | 0.918 | — | — | — |
| 69617116310965204 | 69617116310965707 | 16:03:48.209 | +42:49:05.619 | S2 | 20.35 | 2.15 | GMOS | 0.920 | 2.24 |$\pm$| 1.23 | 2.90 |$\pm$| 1.26 | 1.53 |$\pm$| 0.08 |
| 69617116310965418 | 69617116310966045 | 16:03:47.753 | +42:49:34.080 | S2 | 21.54 | 2.14 | GMOS | 0.917 | — | — | — |
| 69617116310965615 | 69617116310966133 | 16:03:46.631 | +42:49:45.052 | S2 | 21.80 | 1.84 | GMOS | 0.919 | — | — | — |
| 69617116310965997 | 69617116310966570 | 16:03:46.099 | +42:50:06.593 | S2 | 21.47 | 2.10 | GMOS | 0.916 | 0.98 |$\pm$| 2.86 | −0.04 |$\pm$| 2.70 | 1.79 |$\pm$| 0.11 |
| 69617116310967412 | 69617116310967357 | 16:03:37.715 | +42:51:07.775 | S2 | 21.04 | 1.92 | GMOS | 0.988 | 6.49 |$\pm$| 1.36 | 7.25 |$\pm$| 1.32 | 1.07 |$\pm$| 0.07 |
| 69617116310966811 | 69617116310967364 | 16:03:37.056 | +42:50:48.871 | S2 | 21.28 | 2.09 | GMOS | 0.918 | −1.66 |$\pm$| 2.64 | −2.71 |$\pm$| 3.12 | 1.54 |$\pm$| 0.09 |
| 69617116310966802 | 69617116310967498 | 16:03:50.289 | +42:50:48.359 | S2 | 20.45 | 2.38 | GMOS | 0.988 | 3.80 |$\pm$| 0.95 | 4.37 |$\pm$| 1.28 | 1.68 |$\pm$| 0.09 |
| 69617120605920352 | 69617120605921712 | 16:03:42.419 | +42:51:59.018 | S2 | 21.27 | 1.94 | GMOS | 0.989 | 3.55 |$\pm$| 1.47 | 8.34 |$\pm$| 1.53 | 1.30 |$\pm$| 0.09 |
| 69617120605921126 | 69617120605922446 | 16:03:40.346 | +42:52:36.029 | S2 | 21.46 | 2.05 | GMOS | 0.944 | 0.13 |$\pm$| 2.41 | 2.98 |$\pm$| 2.15 | 2.03 |$\pm$| 0.16 |
| 69617120605921738 | 69617120605923049 | 16:03:35.961 | +42:53:02.321 | S2 | 21.27 | 2.56 | GMOS | 0.948 | 4.50 |$\pm$| 3.00 | 2.82 |$\pm$| 2.96 | 1.77 |$\pm$| 0.16 |
| 69617120605922187 | 69617120605923406 | 16:03:16.712 | +42:53:14.113 | S1 | 20.75 | 2.15 | GMOS | 0.985 | −0.46 |$\pm$| 1.93 | 3.32 |$\pm$| 2.12 | 1.59 |$\pm$| 0.15 |
| 69617120605922445 | 69617120605923568 | 16:03:14.618 | +42:53:28.231 | S1 | 22.09 | 1.91 | GMOS | 0.983 | — | — | — |
| 69617120605923272 | 69617120605924511 | 16:03:24.090 | +42:54:13.470 | S1 | 21.91 | 2.13 | GMOS | 0.921 | — | — | — |
| 69617120605925007 | 69617120605926484 | 16:03:14.817 | +42:55:39.814 | S1 | 22.15 | 1.93 | GMOS | 0.887 | — | — | — |
| 69617120605925117 | 69617120605926513 | 16:03:18.248 | +42:55:42.545 | S1 | 21.81 | 1.77 | GMOS | 0.842 | — | — | — |
| 69617120605925431 | 69617120605926983 | 16:03:20.049 | +42:56:05.017 | S1 | 21.00 | 2.13 | GMOS | 0.949 | −2.26 |$\pm$| 2.30 | −1.63 |$\pm$| 2.59 | 2.30 |$\pm$| 0.14 |
| 69617120605926287 | 69617120605927999 | 16:03:10.009 | +42:56:42.710 | S1 | 21.39 | 2.06 | GMOS | 0.883 | −6.30 |$\pm$| 3.22 | −9.04 |$\pm$| 3.96 | 1.55 |$\pm$| 0.14 |
| 69617258044872416 | 69617258044871201 | 16:03:09.522 | +42:52:03.196 | S1 | 20.86 | 2.10 | GMOS | 0.930 | 3.15 |$\pm$| 2.86 | −0.53 |$\pm$| 2.83 | 1.52 |$\pm$| 0.14 |
| 69617258044872673 | 69617258044871693 | 16:03:08.446 | +42:52:16.457 | S1 | 21.95 | 1.97 | GMOS | 0.975 | — | — | — |
| 69617258044877131 | 69617258044875360 | 16:03:09.587 | +42:55:22.273 | S1 | 21.74 | 2.00 | GMOS | 0.883 | — | — | — |
| 70399543388171802 | 70399543388172272 | 16:03:52.790 | +43:40:02.320 | N1 | 21.09 | 1.96 | GMOS | 0.887 | −2.46 |$\pm$| 3.47 | −8.67 |$\pm$| 3.60 | 1.29 |$\pm$| 0.13 |
| 70399543388149323 | 70399543388173819 | 16:03:53.691 | +43:41:08.039 | N1 | 21.76 | 2.09 | GMOS | 0.933 | — | — | — |
| 70399543388174556 | 70399543388174278 | 16:03:47.435 | +43:41:33.969 | N1 | 20.59 | 2.18 | FOCAS | 0.929 | 0.64 |$\pm$| 1.55 | 1.42 |$\pm$| 1.50 | 2.03 |$\pm$| 0.12 |
| 70399543388175946 | 70399543388175701 | 16:03:52.016 | +43:42:35.393 | N1 | 21.48 | 2.09 | FOCAS | 0.943 | −5.10 |$\pm$| 3.26 | −2.72 |$\pm$| 2.79 | 1.90 |$\pm$| 0.19 |
| 70399543388176326 | 70399543388176068 | 16:03:50.260 | +43:42:54.783 | N1 | 21.85 | 2.02 | GMOS | 0.871 | — | — | — |
| 70399543388176450 | 70399543388176321 | 16:03:51.211 | +43:43:07.084 | N1 | 20.51 | 2.12 | FOCAS | 0.874 | −1.52 |$\pm$| 1.48 | −0.32 |$\pm$| 1.18 | 2.33 |$\pm$| 0.14 |
| 70399543388176621 | 70399543388176379 | 16:03:56.928 | +43:43:12.446 | N1 | 20.72 | 2.21 | GMOS | 0.930 | 2.62 |$\pm$| 2.72 | −1.48 |$\pm$| 2.92 | 1.71 |$\pm$| 0.12 |
| 70399543388177131 | 70399543388176965 | 16:04:02.224 | +43:43:42.694 | N1 | 21.06 | 2.17 | GMOS | 0.928 | −3.75 |$\pm$| 5.22 | −1.37 |$\pm$| 3.99 | 1.82 |$\pm$| 0.23 |
| 70399543388177394 | 70399543388177274 | 16:03:51.068 | +43:43:55.430 | N1 | 21.43 | 1.93 | FOCAS | 0.879 | 3.45 |$\pm$| 2.40 | 3.19 |$\pm$| 2.47 | 1.91 |$\pm$| 0.19 |
| 70399543388177404 | 70399543388177291 | 16:03:55.002 | +43:43:56.749 | N1 | 21.62 | 2.22 | GMOS | 0.921 | — | — | — |
| 70399543388177612 | 70399543388177324 | 16:04:00.444 | +43:44:08.426 | N1 | 22.32 | 2.07 | FOCAS | 0.975 | — | — | — |
| 70399543388177604 | 70399543388177513 | 16:03:55.311 | +43:44:03.279 | N1 | 21.48 | 2.15 | FOCAS | 0.912 | 7.52 |$\pm$| 3.82 | 9.16 |$\pm$| 3.47 | 1.60 |$\pm$| 0.16 |
| 70399543388177641 | 70399543388177524 | 16:03:54.306 | +43:44:04.750 | N1 | 21.37 | 2.25 | GMOS | 0.928 | −4.41 |$\pm$| 4.87 | 0.19 |$\pm$| 3.43 | 2.00 |$\pm$| 0.22 |
| 70399543388177700 | 70399543388177564 | 16:03:52.119 | +43:44:17.076 | N1 | 20.54 | 1.88 | FOCAS | 0.881 | −1.26 |$\pm$| 1.85 | 1.98 |$\pm$| 2.04 | 1.83 |$\pm$| 0.10 |
| 70399543388177702 | 70399543388177566 | 16:03:52.277 | +43:44:18.158 | N1 | 20.06 | 2.71 | FOCAS | 0.884 | 1.59 |$\pm$| 1.40 | −0.85 |$\pm$| 1.49 | 1.86 |$\pm$| 0.09 |
| 70399543388177737 | 70399543388177865 | 16:03:54.781 | +43:44:29.036 | N1 | 21.66 | 2.07 | FOCAS | 0.888 | — | — | — |
| 70399543388152808 | 70399543388177938 | 16:03:48.655 | +43:44:24.062 | N1 | 21.99 | 2.16 | GMOS | 0.929 | — | — | — |
| 70399543388178162 | 70399543388178065 | 16:04:02.859 | +43:44:25.165 | N1 | 22.21 | 2.15 | FOCAS | 0.881 | — | — | — |
| 70399543388178592 | 70399543388178703 | 16:03:49.598 | +43:45:00.030 | N1 | 21.41 | 2.02 | GMOS | 0.930 | 1.40 |$\pm$| 6.67 | −5.01 |$\pm$| 6.71 | 2.16 |$\pm$| 0.34 |
| 70399543388178729 | 70399543388178779 | 16:03:44.668 | +43:44:58.905 | N1 | 20.44 | 2.20 | GMOS | 0.970 | −0.40 |$\pm$| 1.43 | 1.85 |$\pm$| 1.45 | 1.72 |$\pm$| 0.11 |
| 70399543388154281 | 70399543388179847 | 16:03:53.212 | +43:45:41.672 | N1 | 21.92 | 2.23 | GMOS | 0.867 | — | — | — |
| 70405040946315068 | 70405040946315286 | 16:04:09.272 | +43:43:43.364 | N1 | 22.14 | 2.17 | FOCAS | 0.882 | — | — | — |
| 70405040946315628 | 70405040946315935 | 16:04:04.083 | +43:44:17.812 | N1 | 20.11 | 2.14 | FOCAS | 0.920 | 3.65 |$\pm$| 1.58 | 3.24 |$\pm$| 1.36 | 2.02 |$\pm$| 0.09 |
| 70405040946316160 | 70405040946316384 | 16:04:04.581 | +43:44:30.831 | N1 | 22.07 | 2.26 | FOCAS | 0.854 | — | — | — |
| 70405040946316183 | 70405040946316459 | 16:04:08.803 | +43:44:36.930 | N1 | 20.94 | 1.93 | FOCAS | 0.920 | 2.68 |$\pm$| 0.93 | 2.22 |$\pm$| 0.93 | 1.54 |$\pm$| 0.05 |
| 70405040946317856 | 70405040946318093 | 16:04:05.887 | +43:45:44.182 | N1 | 21.76 | 2.06 | FOCAS | 0.824 | — | — | — |
The same as table 4, but for the 82 confirmed star-forming galaxies.|$^{*}$|
| Emission lines detected|$^*$| | |||||||||||
|---|---|---|---|---|---|---|---|---|---|---|---|
| Object_id (S16A) | Object_id (PDR2) | RA | Dec | Cluster | z mag. | |$r-z$| | Spectrograph | Redshift | [O ii]3727 | H|$\beta$| | [O iii]5007 |
| 69617112015971747 | 69617112015972223 | 16:03:41.447 | +42:38:53.698 | S3 | 22.20 | 1.01 | GMOS | 0.891 | |$\circ$| | |$\circ$| | |$\circ$| |
| 69617112015998043 | 69617112015973587 | 16:03:43.742 | +42:40:12.950 | S3 | 23.89 | 1.13 | GMOS | 0.878 | |$\circ$| | |$\circ$| | |$\circ$| |
| 69617112015994346 | 69617112015995528 | 16:03:41.877 | +42:37:15.491 | S3 | 22.85 | 0.84 | GMOS | 0.895 | |$\circ$| | |$\circ$| | |$\circ$| |
| 69617112015995059 | 69617112015996295 | 16:03:48.869 | +42:37:57.262 | S3 | 22.22 | 0.47 | GMOS | 0.895 | |$\circ$| | |$\circ$| | |$\circ$| |
| 69617112015995799 | 69617112015996841 | 16:03:34.176 | +42:38:16.865 | S3 | 22.36 | 1.11 | GMOS | 0.902 | |$\circ$| | |$\circ$| | |$\times$| |
| 69617112015995802 | 69617112015996843 | 16:03:35.001 | +42:38:20.476 | S3 | 22.20 | 1.00 | GMOS | 1.009 | |$\circ$| | |$\circ$| | |$\times$| |
| 69617112015995909 | 69617112015996963 | 16:03:35.844 | +42:38:25.340 | S3 | 23.41 | 0.91 | GMOS | 0.986 | |$\circ$| | |$\times$| | |$\times$| |
| 69617112015996131 | 69617112015997201 | 16:03:35.224 | +42:38:37.830 | S3 | 21.14 | 1.15 | GMOS | 0.884 | |$\circ$| | |$\circ$| | |$\circ$| |
| 69617112015997302 | 69617112015998278 | 16:03:43.310 | +42:39:31.621 | S3 | 21.83 | 1.04 | GMOS | 0.877 | |$\circ$| | |$\circ$| | |$\circ$| |
| 69617112015997635 | 69617112015998643 | 16:03:55.195 | +42:39:47.280 | S3 | 22.51 | 0.96 | GMOS | 0.916 | |$\circ$| | |$\times$| | |$\circ$| |
| 69617112015997683 | 69617112015998696 | 16:03:33.160 | +42:39:53.549 | S3 | 22.81 | 0.88 | GMOS | 0.903 | |$\circ$| | |$\times$| | |$\times$| |
| 69617112015997789 | 69617112015998795 | 16:03:56.552 | +42:39:55.355 | S3 | 22.88 | 0.81 | GMOS | 0.932 | |$\circ$| | |$\times$| | |$\circ$| |
| 69617112015997875 | 69617112015998896 | 16:03:48.370 | +42:40:02.643 | S3 | 23.27 | 0.63 | GMOS | 0.907 | |$\circ$| | |$\circ$| | |$\circ$| |
| 69617112015998121 | 69617112015999163 | 16:03:30.843 | +42:40:17.391 | S3 | 23.13 | 1.09 | GMOS | 0.902 | |$\circ$| | |$\times$| | — |
| 69617112015998126 | 69617112015999228 | 16:03:37.178 | +42:40:20.260 | S3 | 23.22 | 1.07 | GMOS | 0.854 | |$\circ$| | |$\times$| | |$\circ$| |
| 69617116310940018 | 69617116310939871 | 16:03:33.639 | +42:50:26.516 | S2 | 22.84 | 1.43 | GMOS | 0.881 | |$\circ$| | |$\circ$| | |$\circ$| |
| 69617116310940107 | 69617116310939957 | 16:03:36.047 | +42:50:31.268 | S2 | 23.60 | 1.01 | GMOS | 0.847 | |$\circ$| | |$\times$| | |$\times$| |
| 69617116310954407 | 69617116310954387 | 16:03:37.944 | +42:41:30.252 | S3 | 23.22 | 1.15 | GMOS | 0.901 | |$\circ$| | |$\circ$| | |$\times$| |
| 69617116310955103 | 69617116310955133 | 16:03:37.582 | +42:42:06.415 | S3 | 23.82 | 0.71 | GMOS | 0.903 | |$\circ$| | |$\circ$| | — |
| 69617116310955318 | 69617116310955367 | 16:03:37.297 | +42:42:16.047 | S3 | 22.12 | 0.98 | GMOS | 0.901 | |$\circ$| | |$\circ$| | — |
| 69617116310955586 | 69617116310955661 | 16:03:41.623 | +42:42:39.416 | S3 | 22.18 | 0.92 | GMOS | 0.911 | |$\circ$| | |$\circ$| | |$\times$| |
| 69617116310955800 | 69617116310955864 | 16:03:36.450 | +42:42:44.562 | S3 | 23.17 | 1.05 | GMOS | 1.032 | |$\circ$| | — | — |
| 69617116310956200 | 69617116310956331 | 16:03:43.304 | +42:42:58.427 | S3 | 22.35 | 0.96 | GMOS | 0.949 | |$\circ$| | |$\times$| | — |
| 69617116310965358 | 69617116310965934 | 16:03:44.390 | +42:49:27.582 | S2 | 22.47 | 0.79 | GMOS | 0.897 | |$\circ$| | |$\circ$| | |$\circ$| |
| 69617116310965750 | 69617116310966450 | 16:03:46.985 | +42:49:58.922 | S2 | 23.07 | 1.20 | GMOS | 0.915 | |$\circ$| | |$\times$| | |$\times$| |
| 69617116310965831 | 69617116310966562 | 16:03:38.822 | +42:49:57.133 | S2 | 23.33 | 0.42 | GMOS | 0.883 | |$\circ$| | |$\circ$| | |$\circ$| |
| 69617116310966485 | 69617116310967306 | 16:03:55.025 | +42:50:33.612 | S2 | 22.23 | 1.33 | GMOS | 0.910 | |$\circ$| | |$\circ$| | — |
| 69617116310940789 | 69617116310968260 | 16:03:46.155 | +42:51:12.847 | S2 | 23.72 | 1.20 | GMOS | 0.944 | |$\circ$| | |$\times$| | |$\times$| |
| 69617116310967672 | 69617116310968440 | 16:03:54.928 | +42:51:19.114 | S2 | 23.72 | 0.89 | GMOS | 0.957 | |$\circ$| | — | — |
| 69617116310967867 | 69617116310968531 | 16:03:44.318 | +42:51:29.132 | S2 | 23.38 | 1.11 | GMOS | 0.956 | |$\circ$| | |$\times$| | |$\circ$| |
| 69617120605898714 | 69617120605898781 | 16:03:54.415 | +42:53:31.323 | S2 | 22.37 | 0.86 | GMOS | 1.054 | |$\circ$| | — | — |
| 69617120605899000 | 69617120605899079 | 16:03:17.325 | +42:53:51.542 | S1 | 22.10 | 1.25 | GMOS | 0.983 | |$\circ$| | |$\circ$| | |$\times$| |
| 69617120605899227 | 69617120605899310 | 16:03:22.279 | +42:54:05.236 | S1 | 22.93 | 0.87 | GMOS | 0.949 | |$\circ$| | |$\times$| | |$\circ$| |
| 69617120605899657 | 69617120605899755 | 16:03:30.230 | +42:54:31.474 | S1 | 22.48 | 0.52 | GMOS | 0.891 | |$\circ$| | |$\circ$| | |$\circ$| |
| 69617120605899803 | 69617120605899905 | 16:03:17.542 | +42:54:39.815 | S1 | 23.59 | 0.97 | GMOS | 0.987 | |$\circ$| | |$\times$| | |$\times$| |
| 69617120605897004 | 69617120605921438 | 16:03:11.168 | +42:51:51.535 | S1 | 22.68 | 1.00 | GMOS | 0.979 | |$\circ$| | |$\times$| | |$\times$| |
| 69617120605920797 | 69617120605922105 | 16:03:27.971 | +42:52:16.585 | S1 | 22.80 | 1.19 | GMOS | 0.946 | |$\circ$| | |$\times$| | |$\times$| |
| 69617120605920815 | 69617120605922137 | 16:03:47.543 | +42:52:16.158 | S2 | 23.53 | 0.42 | GMOS | 0.954 | |$\circ$| | |$\times$| | |$\circ$| |
| 69617120605921069 | 69617120605922379 | 16:03:28.520 | +42:52:31.786 | S1 | 22.87 | 0.94 | GMOS | 1.033 | |$\circ$| | |$\circ$| | |$\circ$| |
| 69617120605921347 | 69617120605922626 | 16:03:47.224 | +42:52:49.718 | S2 | 23.09 | 1.10 | GMOS | 1.071 | |$\circ$| | |$\times$| | — |
| 69617120605921273 | 69617120605922639 | 16:03:31.879 | +42:52:46.904 | S2 | 22.65 | 0.82 | GMOS | 0.989 | |$\circ$| | |$\circ$| | |$\times$| |
| 69617120605921450 | 69617120605922659 | 16:03:15.737 | +42:52:59.612 | S1 | 23.06 | 0.99 | GMOS | 0.882 | |$\circ$| | |$\circ$| | |$\circ$| |
| 69617120605922162 | 69617120605923361 | 16:03:56.630 | +42:53:12.514 | S2 | 21.81 | 1.07 | GMOS | 0.956 | |$\circ$| | — | — |
| 69617120605922575 | 69617120605923738 | 16:03:55.681 | +42:53:24.606 | S2 | 21.63 | 1.58 | GMOS | 0.987 | |$\circ$| | — | — |
| 69617120605922682 | 69617120605923835 | 16:03:16.698 | +42:53:38.852 | S1 | 22.68 | 1.02 | GMOS | 0.885 | |$\circ$| | |$\circ$| | |$\times$| |
| 69617120605922760 | 69617120605923979 | 16:03:49.229 | +42:53:40.665 | S2 | 22.78 | 0.89 | GMOS | 0.899 | |$\circ$| | |$\circ$| | |$\circ$| |
| 69617120605922974 | 69617120605924154 | 16:03:12.469 | +42:53:53.035 | S1 | 21.38 | 1.16 | GMOS | 0.846 | |$\circ$| | |$\circ$| | |$\circ$| |
| 69617120605923017 | 69617120605924233 | 16:03:49.656 | +42:53:57.493 | S2 | 21.75 | 0.73 | GMOS | 0.918 | |$\circ$| | |$\circ$| | |$\circ$| |
| 69617120605924331 | 69617120605925643 | 16:03:14.368 | +42:55:04.030 | S1 | 23.13 | 0.65 | GMOS | 0.888 | |$\circ$| | |$\circ$| | |$\circ$| |
| 69617120605924664 | 69617120605926078 | 16:03:19.527 | +42:55:24.706 | S1 | 22.37 | 1.04 | GMOS | 1.024 | |$\circ$| | |$\circ$| | |$\times$| |
| 69617120605925260 | 69617120605926785 | 16:03:20.346 | +42:55:51.081 | S1 | 23.35 | 0.94 | GMOS | 0.950 | |$\circ$| | |$\times$| | |$\times$| |
| 69617120605926252 | 69617120605927966 | 16:03:15.560 | +42:56:41.023 | S1 | 22.42 | 0.84 | GMOS | 0.921 | |$\circ$| | |$\times$| | |$\circ$| |
| 69617120605926493 | 69617120605928199 | 16:03:14.152 | +42:56:53.532 | S1 | 22.74 | 1.22 | GMOS | 0.985 | |$\circ$| | |$\times$| | |$\times$| |
| 69617258044851644 | 69617258044851490 | 16:03:02.811 | +42:53:06.735 | S1 | 22.00 | 0.86 | GMOS | 0.870 | |$\circ$| | |$\circ$| | — |
| 70399543388150085 | 70399543388150126 | 16:03:50.626 | +43:41:51.193 | N1 | 22.91 | 1.03 | FOCAS | 0.925 | |$\circ$| | |$\times$| | |$\circ$| |
| 70399543388150702 | 70399543388150768 | 16:03:47.106 | +43:42:28.087 | N1 | 21.89 | 1.09 | FOCAS | 0.900 | |$\circ$| | |$\circ$| | |$\times$| |
| 70399543388152173 | 70399543388152246 | 16:04:02.804 | +43:43:47.343 | N1 | 23.63 | 0.62 | FOCAS | 0.922 | |$\circ$| | |$\times$| | |$\circ$| |
| 70399543388152733 | 70399543388152811 | 16:03:58.077 | +43:44:19.520 | N1 | 21.39 | 1.38 | FOCAS | 0.878 | |$\circ$| | |$\circ$| | |$\times$| |
| 70399543388171595 | 70399543388172114 | 16:03:47.840 | +43:39:48.928 | N1 | 22.37 | 1.05 | GMOS | 0.886 | |$\circ$| | |$\times$| | |$\times$| |
| 70399543388172392 | 70399543388172832 | 16:03:51.969 | +43:40:27.033 | N1 | 21.85 | 0.89 | GMOS | 1.003 | |$\circ$| | |$\circ$| | |$\circ$| |
| 70399543388173927 | 70399543388173733 | 16:03:44.656 | +43:41:04.128 | N1 | 22.80 | 0.74 | GMOS | 0.968 | |$\circ$| | |$\times$| | |$\times$| |
| 70399543388149456 | 70399543388173932 | 16:03:48.794 | +43:41:15.429 | N1 | 24.05 | 0.88 | GMOS | 0.886 | |$\circ$| | |$\times$| | |$\times$| |
| 70399543388174650 | 70399543388174469 | 16:03:55.586 | +43:41:37.081 | N1 | 22.03 | 0.91 | GMOS | 0.881 | |$\circ$| | |$\circ$| | |$\times$| |
| 70399543388174704 | 70399543388174546 | 16:03:53.369 | +43:41:35.007 | N1 | 22.78 | 1.33 | GMOS | 0.977 | |$\circ$| | |$\times$| | |$\times$| |
| 70399543388175703 | 70399543388175368 | 16:03:49.671 | +43:42:18.209 | N1 | 23.04 | 0.94 | FOCAS | 0.983 | |$\circ$| | |$\times$| | |$\times$| |
| 70399543388175737 | 70399543388175424 | 16:03:52.191 | +43:42:20.824 | N1 | 21.12 | 1.22 | FOCAS | 0.977 | |$\circ$| | |$\circ$| | |$\times$| |
| 70399543388151060 | 70399543388175950 | 16:03:38.739 | +43:42:49.163 | N1 | 22.60 | 0.59 | GMOS | 0.978 | |$\circ$| | |$\circ$| | |$\circ$| |
| 70399543388176189 | 70399543388175958 | 16:03:53.693 | +43:42:46.050 | N1 | 21.95 | 1.02 | FOCAS | 0.919 | |$\circ$| | |$\times$| | |$\times$| |
| 70399543388176413 | 70399543388176183 | 16:03:42.241 | +43:43:07.711 | N1 | 23.05 | 1.10 | GMOS | 0.964 | |$\circ$| | |$\times$| | |$\times$| |
| 70399543388176687 | 70399543388176496 | 16:03:55.607 | +43:43:17.332 | N1 | 22.91 | 1.11 | GMOS | 0.977 | |$\circ$| | |$\times$| | |$\times$| |
| 70399543388176843 | 70399543388176655 | 16:03:46.502 | +43:43:26.261 | N1 | 22.81 | 0.69 | FOCAS | 0.927 | |$\circ$| | |$\circ$| | |$\circ$| |
| 70399543388177267 | 70399543388177159 | 16:03:59.120 | +43:43:48.143 | N1 | 21.40 | 1.10 | FOCAS | 0.878 | |$\circ$| | |$\circ$| | |$\times$| |
| 70399543388177396 | 70399543388177276 | 16:03:51.165 | +43:44:00.382 | N1 | 23.16 | 0.99 | GMOS | 0.899 | |$\circ$| | |$\circ$| | |$\times$| |
| 70399543388177591 | 70399543388177499 | 16:04:02.434 | +43:44:04.793 | N1 | 22.41 | 1.07 | FOCAS | 0.886 | |$\circ$| | |$\circ$| | |$\times$| |
| 70399543388178430 | 70399543388178480 | 16:03:57.669 | +43:44:41.039 | N1 | 23.46 | 1.02 | FOCAS | 0.962 | |$\circ$| | |$\times$| | |$\times$| |
| 70399543388178966 | 70399543388179016 | 16:03:42.631 | +43:45:05.567 | N1 | 21.44 | 1.02 | GMOS | 0.951 | |$\circ$| | |$\times$| | |$\circ$| |
| 70399543388179063 | 70399543388179128 | 16:03:55.791 | +43:45:10.326 | N1 | 22.88 | 0.84 | GMOS | 1.012 | |$\circ$| | — | — |
| 70399543388179264 | 70399543388179385 | 16:03:55.148 | +43:45:19.152 | N1 | 22.82 | 0.82 | GMOS | 0.881 | |$\circ$| | |$\circ$| | |$\times$| |
| 70399680827104655 | 70399680827105070 | 16:03:36.322 | +43:43:11.819 | N1 | 23.62 | 0.99 | GMOS | 0.951 | |$\circ$| | |$\times$| | |$\circ$| |
| 70405040946312845 | 70405040946316403 | 16:04:06.637 | +43:44:42.294 | N1 | 22.04 | 0.82 | FOCAS | 0.884 | |$\circ$| | |$\circ$| | |$\circ$| |
| 70405040946312828 | 70405040946316492 | 16:04:04.500 | +43:44:46.922 | N1 | 19.96 | 1.35 | FOCAS | 0.868 | |$\circ$| | |$\circ$| | |$\times$| |
| 70405040946317759 | 70405040946317910 | 16:04:07.673 | +43:45:37.973 | N1 | 22.18 | 0.91 | FOCAS | 0.890 | |$\circ$| | |$\circ$| | |$\circ$| |
*In the last column, detection and non-detection of the line is shown by |$\circ$| or |$\times$|, respectively, and “—” means that the spectrum does not cover the wavelength for the emission line.
Footnotes
|$\langle$| https://hsc.mtk.nao.ac.jp/ssp/ |$\rangle$|.
IRAF is distributed by the National Optical Astronomy Observatory, which is operated by the Association of Universities for Research in Astronomy (AURA) under a cooperative agreement with the National Science Foundation.
PyRAF is a product of the Space Telescope Science Institute, which is operated by AURA for NASA.
|$\langle$| http://ast.noao.edu/sites/default/files/GMOS_Cookbook/ |$\rangle$|.
|$\langle$| https://github.com/cschreib/fastpp |$\rangle$|.
|$\langle$| http://www.bruzual.org/bc03/ |$\rangle$|.
|$\langle$| https://wwwmpa.mpa-garching.mpg.de/SDSS/DR7/ |$\rangle$|.
References
