


Abstract
We present ALMA [C ii] line and far-infrared (FIR) continuum observations of three |$z \gt 6$| low-luminosity quasars (|$M_{\rm 1450} \gt -25$| mag) discovered by our Subaru Hyper Suprime-Cam (HSC) survey. The [C ii] line was detected in all three targets with luminosities of |$(2.4\mbox{--}9.5) \times 10^8\, L_{\odot }$|, about one order of magnitude smaller than optically luminous (|$M_{\rm 1450} \lesssim -25$| mag) quasars. The FIR continuum luminosities range from |$\lt 9 \times 10^{10}\, L_{\odot }$| (3 |$\sigma$| limit) to |${\sim } 2 \times 10^{12}\, L_{\odot }$|, indicating a wide range in star formation rates in these galaxies. Most of the HSC quasars studied thus far show [C ii]/ FIR luminosity ratios similar to local star-forming galaxies. Using the [C ii]-based dynamical mass (|$M_{\rm dyn}$|) as a surrogate for bulge stellar mass (|$M_{\rm\, bulge}$|), we find that a significant fraction of low-luminosity quasars are located on or even below the local |$M_{\rm\, BH}$|–|$M_{\rm\, bulge}$| relation, particularly at the massive end of the galaxy mass distribution. In contrast, previous studies of optically luminous quasars have found that black holes are overmassive relative to the local relation. Given the low luminosities of our targets, we are exploring the nature of the early co-evolution of supermassive black holes and their hosts in a less biased way. Almost all of the quasars presented in this work are growing their black hole mass at a much higher pace at |$z \sim 6$| than the parallel growth model, in which supermassive black holes and their hosts grow simultaneously to match the local |$M_{\rm\, BH}$|–|$M_{\rm\, bulge}$| relation at all redshifts. As the low-luminosity quasars appear to realize the local co-evolutionary relation even at |$z \sim 6$|, they should have experienced vigorous starbursts prior to the currently observed quasar phase to catch up with the relation.
1 Introduction
The discovery of a tight correlation between the masses of central supermassive black holes (|$M_{\rm BH}$|) and those of galactic bulges (|$M_{\rm bulge}$|) or the stellar velocity dispersion in the local universe (e.g., Magorrian et al. 1998; Ferrarese & Merritt 2000; Marconi & Hunt 2003; Kormendy & Ho 2013) strongly suggests that the formation and growth of supermassive black holes (SMBHs) and their host galaxies are intimately linked, and the two undergo a co-evolution. Although the detailed mechanism by which the correlation arises is unclear, theoretical models suggest that radiative and kinetic feedback of active galactic nuclei (AGNs)
connected to the merger histories of galaxies play a pivotal role (e.g., Granato et al. 2004; Di Matteo et al. 2005; Hopkins et al. 2006; Li et al. 2007). Recent high-resolution simulation work based on this scheme suggests that even a quasar at |$z = 7$| would follow the local co-evolution relation once we properly assess the mass of the host galaxy (Lupi et al. 2019). Detections of galaxy-scale massive AGN-driven outflows (e.g., Nesvadba et al. 2008; Maiolino et al. 2012; Cicone et al. 2014; Carniani et al. 2016; Toba et al. 2017), as well as the remarkable similarity of global star formation and SMBH accretion histories (for a review, see Madau & Dickinson 2014) would support this evolutionary scheme. As theoretical models usually make specific predictions for the time evolution of the systems, observations of the physical properties of both SMBHs and their host galaxies over cosmic time are essential to test and/or refine our current understanding of their development (Gallerani et al. 2017; Valiante et al. 2017).
From this perspective, high-redshift quasars are a unique beacon of the early formation of SMBHs and their host galaxies, even in the first billion years of the universe (e.g., Mortlock et al. 2011; Bañados et al. 2018; Matsuoka et al. 2019). The last two decades have witnessed the discovery of |$\gt 200$| quasars at |$z \gt 5.7$| owing to wide-field optical and near-infrared (NIR) surveys, including the Sloan Digital Sky Survey (SDSS; e.g., Fan et al. 2003, 2006; Jiang et al. 2016), the Canada–France High-z Quasar Survey (CFHQS; e.g., Willott et al. 2007, 2010a), the Visible and Infrared Survey Telescope for Astronomy (VISTA) Kilo-degree Infrared Galaxy (VIKING; Venemans et al. 2013, 2015b), the United Kingdom Infrared Telescope (UKIRT) Infrared Deep Sky Survey (UKIDSS; Mortlock et al. 2009, 2011; Bañados et al. 2018), the Panoramic Survey Telescope & Rapid Response System (Pan-STARRS1; Bañados et al. 2014, 2016; Mazzucchelli et al. 2017), and several other projects (e.g., Kashikawa et al. 2015; Carnall et al. 2015; Kim et al. 2015; Tang et al. 2017; Reed et al. 2017). These surveys have found that luminous (absolute UV magnitude |$M_{\rm 1450} \lesssim -25$| mag) quasars at |$z \gtrsim 6$| are typically powered by SMBHs heavier than one billion solar masses and appear metal-enriched (e.g., Mortlock et al. 2011; De Rosa et al. 2014; Wu et al. 2015; Shen et al. 2019).
As host galaxies of |$z \gt 4$| quasars are hard to detect at rest-frame ultraviolet (UV) to optical wavelengths (Mechtley et al. 2012), longer wavelengths (i.e., far-infrared = FIR and sub/millimeter = sub/mm) cold gas and dust emission from star-forming regions have been used to probe such galaxies instead. These host galaxies possess copious amount of dust (|${\sim } 10^8\, M_{\odot }$|) and gas (|${\sim } 10^{10}\, M_{\odot }$|) with high FIR luminosities likely due to intense starburst (star formation rate |$\gtrsim 100\mbox{--}1000 \, M_\odot$| yr|$^{-1}$|) at |$z \gt 6$| (e.g., Bertoldi et al. 2003a, 2003b; Petric et al. 2003; Priddey et al. 2003, 2008; Walter et al. 2004; Wang et al. 2007, 2008, 2011a, 2011b). These gaseous and dusty starburst regions appear to be spatially compact, with sizes of a few kpc or less (e.g., Wang et al. 2013; Venemans et al. 2017a), corresponding to the typical size of nearby bulges.
Among various emission lines of atoms and molecules in the cold interstellar medium (ISM), the fine structure line of singly ionized carbon, the 157.74 μm [C ii] |${}^{2}P_{3/2} \rightarrow {}^{2}P_{1/2}$| emission line (rest frequency |$\nu _{\rm rest} = 1900.5369$| GHz), of |$z \gtrsim 6$| objects can be conveniently observed with ground-based sub/mm telescopes owing to an atmospheric window of |${\sim } 250$| GHz. The [C ii] line is the main coolant of the cold ISM, particularly of photodissociation regions (Hollenbach & Tielens 1999), which makes this line an important tracer of star-forming activity. Sub/mm interferometers such as the Atacama Large Millimeter/submillimeter Array (ALMA) and the IRAM Plateau de Bure Interferometer (PdBI, now NOEMA) have sufficient resolution and sensitivity to resolve the gas dynamics of galaxies hosting not only optically luminous quasars (e.g., Wang et al. 2013, 2016; Bañados et al. 2015; Cicone et al. 2015; Venemans et al. 2016, 2017a, 2017b; Decarli et al. 2017, 2018; Mazzucchelli et al. 2017; Shao et al. 2017) but also low-luminosity (|$M_{\rm 1450} \gtrsim -25$| mag) quasars (Willott et al. 2013, 2015, 2017; Izumi et al. 2018b).
Those high-resolution studies have provided the dynamical masses of the host galaxies. They have found that |$z \gtrsim 6$| luminous quasars have ratios of SMBH mass to host galaxy mass |${\sim } 10$| times larger than the |$z \sim 0$| relation, implying that these SMBHs formed significantly earlier than their hosts. However, there may be an observational bias, whereby more luminous quasars are powered by more massive SMBHs at high redshifts. This affects how closely these observations trace the underlying SMBH mass function at |$z \gtrsim 6$| if there is a large scatter in |$M_{\rm BH}$| for a given galaxy mass (e.g., Lauer et al. 2007; Schulze & Wisotzki 2014). Indeed, early observations of low-luminosity CFHQS quasars showed that they are powered by less massive SMBHs (|${\sim } 10^8\, M_{\odot }$|), and show SMBH mass to bulge mass ratios roughly consistent with local galaxies (Willott et al. 2013, 2015, 2017). Thus, to achieve a comprehensive view of the early co-evolution of SMBHs and galaxies, observations of less luminous (or smaller |$M_{\rm BH}$|) quasars are needed.
With this in mind, we have conducted ALMA pilot observations of several low-optical-luminosity quasars discovered in an ongoing deep multi-band (|$g, r, i, z, y$|), wide-area imaging survey (Aihara et al. 2018a) with the Hyper Suprime-Cam (HSC; Miyazaki et al. 2018; Komiyama et al. 2018; Kawanomoto et al. 2018; Furusawa et al. 2018) mounted on the 8.2 m Subaru telescope. We have so far discovered more than 80 low-luminosity quasars at |$z \gtrsim 6$| down to |$M_{\rm 1450} \sim -22$| mag in this survey (Matsuoka et al. 2016, 2018b, 2018c), including one |$z \gt 7$| object (Matsuoka et al. 2019). Most of these quasars constitute the break of the |$z \sim 6$| quasar luminosity function (Matsuoka et al. 2018a), indicating that they represent the bulk of the quasar population at that high redshift. We then organized an intensive multi-wavelength follow-up consortium: Subaru High-z Exploration of Low-Luminosity Quasars (SHELLQs). In Izumi et al. (2018b) we presented Cycle 4 ALMA observations toward four |$z \gtrsim 6$| HSC quasars in the [C ii] line and |$1.2\:$|mm continuum. The [C ii] and continuum luminosities of those HSC quasars are both comparable to local luminous infrared galaxy (LIRG)-class objects, suggesting that most of the quasar-host galaxies are less extreme starburst objects than has been found for luminous quasars. Like the CFHQS quasars, our HSC quasars tend to show SMBH mass to galaxy mass ratios similar to, or even lower than, the local co-evolution relation, which is also a clear contrast to their luminous counterparts.
In this paper we report our ALMA Cycle 5 observations of [C ii] and the underlying FIR continuum emission towards another three low-luminosity HSC quasars. We describe the observations in section 2. The basic observed properties of both the [C ii] line and the underlying FIR continuum emission are given in section 3. We then discuss the [C ii]|$/$|FIR luminosity ratio as an ISM diagnostic, and the less biased early co-evolution of SMBHs and galaxies in section 4. Our findings are basically consistent with our previous Cycle 4 work (Izumi et al. 2018b): we summarize them in section 5. Throughout the paper we adopt the cosmological parameters |$H_0 = 70$| km s|$^{-1}$| Mpc|$^{-1}$|, |$\Omega _{\rm M} = 0.3$|, and |$\Omega _{\rm \Lambda } = 0.7$|.
2 Observations and data reduction
Three |$z \gt 6$| HSC quasars were observed during ALMA Cycle 5 (ID = 2017.1.00541.S, PI: T. Izumi) at band 6 between 2018 March 20 and 26. Our observations are summarized in table 1, along with the basic target information. These observations were each conducted in a single pointing with a |${\sim } 25^{\prime \prime }$| diameter field of view (FoV), which corresponds to |${\sim } 140$| kpc at the source redshifts (|$1^{\prime \prime }$||$\sim$| 5.6 kpc). The phase tracking centers were set to the optical quasar locations (Matsuoka et al. 2018c). The absolute positional uncertainty is |${\sim } {0{^{\prime \prime }_{.}}1}$| according to the ALMA Knowledgebase.1 With the minimum baseline length (15.1 m), the maximum recoverable scales of our observations are |${\sim }{9^{\prime\prime}_{.}}5$|.
Description of our sample and the ALMA observations.|$^*$|
| J1208−0200 | J2228+0152 | J2239+0207 | |
|---|---|---|---|
| RA (J2000.0) | |${12^\rm h}{08^\rm m}{59^{\rm s}_{.}}22$| | |${22^\rm h}{28^\rm m}{47^{\rm s}_{.}}71$| | |${22^\rm h}{39^\rm m}{47^{\rm s}_{.}}48$| |
| Dec (J2000.0) | |${-02{^{\circ}}00^{\prime}34^{\prime\prime}_{.}9}$| | |${+01{^{\circ}}52^{\prime}40^{\prime\prime}_{.}4}$| | |${+02{^{\circ}}07^{\prime}47^{\prime\prime}_{.}4}$| |
| |$z_{\rm Ly\alpha }$| | 6.2† | 6.08 | 6.26† |
| |$M_{\rm 1450}$| (mag) | |$-$|24.3 | |$-$|24.0 | |$-$|24.6 |
| Number of antennas | 44–46 | 44–47 | 46–47 |
| Baseline (m) | 15.1–783.5 | 15.1–783.5 | 15.1–783.5 |
| On-source time (minutes) | 87 | 87 | 65 |
| Bandpass calibrator | J1229|$+$|0203 | J2148|$+$|0657 | J2148|$+$|0657 |
| Complex gain calibrator | J1218|$-$|0119 | J2226|$+$|0052 | J2226|$+$|0052 |
| Flux calibrator | J1229|$+$|0203 | J2148|$+$|0657 | J2148|$+$|0657 |
| [C ii] cube | |||
| Beam size | |${0{^{\prime \prime}_{.}}48}$| |$\times$| |${0{^{\prime \prime}_{.}}39}$| | |${0{^{\prime \prime}_{.}}44}$| |$\times$| |${0{^{\prime \prime}_{.}}40}$| | |${0{^{\prime \prime}_{.}}45}$| |$\times$| |${0{^{\prime \prime}_{.}}38}$| |
| Position angle (east of north) | |$-59.^{\!\!\!\circ }6$| | |$-74.^{\!\!\!\circ }2$| | |$-83.^{\!\!\!\circ }2$| |
| rms noise per 100 km s|$^{-1}$| | 0.10 | 0.10 | 0.11 |
| (mJy beam|$^{-1}$|) | |||
| rms noise per 100 km s|$^{-1}$| | 0.15 | 0.15 | 0.17 |
| (mJy; |${1{^{\prime \prime}_{.}}0}$| aperture) | |||
| Continuum map | |||
| Observed continuum frequency (GHz) | 266.0 | 260.1 | 261.4 |
| Beam size | |${0{^{\prime \prime}_{.}}48}$| |$\times$| |${0{^{\prime \prime}_{.}}38}$| | |${0{^{\prime \prime}_{.}}45}$| |$\times$| |${0{^{\prime \prime}_{.}}41}$| | |${0{^{\prime \prime}_{.}}45}$| |$\times$| |${0{^{\prime \prime}_{.}}38}$| |
| Position angle (east of north) | |$-60.^{\!\!\!\circ }7$| | |$-81.^{\!\!\!\circ }1$| | |$-82.^{\!\!\!\circ }4$| |
| rms noise | 16.3 | 11.2 | 19.1 |
| (μJy beam|$^{-1}$|) | |||
| rms noise | 19.5 | 15.7 | 26.0 |
| (μJy; |${1{^{\prime \prime}_{.}}0}$| aperture) | |||
Rest-frame UV properties are quoted from Matsuoka et al. (2018c) and Onoue et al. (2019). The coordinates are updated after tying astrometric calibrations to the Gaia database.
The Mg ii redshifts are 6.148 (J1208|$-$|0200) and 6.246 (J2239|$+$|0207), respectively (Onoue et al. 2019). We did not obtain these Mg ii measurements in hand at the time of our ALMA observations.
The receivers were tuned to cover the redshifted [C ii] line emission, whose frequencies were estimated from the measured redshifts of Ly|$\alpha$|. For the J2228|$+$|0152 observations the total bandwidth was |${\sim } 7.5$| GHz, divided into four spectral windows of 1.875 GHz width. For the J1208|$-$|0200 and J2239|$+$|0207 observations we set three spectral windows (i.e., 1.875 |$\times$| 3 |$\sim$| 5.6 GHz width in total) in one sideband, given the large uncertainties of their Ly|$\alpha$| redshifts. The native spectral resolution was 7.813 MHz (8.7–8.9 km s|$^{-1}$|), but 11–12 channels were binned to improve the signal-to-noise ratio (|$S/N$|), resulting in a final common velocity resolution of |${\sim } 100$| km s|$^{-1}$|.
Reduction and calibration of the data were performed with the Common Astronomy Software Applications package (CASA; McMullin et al. 2007), version 5.1.1, in the standard manner. All images were reconstructed with the CASA task clean using the Briggs weighting (gain = 0.1, robust = 0.5). The achieved synthesized beams and rms sensitivities at a velocity resolution of |$\sim$|100 km s|$^{-1}$| are summarized in table 1. All channels free of line emission were averaged to generate a continuum map for each source (see also table 1), which was subtracted in the |$uv$| plane before making the line cube. Throughout the paper, only statistical errors are displayed unless otherwise mentioned. The systematic uncertainty of the absolute flux calibration at ALMA band 6 is 10%, according to the ALMA Cycle 5 Proposer’s Guide.
3 Results
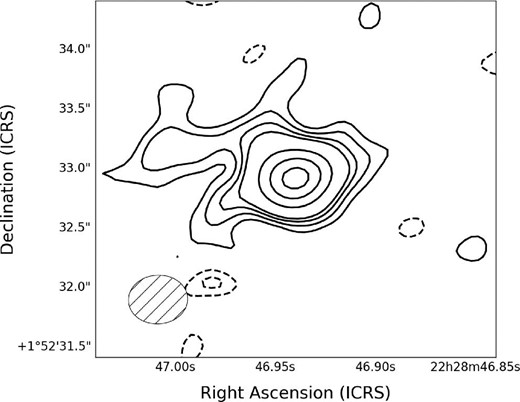
Figure 1 displays the spatial distribution of the velocity-integrated [C ii] line emission (zeroth moment) as well as the underlying rest-frame FIR continuum emission (|$\lambda _{\rm rest}$||$\simeq$| 158|$\, \mu$|m) of the three objects observed in Cycle 5. Those moment 0 maps were made with the CASA task immoments, integrating over the full velocity range containing the line emission.2 The [C ii] emission was detected in all sources, with no apparent spatial offset of their peak locations from the optical centroids given the astrometric uncertainties. However, FIR continuum emission was only significantly detected in J2239|$+$|0207 at the original angular resolution. Given that the [C ii] emission seems to be somewhat extended relative to the synthesized beams, we measured the FIR properties of these quasar host galaxies within a common |${1{^{\prime \prime}_{.}}0}$| aperture. With this treatment, FIR continuum emission was marginally detected in J1208|$-$|0200 as well. The rms sensitivities for these |${1{^{\prime \prime}_{.}}0}$| aperture measurements are listed in table 1. The relevant FIR properties of the targets are shown in table 2, which will be explained in detail in the following.
![Spatial distributions of the velocity-integrated [C ii] line (color scale in units of Jy km s$^{-1}$) and rest-frame FIR continuum (contours) emission of (a) J1208$-$0200, (b) J2228$+$0152, and (c) J2239$+$0207, respectively, shown at the original angular resolutions (see table 1). The plus and the square symbols denote the optical quasar locations (Matsuoka et al. 2018c) and [C ii] peak locations, respectively. Contours indicate: (a) $-$2 $\sigma$, 2 $\sigma$, 3 $\sigma$ (1 $\sigma$ = 16.3 μJy beam$^{-1}$), (b) $-$3 $\sigma$, $-$2 $\sigma$, 2 $\sigma$, 3 $\sigma$ (1 $\sigma$ = 11.2 μJy beam$^{-1}$), (c) $-$3 $\sigma$, $-$2 $\sigma$, 5 $\sigma$, 10 $\sigma$, $\ldots$ , 50 $\sigma$ (1 $\sigma$ = 19.1 μJy beam$^{-1}$). Negative values are indicated by dashed contours. The 1 $\sigma$ rms sensitivities of the [C ii] maps are (a) 0.028, (b) 0.034, and (c) 0.047 Jy beam$^{-1}$ km s$^{-1}$, respectively. Pixels below these 1 $\sigma$ levels are masked. The synthesized beam of the [C ii] cube is shown in the bottom-left corner of each panel. Attenuation due to the primary beam patterns is not corrected. (Color online)](https://oup.silverchair-cdn.com/oup/backfile/Content_public/Journal/pasj/71/6/10.1093_pasj_psz096/2/m_pasj_71_6_111_f1.jpeg?Expires=1749138137&Signature=QaaaktUxrHcOIG7d-zIdZEBMXBzkRXcM9BseU2yybJ1Wb3CDc6KHn0hzDSLEqZzdpMGX439rq0XO9uG48luJuOVnXQU8cSIl~hZtayDo1vPZIEUHq1~Nbp7RBSCzSWhryVCaDuczWoVzA8Iczij~vIzZy0EebS5xk0lAriK2q5ANTegtvL402YxlvYQb5f~AIsOClH60h-1eUx7azvqIjllUEFMUs3wDrnzh9so3bOOf-5fWlQRTW-NpRxdkmVYa-UQwHGL35Wsn-GhRha5LISmWRdnRe27TRZXIhrp~sInRjOCHSfp9NJElLkFT4ptRsmlOuUNjQmKD2uOLMK1JUA__&Key-Pair-Id=APKAIE5G5CRDK6RD3PGA)
Spatial distributions of the velocity-integrated [C ii] line (color scale in units of Jy km s|$^{-1}$|) and rest-frame FIR continuum (contours) emission of (a) J1208|$-$|0200, (b) J2228|$+$|0152, and (c) J2239|$+$|0207, respectively, shown at the original angular resolutions (see table 1). The plus and the square symbols denote the optical quasar locations (Matsuoka et al. 2018c) and [C ii] peak locations, respectively. Contours indicate: (a) |$-$|2 |$\sigma$|, 2 |$\sigma$|, 3 |$\sigma$| (1 |$\sigma$| = 16.3 μJy beam|$^{-1}$|), (b) |$-$|3 |$\sigma$|, |$-$|2 |$\sigma$|, 2 |$\sigma$|, 3 |$\sigma$| (1 |$\sigma$| = 11.2 μJy beam|$^{-1}$|), (c) |$-$|3 |$\sigma$|, |$-$|2 |$\sigma$|, 5 |$\sigma$|, 10 |$\sigma$|, |$\ldots$| , 50 |$\sigma$| (1 |$\sigma$| = 19.1 μJy beam|$^{-1}$|). Negative values are indicated by dashed contours. The 1 |$\sigma$| rms sensitivities of the [C ii] maps are (a) 0.028, (b) 0.034, and (c) 0.047 Jy beam|$^{-1}$| km s|$^{-1}$|, respectively. Pixels below these 1 |$\sigma$| levels are masked. The synthesized beam of the [C ii] cube is shown in the bottom-left corner of each panel. Attenuation due to the primary beam patterns is not corrected. (Color online)
Rest-frame FIR properties of the HSC quasars.|$^*$|
| J1208|$-$|0200 | J2228|$+$|0152 | J2239|$+$|0207 | |
|---|---|---|---|
| |$z_{\rm [C\, \small {II}]}$| | 6.1165 ± 0.0002 | 6.0805 ± 0.0004 | 6.2497 ± 0.0004 |
| FWHM |$_{\rm [C\, \small {II}]}$| (km s|$^{-1}$|) | 184 ± 28 | 266 ± 48 | 607 ± 44 |
| |$S_{\rm [C\, \small {II}]}$| (Jy km s|$^{-1}$|) | 0.280 ± 0.056 | 0.253 ± 0.059 | 0.955 ± 0.085 |
| |$L_{\rm {[C\, \small {II}]}}$| (10|$^8 \, L_\odot$|) | 2.71 ± 0.54 | 2.43 ± 0.57 | 9.53 ± 0.85 |
| |$f_{\rm 1.2mm}$| (μJy) | 85 ± 20 | |$\lt $|47 | 1110 ± 26 |
| EW |$_{\rm {[C\, \small {II}]}}$| (μm) | 1.73 ± 0.52 | |$\gt $|2.82 | 0.45 ± 0.04 |
| SFR |$_{\rm [C\, \small {II}]}$| (|$M_\odot$| yr|$^{-1}$|) | 18 ± 4 | 16 ± 5 | 63 ± 8 |
| Assumption: |$T_{\rm d}$| = 47 K, |$\beta$| = 1.6, |$\kappa _{\rm 250}$| = 0.4 cm|$^2$| g|$^{-1}$| | |||
| |$L_{\rm FIR}$| (10|$^{11} \, L_\odot$|) | 1.62 ± 0.37 | |$\lt $|0.94 | 21.74 ± 0.51 |
| |$L_{\rm TIR}$| (10|$^{11} \, L_\odot$|) | 2.29 ± 0.52 | |$\lt $|1.34 | 30.65 ± 0.72 |
| SFR |$_{\rm TIR}$| (|$M_\odot$| yr|$^{-1}$|) | 34 ± 8 | |$\lt $|20 | 453 ± 10 |
| |$M_{\rm dust}$| (|$10^7\, M_{\odot }$|) | 1.2 ± 0.3 | |$\lt $|0.7 | 15 ± 1 |
| |$L_{\rm [C\, \small {II}]}/L_{\rm FIR}$| (|$10^{-3}$|) | 1.67 ± 0.51 | |$\gt $|2.58 | 0.44 ± 0.04 |
|$^*$|These were measured with a common |${1{^{\prime \prime}_{.}}0}$| aperture. The FIR luminosities were estimated with a graybody spectrum model. The upper limits are the 3 |$\sigma$| values. |$\mathit {SFR}_{\rm [C\, \small {II}]}/M_{\odot }\:$|yr|$^{-1}$| = 1.0 |$\times$| 10|$^{-7}$| (|$L_{\rm [C\, \small {II}]}/L_\odot )^{0.98}$| (De Looze et al. 2011). |$\mathit {SFR}_{\rm TIR}/M_{\odot }\:{\rm yr^{-1}} = 1.49 \times 10^{-10} L_{\rm TIR}/L_\odot$| (Murphy et al. 2011).
3.1 [C ii] line properties
Figure 2 displays the [C ii] line spectra measured with the |${1{^{\prime \prime}_{.}}0}$| aperture. Given the modest |$S/N$| achieved, we simply fitted each spectrum with a single Gaussian profile, which delivered the velocity centroid (or redshift = |$z_{\rm [C\, {\small {II}}]}$|), line width (full width at half maximum = FWHM|$_{\rm [C\, \small {II}]}$|), and the velocity-integrated line flux (|$S_{\rm [C\, \small {II}]}$|) of the quasar host galaxy (table 2).
![[C ii] spectra (black solid line) of the three HSC quasars observed with ALMA, along with our best-fit single Gaussian profiles (blue dashed line). These were measured with the ${1{^{\prime \prime}_{.}}0}$ aperture placed either at the peak location of the FIR continuum emission (J2239$+$0207) or the rest-UV quasar position (J1208$-$0200 and J2228$+$0152; FIR continuum emission was not detected at the original resolutions in these objects). The redshifts determined from the rest-UV emission lines (Onoue et al. 2019) are indicated by the vertical dashed lines. Note that the measured Mg ii line of J1208$-$0200 is significantly redshifted with respect to this [C ii] line, which is out of the displayed range. The [C ii] emission of J2239$+$0207 spans two spectral windows. Thus there are overlapped channels at a velocity offset of ${\sim } 0$ km s$^{-1}$. (Color online)](https://oup.silverchair-cdn.com/oup/backfile/Content_public/Journal/pasj/71/6/10.1093_pasj_psz096/2/m_pasj_71_6_111_f6.jpeg?Expires=1749138137&Signature=iXUk19nCMgIHmZw2IDG9e4fn-8Dzg8c5uE4FhfRVe0lZrvmYodvxJdurmm8VaN0s01e-J02RlPkkPRRqRWIQUkQK3ok3MexPJqwseDDwIrkNHz8Du5Na0DPlF6yY~ji4gEYJ8oK~JH6V8COKqUkeeUuDUSfH-~17KocOy1Tw-ZqzOejROX6gfJx6sXgJey2dJcsUXGWNBoEFzUkquP9rSdHh-EObTt5AWawXIA8YUrEhdjwca0uy8IK8scYw2WFGSr1PcR5WqFCkb4hEKKI0XYWIPzYdaH39dOUqWvEbQq7YgveeaPqhpDOHFgcBvMBKxEK3p~gHZmHq9d2l2OgJiQ__&Key-Pair-Id=APKAIE5G5CRDK6RD3PGA)
[C ii] spectra (black solid line) of the three HSC quasars observed with ALMA, along with our best-fit single Gaussian profiles (blue dashed line). These were measured with the |${1{^{\prime \prime}_{.}}0}$| aperture placed either at the peak location of the FIR continuum emission (J2239|$+$|0207) or the rest-UV quasar position (J1208|$-$|0200 and J2228|$+$|0152; FIR continuum emission was not detected at the original resolutions in these objects). The redshifts determined from the rest-UV emission lines (Onoue et al. 2019) are indicated by the vertical dashed lines. Note that the measured Mg ii line of J1208|$-$|0200 is significantly redshifted with respect to this [C ii] line, which is out of the displayed range. The [C ii] emission of J2239|$+$|0207 spans two spectral windows. Thus there are overlapped channels at a velocity offset of |${\sim } 0$| km s|$^{-1}$|. (Color online)
The FWHM|$_{\rm [C\, \small {II}]}$| of these three HSC quasar host galaxies presented here, as well as those measured in our Cycle 4 work (Izumi et al. 2018b),3 are consistent with the distribution constructed from a large sample of |$z \gtrsim 6$| quasar host galaxies (Decarli et al. 2018), but J1208|$-$|0200 and J2239|$+$|0207 lie at the lower and higher extremes of the distribution, respectively (figure 3). Thus, there seems to be no clear correlation of FWHM|$_{\rm [C\, \small {II}]}$| and quasar luminosity: indeed, the Spearman rank correlation coefficient for the relation in figure 3 is only |$-$|0.21 with a null hypothesis probability of 0.16. The line profile of J2239|$+$|0207 is clearly flat at the peak, in the velocity range of |$-$|300 to |$+$|300 km s|$^{-1}$|, although we fitted the profile with a single Gaussian for simplicity. A flat line profile was also found in a |$z = 4.6$| quasar (Kimball et al. 2015) and a |$z = 6.13$| quasar (Shao et al. 2017). Such a profile suggests that the [C ii] line emission originates from a rotating disk. On the other hand, we cannot discuss the detailed dynamical nature (e.g., rotation-dominant or dispersion-dominant) of J1208|$-$|0200 and J2228|$+$|0152 as these are barely resolved.
![Gaussian FWHM of the [C ii] line as a function of the quasar absolute UV magnitude ($M_{\rm 1450}$). Compilations of $z \gt 5.7$ quasars from the literature (circle; Maiolino et al. 2005; Venemans et al. 2012, 2016, 2017c; Willott et al. 2013, 2015, 2017; Bañados et al. 2015; Mazzucchelli et al. 2017; Decarli et al. 2018) are plotted along with the HSC quasars (star) measured in Izumi et al. (2018b) and in this work. (Color online)](https://oup.silverchair-cdn.com/oup/backfile/Content_public/Journal/pasj/71/6/10.1093_pasj_psz096/2/m_pasj_71_6_111_f7.jpeg?Expires=1749138137&Signature=iaiefnXZ73SQAUBEYlMe8MM0UNs3Vlge6lyy3qi8y4MKYz9sjmLBkoBxAlXQ1CXkylV73S1NQy0kG-~-zaTnHW9eRrtCg9mq3DgB0nrYp01H5ohnzAN8N~Ig8lapzhaIg2u6Fx8qdgruc8bezyQ23fyO5h4MPxH0lyAOk0o4-sx22~k~MRttsZ42MZlM6qqablbxE18utpMbwutJ7zuejkrMIdbU8txM5cxlHIcCuWx2geU0TScam1pfmu-NvOjwO8WvpF~D1JCnER9UcRo7f3hvZhFIxCqHmK0XtNuIH8RiaWAIDsnbqdm~T-8S6-W7YUDDUSAoFj2Lxv1kPA-Rww__&Key-Pair-Id=APKAIE5G5CRDK6RD3PGA)
Gaussian FWHM of the [C ii] line as a function of the quasar absolute UV magnitude (|$M_{\rm 1450}$|). Compilations of |$z \gt 5.7$| quasars from the literature (circle; Maiolino et al. 2005; Venemans et al. 2012, 2016, 2017c; Willott et al. 2013, 2015, 2017; Bañados et al. 2015; Mazzucchelli et al. 2017; Decarli et al. 2018) are plotted along with the HSC quasars (star) measured in Izumi et al. (2018b) and in this work. (Color online)
The velocity centroid (|$z_{\rm [C\, \small {II}]}$|) of J2228|$+$|0152 agrees well with |$z_{\rm Ly\alpha }$| (table 1), but |$z_{\rm [C\, \small {II}]}$| is offset significantly blueward from |$z_{\rm Ly\alpha }$| for J1208|$-$|0200 and J2239|$+$|0207. These offsets could simply be the consequence of the considerable uncertainties in |$z_{\rm Ly\alpha }$| due to severe intergalactic absorption (|$\Delta z \sim 1000$| km s|$^{-1}$|; e.g., Eilers et al. 2017). Among the ionized lines predominantly emerging from the broad line region of quasars, C iv|$\lambda$|1549 is usually found to be blueshifted with respect to the host galaxies (Shen et al. 2016; Mazzucchelli et al. 2017). In the case of our seven HSC quasars with [C ii] measurements, the measured blueshifts of C iv are |${\sim } 400\mbox{--}600$| km s|$^{-1}$| with respect to |$z_{\rm [C\, \small {II}]}$| (Onoue et al. 2019). The blueshifted nature of C iv indicates the existence of outflowing gas close to the central SMBHs.
Regarding Mg ii|$\lambda$|2798, however, we do not see significant blueshifts (|$\gtrsim\!\! 500$| km s|$^{-1}$|) in these HSC quasars (Onoue et al. 2019),4 while some other quasars show such blueshifts (e.g., Venemans et al. 2016; Wang et al. 2016; Decarli et al. 2018), as shown in the compilation of the velocity shift (|$\Delta v = v_{\rm Mg\, \small {II}} - v_{\rm [C\, \small {II}]}$|, figure 4). The mean and standard deviation of the distribution is |$-284 \pm 607$| km s|$^{-1}$|. Although nuclear outflows can be a possible origin of such shifts, only a marginal and no clear correlations are found for |$\Delta v$|, between quasar nuclear luminosity or Eddington ratio,5 with the corresponding Spearman rank coefficient of 0.35 (p-value = 0.05) and 0.04 (p-value = 0.82), respectively, for the samples shown in figure 4. Hence the cause of the Mg ii blueshifts remains unclear. It is nevertheless advisable to use the Mg ii line with caution as an indicator of the systemic redshift, given the wide distribution of |$\Delta v$|. This is particularly an issue for ALMA observations, as the width of its single baseband is only |${\sim } 2250$| km s|$^{-1}$| at 250 GHz.
![Histogram of the velocity offset between Mg ii-based redshift and [C ii]-based redshift ($\Delta v = v_{\rm Mg\, \small {II}} - v_{\rm [C\, \small {II}]}$) for $z \gt 5.7$ quasars compiled from the literature (Maiolino et al. 2005; Venemans et al. 2012, 2016, 2017c; Wang et al. 2013, 2016; Willott et al. 2013, 2015, 2017; Bañados et al. 2015; Mazzucchelli et al. 2017; Decarli et al. 2018), along with our HSC quasars. The Mg ii line is predominantly blueshifted in these $z \gtrsim 6$ quasars with a mean and standard deviation of $-284 \pm 607$ km s$^{-1}$. (Color online)](https://oup.silverchair-cdn.com/oup/backfile/Content_public/Journal/pasj/71/6/10.1093_pasj_psz096/2/m_pasj_71_6_111_f8.jpeg?Expires=1749138137&Signature=ArjkL-GJEfmT6UpynRHRaGtDAvExVXoo3lfyyiIV55sTV9nK~PTlqEBwFNuY-7JaN2CfQRNbjR8ckBNJ5wiCgXlyHXn0X4BWwA5FNfpobQTKcSaeoPMAdUBZpgXckRzwsH5lf41ypND9j0mo2Tbd4-y53tJVEkWnTHo2MFFtS0rFFKiDmzUgFh1RtgkhpNUkNiBMrB~TOFyz68qQ4frm-EK6qy7kKwcQt-vwKDnNbIpefpO-bkZXOUg6~wTeVMZmOwBfSTvnaqdonrq8zu2Y2ysdefu6C3W9raPMyop4f8vV0B84jTUQR078gTBgEa6Ujo9JB5QV2smUQl6o-kUMwg__&Key-Pair-Id=APKAIE5G5CRDK6RD3PGA)
Histogram of the velocity offset between Mg ii-based redshift and [C ii]-based redshift (|$\Delta v = v_{\rm Mg\, \small {II}} - v_{\rm [C\, \small {II}]}$|) for |$z \gt 5.7$| quasars compiled from the literature (Maiolino et al. 2005; Venemans et al. 2012, 2016, 2017c; Wang et al. 2013, 2016; Willott et al. 2013, 2015, 2017; Bañados et al. 2015; Mazzucchelli et al. 2017; Decarli et al. 2018), along with our HSC quasars. The Mg ii line is predominantly blueshifted in these |$z \gtrsim 6$| quasars with a mean and standard deviation of |$-284 \pm 607$| km s|$^{-1}$|. (Color online)
![Relationship of the quasar UV luminosity ($\lambda L_{\rm 1450}$) and [C ii] line luminosity ($L_{\rm [C\, \small {II}]}$) shown with a logarithmic scale. Literature data of $z \gtrsim 6$ quasars are compiled (circle; Maiolino et al. 2005; Venemans et al. 2012, 2016, 2017c; Wang et al. 2013, 2016; Willott et al. 2013, 2015, 2017; Bañados et al. 2015; Mazzucchelli et al. 2017; Decarli et al. 2018). Also plotted are the HSC quasars (star). The dotted line (red) and the shaded region indicate our best-fit linear regression line and its 1 $\sigma$ scatter, respectively. (Color online)](https://oup.silverchair-cdn.com/oup/backfile/Content_public/Journal/pasj/71/6/10.1093_pasj_psz096/2/m_pasj_71_6_111_f9.jpeg?Expires=1749138137&Signature=VxMXgTVKMljtgZbg110NOC1n9Sj7hu5Y~vQQNhp4vPV6wWtq~CAEAzBnkx9hH8kJf3J4d-rmUE6-KceljFH3f1rsnS-KskocLSOPCmBpO8P4dKPXsmiOvkjEkuDKX-QnqWW5iu-HR3C5WBqNui8tOK3Qjm9auizPeVLXzpDyGmFPabeLKXsOeZBa6WLD30zgd4xRl27AN1mJsslFFSpR2YvFbzhyI2ryfyGkQgdcR3z-9r~1~~mbG8IrwCKqGyRZydyuAgLQFcSq71lFXPE9qosv0P8PR~NH2j6~p2jDuRiF5qWpFV3NMpXgyWto2yeqTDMZESscLQ47qexaY~757w__&Key-Pair-Id=APKAIE5G5CRDK6RD3PGA)
Relationship of the quasar UV luminosity (|$\lambda L_{\rm 1450}$|) and [C ii] line luminosity (|$L_{\rm [C\, \small {II}]}$|) shown with a logarithmic scale. Literature data of |$z \gtrsim 6$| quasars are compiled (circle; Maiolino et al. 2005; Venemans et al. 2012, 2016, 2017c; Wang et al. 2013, 2016; Willott et al. 2013, 2015, 2017; Bañados et al. 2015; Mazzucchelli et al. 2017; Decarli et al. 2018). Also plotted are the HSC quasars (star). The dotted line (red) and the shaded region indicate our best-fit linear regression line and its 1 |$\sigma$| scatter, respectively. (Color online)
The star formation rate (SFR) of these quasars can then be estimated by attributing the [C ii] emission heating solely to young stars: |$\mathit {SFR}_{\rm [C\, \small {II}]}/M_{\odot }\:{\rm yr^{-1}} = 1.0 \times 10^{-7} (L_{\rm [C\, \small {II}]}/L_\odot )^{0.98}$| (De Looze et al. 2011). This relation has an intrinsic scatter of 0.3 dex and is based on the Kroupa initial mass function (IMF; Kroupa 2001). The derived values range from 16 to |$63\, M_{\odot }\:$|yr|$^{-1}$| (table 2), well within the SFR range of local LIRG-class systems (e.g., Díaz-Santos et al. 2013; Sargsyan et al. 2014). Note that the De Looze et al. (2011) relation was derived for objects with |$L_{\rm FIR} \lesssim 10^{12}\, L_{\odot }$|, and thus it may not be appropriate to apply this for J2239|$+$|0207 (|$L_{\rm FIR} \simeq 2 \times 10^{12}\, L_{\odot }$|).
We used the CASA task imfit to fit a two-dimensional Gaussian profile to the [C ii] integrated intensity (zeroth moment) maps, and estimated their beam-deconvolved spatial extents. The maps made with the original resolutions (figure 1) were used for this purpose. This image-plane fitting method has been widely used in previous submm studies of |$z \gtrsim 6$| quasar host galaxies (e.g., Willott et al. 2015; Venemans et al. 2016), which enables a direct comparison with these earlier studies. The estimated values are listed in table 3: their FWHM sizes are |${\sim } 2.1$|–4.0 kpc (major axis). Although the associated uncertainties are admittedly large, these sizes are comparable to those found in our previous work on the other four HSC quasars, as well as to many optically luminous quasars (Izumi et al. 2018b).
Spatial extent of the star-forming region.|$^*$|
| Name | Size ([C ii]FWHM) | Size (FIR continuum FWHM) |
|---|---|---|
| J1208|$-$|0200 | (|${0{^{\prime \prime}_{.}}63}$||$\pm$||${0{^{\prime \prime}_{.}}06}$|) |$\times$| (|${0{^{\prime \prime}_{.}}35}$||$\pm$||${0{^{\prime \prime}_{.}}07}$|) | — |
| (3.6 |$\pm$| 0.3) kpc |$\times$| (1.9 |$\pm$| 0.4) kpc | ||
| J2228|$+$|0152 | (|${0{^{\prime \prime}_{.}}38}$||$\pm$||${0{^{\prime \prime}_{.}}05}$|) |$\times$| (|${0{^{\prime \prime}_{.}}18}$||$\pm$||${0{^{\prime \prime}_{.}}07}$|) | — |
| (2.1 |$\pm$| 0.3) kpc |$\times$| (1.0 |$\pm$| 0.4) kpc | ||
| J2239|$+$|0207 | (|${0{^{\prime \prime}_{.}}72}$||$\pm$||${0{^{\prime \prime}_{.}}02}$|) |$\times$| (|${0{^{\prime \prime}_{.}}46}$||$\pm$||${0{^{\prime \prime}_{.}}02}$|) | (|${0{^{\prime \prime}_{.}}22}$||$\pm$||${0{^{\prime \prime}_{.}}03}$|) |$\times$| (|${0{^{\prime \prime}_{.}}11}$||$\pm$||${0{^{\prime \prime}_{.}}05}$|) |
| (4.0 |$\pm$| 0.1) kpc |$\times$| (2.6 |$\pm$| 0.1) kpc | (1.2 |$\pm$| 0.2) kpc |$\times$| (0.7 |$\pm$| 0.5) kpc |
|$^*$|The original resolution data was used for the measurements.
3.2 FIR continuum properties
The observed 1.2 mm continuum flux densities (|$f_{\rm 1.2\, mm}$|) are used to determine their FIR luminosities (|$L_{\rm FIR}$|) integrated over the rest-frame wavelengths of |$\lambda _{\rm rest} = 42.5\mbox{--}122.5\, \mu$|m (Helou et al. 1988). Here, we assume a graybody spectrum with dust temperature of |$T_{\rm d} = 47$| K and emissivity index6 of |$\beta = 1.6$| based on the mean spectral energy distribution of high-redshift optically and FIR luminous quasars (Beelen et al. 2006; Leipski et al. 2014), to be consistent with previous work (e.g., Wang et al. 2013; Willott et al. 2013; Venemans et al. 2016). However, these values are likely to vary significantly from source to source (Venemans et al. 2018; Liang et al. 2019). If our HSC quasars instead have |$T_{\rm d}$| close to the value found for nearby LIRG-class systems (|${\sim } 35$| K, U et al. 2012), the resultant inferred |$L_{\rm FIR}$| values would be about three times lower. We hereafter only consider the uncertainties of flux measurements, not that of the |$T_{\rm d}$|, which should be constrained further with future multi-wavelength observations. Note that the influence of the cosmic microwave background (CMB) radiation on the submm observations at high redshifts (da Cunha et al. 2013) is not considered, as that effect is negligible as long as we adopt |$T_{\rm d} = 47$| K.
The |$f_{\rm 1.2\, mm}$| and |$L_{\rm FIR}$| measured with the common |${1{^{\prime \prime}_{.}}0}$| aperture are listed in table 2. J1208|$-$|0200 was marginally detected (|${\sim } 4 \, \sigma$|) with |$L_{\rm FIR} = (1.6 \pm 0.4) \times 10^{11}\, L_{\odot }$|, which is slightly smaller than those of the four Cycle 4 HSC quasars [|$L_{\rm FIR} \sim (3\mbox{--}5) \times 10^{11}\, L_{\odot }$|, Izumi et al. 2018b. J2228|$+$|0152 is undetected, with a |$3 \, \sigma$| upper limit of |$f_{\rm 1.2\, mm} \lt 47\, \mu$|Jy and |$L_{\rm FIR} \lt 9 \times 10^{10}\, L_{\odot }$| (i.e., below the luminosity range of a LIRG), making it one of the lowest |$L_{\rm FIR}$| quasar host galaxies ever studied at |$z \gtrsim 6$|. The |$L_{\rm FIR}$| values of these HSC quasars are thus smaller by factors of |${\sim } 10$|–100 than most of the |$z \gtrsim 6$| optically luminous quasars studied thus far (e.g., Wang et al. 2007, 2008). On the other hand, for J2239|$+$|0207 we found |$L_{\rm FIR} \simeq 2 \times 10^{12}\, L_{\odot }$|, showing that there is a broad distribution in |$L_{\rm FIR}$| even among HSC quasars of comparable UV/optical luminosities. The relationship between quasar luminosity and |$L_{\rm FIR}$| is further discussed in sub-subsection 4.2.2.
We measured the size of the FIR continuum-emitting region of J2239|$+$|0207 with the imfit task, finding a significantly smaller size than that of the [C ii]-emitting region (table 3; see also figure 1). The [C ii]-emitting region is often larger than the continuum-emitting region in high-z quasars (e.g., Wang et al. 2013; Venemans et al. 2016), although the cause for this remains unclear.
The total infrared luminosity (|$L_{\rm TIR}$|) integrated over the 8–1000|$\, \mu$|m range is supposed to be powered by star formation, and thus gives an independent estimate of SFR. We use the conversion |$\mathit {SFR}_{\rm TIR}/M_\odot \, {\rm yr}^{-1} = 1.49 \times 10^{-10} \, L_{\rm TIR}/L_\odot$| (Murphy et al. 2011), which is based on the Kroupa IMF (Kroupa 2001). The SFRs based on this method are also listed in table 2. We also derived dust mass |$M_{\rm dust}$| from |$L_{\rm FIR}$| with |$M_{\rm dust} = L_{\rm FIR}/(4\pi \int \kappa _\nu B_\nu d\nu )$|, where |$\kappa _\nu$| is the mass absorption coefficient, taken to be |$\kappa _\nu = \kappa _0 (\nu /250 \, {\rm GHz})^\beta$| with |$\kappa _0 = 0.4$| cm|$^2$| g|$^{-1}$| (Alton et al. 2004), and |$B_\nu$| is the Planck function. The derived values span a wide range from |$\lt 7 \times 10^6\, M_{\odot }$| to |$1.5 \times 10^8\, M_{\odot }$| (table 2).
3.3 Further details of J2228|$+$|0152 and J2239|$+$|0207: interactions and companions?
The [C ii] emission of J2228|$+$|0152 seems to be extended to the east, although the statistical significance of the extended component is only modest (|${\sim } 3\mbox{--}3.5 \, \sigma$|). However, there is also weak (|${\sim } 2\mbox{--}3 \, \sigma$|) FIR continuum emission around the eastern extension, which motivates us to further investigate its structure. To this end, we constructed [C ii] velocity channel maps of J2228|$+$|0152 using the MIRIAD software (Sault et al. 1995). We found that there is one [C ii] emitter candidate at the location of the eastern extension (figure 6), which is detected at |$5.5 \, \sigma$|. If this is a [C ii] emitter, it is located at |$z_{\rm [C\, \small {II}]} = 6.068$| with |$S_{\rm [C\, \small {II}]} = 0.055$| Jy km s|$^{-1}$| or |$L_{\rm [C\, \small {II}]} = 5.3 \times 10^7\, L_{\odot }$|. The velocity offset and the projected separation on the sky of this emitter candidate, measured from the central quasar, are |${\sim } -\!\!540$| km s|$^{-1}$| and |${\sim } 7$| kpc, respectively. Thus, the eastern extension may be related to the interaction of J2228|$+$|0152 and this companion emitter. Although we need higher-sensitivity observations to further study the nature of this emitter as it was only detected in one channel, companion galaxies and extended (or interacting) morphologies have been identified in [C ii] emission around some quasars at |$z \gtrsim 6$| (Decarli et al. 2017).
![Companion [C ii] emitter candidate found in the J2228$+$0152 field. These velocity channel maps were generated from the original resolution [C ii] cube (angular resolution = ${0{^{\prime \prime}_{.}}44}$$\times$${0{^{\prime \prime}_{.}}40}$; bottom-left ellipses). The candidate emitter is indicated by the arrow, which is ${\sim } 7$ kpc away from the central quasar (star). The contour steps are $-$3, $-$2, 2, 3, 4, 5 $\sigma$ (1 $\sigma$ = 0.10 mJy beam$^{-1}$ at a velocity resolution of ${\sim } 100$ km s$^{-1}$). The numbers in the top-left corner indicate the velocities relative to the quasar systemic velocity. (Color online)](https://oup.silverchair-cdn.com/oup/backfile/Content_public/Journal/pasj/71/6/10.1093_pasj_psz096/2/m_pasj_71_6_111_f10.jpeg?Expires=1749138137&Signature=fJLAgHlM2076dyCi2nXG~AWtC97klzuVYfNwezikdpIKY~LzDGxThKKq2XsCKh84pzNvyjdekKX7C0HyfbzXrvCW-jJtB6q8p-Q6RfBJhYLFG~HK3IKOzaqPNoHLdtOlE5IPmsKuFrM7OOpB6ofEtWNXxeEBbpQ-MGCpBzO7SslIEaVHDPQcmMTcGRw6c6D2n0JVxWjBrvjMMIzM2usXs8e-Ed3Z4mlL1~VIgZyBO7vVb1vBtO9jX3gFGZ3HQF7tcKk3BX0jh1m51tNHjAsmEENl6JPBe0MsnoSsRnkNsHfnt61ghAecfgC9x5UCcbfLw5c9U5IMQ6qw1FnsI-aUuQ__&Key-Pair-Id=APKAIE5G5CRDK6RD3PGA)
Companion [C ii] emitter candidate found in the J2228|$+$|0152 field. These velocity channel maps were generated from the original resolution [C ii] cube (angular resolution = |${0{^{\prime \prime}_{.}}44}$||$\times$||${0{^{\prime \prime}_{.}}40}$|; bottom-left ellipses). The candidate emitter is indicated by the arrow, which is |${\sim } 7$| kpc away from the central quasar (star). The contour steps are |$-$|3, |$-$|2, 2, 3, 4, 5 |$\sigma$| (1 |$\sigma$| = 0.10 mJy beam|$^{-1}$| at a velocity resolution of |${\sim } 100$| km s|$^{-1}$|). The numbers in the top-left corner indicate the velocities relative to the quasar systemic velocity. (Color online)
Another interesting object is J2239|$+$|0207, as it shows the highest |$L_{\rm FIR}$| of the seven HSC quasars thus far studied with ALMA. One possible origin of the high FIR luminosity is a merger of two or more galaxies, as is often observed in nearby ULIRGs (e.g., Sanders & Mirabel 1996). Thus, we searched for features indicative of galaxy mergers or interactions in [C ii] velocity channel maps of J2239|$+$|0207 (figure 7). As we remarked in section 2, the [C ii] line spans two spectral windows, allowing us to test the robustness of the features we see. Note, however, that the velocity spacings of these two datasets are not perfectly matched.
![Velocity channel maps of J2239$+$0207 generated from the original resolution [C ii] cube (i.e., angular resolution = ${0{^{\prime \prime}_{.}}45}$$\times$${0{^{\prime \prime}_{.}}38}$; bottom-left ellipses). The contour steps are $-$3, $-$2, 2, 3, 5, 7 $\sigma$ (1 $\sigma$ = 0.11 mJy beam$^{-1}$ at a velocity resolution of ${\sim } 100$ km s$^{-1}$). The top and bottom sets of panels show the data from different spectral windows, which partially overlap. The FIR continuum peak position is marked by the star symbol. The location of a candidate companion [C ii] emitter is indicated by the arrows. The number in the top-left corner of each panel indicates the velocity relative to the quasar systemic velocity. (Color online)](https://oup.silverchair-cdn.com/oup/backfile/Content_public/Journal/pasj/71/6/10.1093_pasj_psz096/2/m_pasj_71_6_111_f11.jpeg?Expires=1749138137&Signature=QIQELl5gs20jXJ~vi9lpqkuS6DKxqQapVvevd9OishTEAUoQEH3eepz1B0aeNu7OQpPrxEGNCD8yRG-SxvDikAjNvpusnPvEtFAuCvsWNNQhRf-gZU-qqzxWYmQbGv1qSoRSgs8xJNhvdQKyywo4Mug3dSDZzBVb6k139XuRUcDz9DwAO4UVZ81a9le9dAo91K~81KVUs3LBkpKVrgZITeZnBVaIbwcJW32E76-unoQBFE7u5xY0p-n7yR3QRpWsivFuCmg5hP5~mldu3q3AoJB93eTcdI8Sb0SQawOjhbs5A16-pShK4lAH99uFIfk5AzW3W94lSDpforcUf-F6AA__&Key-Pair-Id=APKAIE5G5CRDK6RD3PGA)
Velocity channel maps of J2239|$+$|0207 generated from the original resolution [C ii] cube (i.e., angular resolution = |${0{^{\prime \prime}_{.}}45}$||$\times$||${0{^{\prime \prime}_{.}}38}$|; bottom-left ellipses). The contour steps are |$-$|3, |$-$|2, 2, 3, 5, 7 |$\sigma$| (1 |$\sigma$| = 0.11 mJy beam|$^{-1}$| at a velocity resolution of |${\sim } 100$| km s|$^{-1}$|). The top and bottom sets of panels show the data from different spectral windows, which partially overlap. The FIR continuum peak position is marked by the star symbol. The location of a candidate companion [C ii] emitter is indicated by the arrows. The number in the top-left corner of each panel indicates the velocity relative to the quasar systemic velocity. (Color online)
The [C ii] emission of J2239|$+$|0207 is slightly extended relative to the synthesized beam and shows filamentary structures in some channels. Although these components are of low statistical significance (|$\lesssim\!\! 3\mbox{--}5 \, \sigma$|) and do not seem to be well matched in the two windows, we found a [C ii] emission candidate at exactly the same location in the two datasets, at similar velocities (|$+87$| km s|$^{-1}$| in one spectral window and |$+66$| km s|$^{-1}$| in the other). If this is indeed a [C ii] emitter, an interaction with J2239|$+$|0207 (projected separation |${\sim } 1^{\prime \prime } \sim 5.6$| kpc) may have triggered the observed starburst activity. Meanwhile, if it is real, this [C ii] emitter (|$z_{\rm [C\, \small {II}]} = 6.248$|) has |$S_{\rm [C\, \small {II}]} \sim 0.063$| Jy km s|$^{-1}$| or |$L_{\rm [C\, \small {II}]} \sim 6.2 \times 10^7\, L_{\odot }$| (corresponding to |$\mathit {SFR}_{\rm [C\, \small {II}]} \sim 4\, M_{\odot }$| yr|$^{-1}$|), which are rather modest values. Given the compact size and narrow velocity width, the dynamical mass of this emitter should be small. Thus, a possible future merger of this emitter and J2239|$+$|0207 would be rather minor. J2239|$+$|0207 itself must thus have a copious amount of cold material to support the observed starburst activity. However, our limited sensitivity (the significance of the emission is |${\sim } 5 \, \sigma$| and |${\sim } 3 \, \sigma$| in each window, respectively; FIR continuum emission is below 3 |$\sigma$| at this position) means that we cannot call this a robust detection. Again, we need much deeper observations to reveal its nature.
3.4 Continuum emitters
We also searched for companion continuum emitters in these three HSC quasar fields. Here, we conservatively define an emitter as one that shows |$\ge\!\! 5 \, \sigma$| significance. In the FoV of J1208|$-$|0200 (|$5 \, \sigma = 82\, \mu$|Jy beam|$^{-1}$|) and J2239|$+$|0207 (|$5 \, \sigma = 96\, \mu$|Jy beam|$^{-1}$|), no such emitter was found. In contrast, one emitter was found slightly outside the nominal FoV of J2228|$+$|0152 (|$5 \, \sigma = 56\, \mu$|Jy beam|$^{-1}$|), located |${13{^{\prime \prime}_{.}}7}$| away from the quasar position (figure 8). This emitter is bright with a peak flux density of 0.25 mJy beam|$^{-1}$|, and is clearly more extended than the synthesized beam. The deconvolved size by simply fitting a two-dimensional Gaussian with the imfit task is (|${0{^{\prime \prime}_{.}}417}$||$\pm$||${0{^{\prime \prime}_{.}}078}$|) |$\times$| (|${0{^{\prime \prime}_{.}}306}$||$\pm$||${0{^{\prime \prime}_{.}}080}$|). We found that this object is also detected in the HSC optical bands as |$g = 25.12 \pm 0.21$| mag, |$r = 24.57 \pm 0.18$| mag, |$i = 25.04 \pm 0.37$| mag, |$z = 23.91 \pm 0.25$| mag, and |$y = 24.32 \pm 0.82$|, respectively. The HSC photometric redshift catalog (Tanaka et al. 2018) from the first data release (Aihara et al. 2018b), along with the Bayesian-based Mizuki code (Tanaka 2015), suggests that the redshift of this source is |$z_{\rm photo} = 2.26 \pm 0.56$|. If we rely on this |$z_{\rm photo}$|, the above source size is equivalent to |${\sim } 3.4$| kpc |$\times$| 2.5 kpc. Such faint (e.g., a few 100 μJy at |${\sim } 1$| mm) continuum sources have been uncovered by recent unbiased surveys of, e.g., HUDF/GOODS-S using ALMA (e.g., Aravena et al. 2016; Dunlop et al. 2017; Hatsukade et al. 2018; Franco et al. 2018).
Continuum emitter found in the J2228|$+$|0152 field (|${13{^{\prime \prime}_{.}}7}$| away from the phase reference position). The contours are |$-$|3 |$\sigma$|, |$-$|2 |$\sigma$|, 2 |$\sigma$|, 3 |$\sigma$|, 4 |$\sigma$|, 5 |$\sigma$|, 10 |$\sigma$|, 15 |$\sigma$|, and 20 |$\sigma$|, with 1 |$\sigma$| = 11.2 μJy beam|$^{-1}$|. The emission is spatially resolved with a peak flux of 0.25 mJy beam|$^{-1}$|, and the area-integrated flux is |$0.38 \pm 0.05$| mJy, respectively. The photometric redshift predicted for this object is |$z_{\rm photo} = 2.26 \pm 0.56$|
Combining with Cycle 4 data (Izumi et al. 2018b), we have observed seven HSC quasars in total with ALMA band 6, and this object is the only one identified as a continuum emitter in the field, except for the target quasars. This detection rate (one continuum emitter in |$7 \times 0.135$| arcmin|$^2$| fields) seems to be smaller than recent measurements of the 1.2 mm number counts in the field (e.g., Aravena et al. 2016; Fujimoto et al. 2016). Indeed, the best-fit cumulative number count in Fujimoto et al. (2016)7 predicts that we should have detected |$\sim$|11–16 continuum sources (when corrected for errors) over our seven fields, or |$\sim$|1–3 in each 0.135 arcmin|$^2$| field, given the depth of each one. This may be an overestimate for our fields because our high-resolution observations are less sensitive to extended emission (see the discussion in Fujimoto et al. 2017). We may also be subject to strong cosmic variance. Even so, our results will not support that these HSC quasars reside in overdense regions of submm sources. In this context, Champagne et al. (2018) reported no submm overdensity around a sample of 35 |$z \gt 6$| optically luminous quasars (total effective area = 4.3 arcmin|$^2$|), although their observations were considerably shallower than ours. It is noteworthy, however, that some studies at |$z \lesssim 5$| suggest that luminous quasars tend to reside in overdense regions of emitters (Silva et al. 2015; Trakhtenbrot et al. 2017). Further observations are required to reconcile this discrepancy.
4 Discussion
4.1 The [C ii]–FIR luminosity relation
We discuss the [C ii] to FIR luminosity ratio of our quasars and various comparison samples here. The ratio quantifies the contribution of [C ii] line emission to the cooling of the cold ISM (the Milky Way value of |$L_{\rm [C\, \small {II}]}/L_{\rm FIR}$| is |$3 \times 10^{-3}$|; Carilli & Walter 2013), but it has long been known that the |$L_{\rm [C\, \small {II}]}/L_{\rm FIR}$| ratio is an order of magnitude smaller in ULIRG-like FIR-luminous systems (e.g., Malhotra et al. 1997; Brauher et al. 2008; Stacey et al. 2010; Graciá-Carpio et al. 2011; Farrah et al. 2013; Díaz-Santos et al. 2013, 2017). This [C ii] deficit trend has also been found in high-redshift quasars (e.g., Wang et al. 2013; Venemans et al. 2016; Decarli et al. 2018). Several processes may contribute to the deficit in quasars, including an AGN contribution to |$L_{\rm FIR}$| (Sargsyan et al. 2014), reduction of C|$^+$| abundance due to AGN irradiation (Langer & Pineda 2015), high gas surface densities of individual clouds (giving a high molecular-to-atomic gas fraction; Narayanan & Krumholz 2017), etc., but an overwhelming factor appears to be the presence of a high FIR luminosity density region and/or high-temperature dust-emitting region, as has been invoked for local ULIRGs (e.g., Malhotra et al. 1997; Díaz-Santos et al. 2013, 2017; see also the discussion in the last part of this subsection).
![[C ii] to FIR luminosity ratio as a function of FIR luminosity for our HSC quasars (cyan stars; both the Cycle 4 and 5 samples are included): this is an updated version from the figure presented in Izumi et al. (2018b). Compilations of various kinds of galaxies from the literature are also plotted: local LIRGs (Díaz-Santos et al. 2013), local ULIRGs (Farrah et al. 2013), $z \gt 2$ FIR- or UV-luminous galaxies (Maiolino et al. 2009; Ivison et al. 2010; De Breuck et al. 2011; Wagg et al. 2012; Riechers et al. 2013; Gullberg et al. 2015; Capak et al. 2015), and $z \gtrsim 6$ quasars (Maiolino et al. 2005; Venemans et al. 2012, 2016, 2017a, 2017c, 2018; Wang et al. 2013, 2016; Willott et al. 2013, 2015, 2017; Bañados et al. 2015; Shao et al. 2017; Decarli et al. 2017, 2018; Mazzucchelli et al. 2017). For all quasar samples, we assumed a graybody spectrum with $T_d = 47$ K and $\beta = 1.6$ to calculate $L_{\rm FIR}$, in order to maintain consistency. The horizontal dashed line indicates the Milky Way value ($\sim 3 \times 10^{-3}$; Carilli & Walter 2013). Where necessary, TIR luminosity was converted to FIR luminosity using $L_{\rm TIR} \simeq 1.3 L_{\rm FIR}$ (Carilli & Walter 2013). The diagonal dotted line indicates our best fit to the quasar data, excluding objects with upper and/or lower limits. (Color online)](https://oup.silverchair-cdn.com/oup/backfile/Content_public/Journal/pasj/71/6/10.1093_pasj_psz096/2/m_pasj_71_6_111_f13.jpeg?Expires=1749138137&Signature=NDTI5Uqil9XKD55kWWDfV9hVLnbmoi9HC-lkW8~sd8A17q0Jt~caD6Qz7d1geFZ0mNZYgoZMUp7k4bfkASE2jqp9v0DbdBjcXU6ZWPTIw2COy76J1zn384gVx1ZopD3pzL~rViZvigX77USwwQ1DnN2K-qSpXZ54GAMpcabYuO~kVIKvJ7iuNi6sk2QsmX1nzHRpgErCrzeClNyo1ak~0M0cEwmZAIMw40NaeG72xGgIahvPHpfhLg9ob4RyoUBg2c~ZrxOi9r7lAMK-cpnY~uDQHfvFsUMMoTBk9M3EToCujI3H7J0RBNHXwJfTG90LCqIoeS72FiUoAj7Zn5qozA__&Key-Pair-Id=APKAIE5G5CRDK6RD3PGA)
[C ii] to FIR luminosity ratio as a function of FIR luminosity for our HSC quasars (cyan stars; both the Cycle 4 and 5 samples are included): this is an updated version from the figure presented in Izumi et al. (2018b). Compilations of various kinds of galaxies from the literature are also plotted: local LIRGs (Díaz-Santos et al. 2013), local ULIRGs (Farrah et al. 2013), |$z \gt 2$| FIR- or UV-luminous galaxies (Maiolino et al. 2009; Ivison et al. 2010; De Breuck et al. 2011; Wagg et al. 2012; Riechers et al. 2013; Gullberg et al. 2015; Capak et al. 2015), and |$z \gtrsim 6$| quasars (Maiolino et al. 2005; Venemans et al. 2012, 2016, 2017a, 2017c, 2018; Wang et al. 2013, 2016; Willott et al. 2013, 2015, 2017; Bañados et al. 2015; Shao et al. 2017; Decarli et al. 2017, 2018; Mazzucchelli et al. 2017). For all quasar samples, we assumed a graybody spectrum with |$T_d = 47$| K and |$\beta = 1.6$| to calculate |$L_{\rm FIR}$|, in order to maintain consistency. The horizontal dashed line indicates the Milky Way value (|$\sim 3 \times 10^{-3}$|; Carilli & Walter 2013). Where necessary, TIR luminosity was converted to FIR luminosity using |$L_{\rm TIR} \simeq 1.3 L_{\rm FIR}$| (Carilli & Walter 2013). The diagonal dotted line indicates our best fit to the quasar data, excluding objects with upper and/or lower limits. (Color online)
![Rest-frame [C ii] line equivalent width (EW$_{\rm [C\, \small {II}]}$) as a function of the quasar absolute UV magnitude ($M_{\rm 1450}$), using the same quasar samples as shown in figure 9. The mean EW for local starburst galaxies is indicated by the horizontal dashed line (Díaz-Santos et al. 2013). Our best power-law fit (excluding objects with lower limits) is shown by the diagonal dotted line. (Color online)](https://oup.silverchair-cdn.com/oup/backfile/Content_public/Journal/pasj/71/6/10.1093_pasj_psz096/2/m_pasj_71_6_111_f2.jpeg?Expires=1749138137&Signature=qPZpPTOO1IZyz9OwqUh1DL1MHX2ZEtxmPniauL-H9fwcVPCG8HKpV8pUOazl4h7KY2s8yGumoTf968JvJflleeg0V7aFzPxIMjQ-VyBdc~Sd5xGeog1L6-uUEn1lq-UxEkrhUdr4c7POw2MiI2ubAvIDbONePI3CsyiIKpnAza9PfYhRKpaZiFr-DMDaPMFLFl945NHx4jA5qq6HqETtMmQbk6UeO4RP5-eioJ2j8WO6iGYk4fhE5-30GNUu8Lg08iZBs3QzMHb3L53alPZVo-K2H3pZrsIiBgfrzIjXHHkMtWHCVhaN4eS54DApafLepEV7-C~Z~7XJ7Zbol8qx2w__&Key-Pair-Id=APKAIE5G5CRDK6RD3PGA)
Rest-frame [C ii] line equivalent width (EW|$_{\rm [C\, \small {II}]}$|) as a function of the quasar absolute UV magnitude (|$M_{\rm 1450}$|), using the same quasar samples as shown in figure 9. The mean EW for local starburst galaxies is indicated by the horizontal dashed line (Díaz-Santos et al. 2013). Our best power-law fit (excluding objects with lower limits) is shown by the diagonal dotted line. (Color online)
![[C ii] to FIR luminosity ratio as a function of FIR luminosity density ($\Sigma _{\rm FIR} = L_{\rm FIR}/2\pi R^2_{\rm FIR}$, $R_{\rm FIR} = \mathit {FWHM}_{\rm maj}/2$) on a logarithmic scale, for the HSC quasars and quasars at $z \gt 6$ compiled from Decarli et al. (2018) and Venemans et al. (2018). We assumed the graybody spectrum with $T_d = 47$ K and $\beta = 1.6$ for all quasars to compute $L_{\rm FIR}$. The quasars are color coded by their $M_{\rm 1450}$ values. Only objects with reliable measurements of $R_{\rm FIR}$ are included. The horizontal dashed line denotes the Milky Way value (Carilli & Walter 2013) for an eye guide. Our best power-law fit (excluding objects with lower limits on $\Sigma _{\rm FIR}$) is indicated by the blue dotted line. (Color online)](https://oup.silverchair-cdn.com/oup/backfile/Content_public/Journal/pasj/71/6/10.1093_pasj_psz096/2/m_pasj_71_6_111_f3.jpeg?Expires=1749138137&Signature=0t1iKTINPuYt~cS7d7anbWSTr-wDWIn9YNPd6LbwltkeKzh22TT4fehewosMM0gi4yVmiLvcjaw1vpu8gOnkWnEssTMqkKdg8q9EFCgBT84zQgjmiI93s6Bf-ZA6KBbs5~v7tErYlnRQPa42G81g5jC4sl7E~m7bHijvYG2AtKs5JS1JrQ4l7RVEOgrb5df9CRJzoQkP4mYkUB9Ikq9EyuZ2ElpAPHcQewn8K8mxAmyI9COm~oIC9ASIXnTMqXNbLSBke~utLkZ0tTEnsG1ldFvYfXPrZSgtgkS3-crBDTO78KzaZY3OiZ99cHMpRPzEuVkxLyr0d7P5Nr29amj76A__&Key-Pair-Id=APKAIE5G5CRDK6RD3PGA)
[C ii] to FIR luminosity ratio as a function of FIR luminosity density (|$\Sigma _{\rm FIR} = L_{\rm FIR}/2\pi R^2_{\rm FIR}$|, |$R_{\rm FIR} = \mathit {FWHM}_{\rm maj}/2$|) on a logarithmic scale, for the HSC quasars and quasars at |$z \gt 6$| compiled from Decarli et al. (2018) and Venemans et al. (2018). We assumed the graybody spectrum with |$T_d = 47$| K and |$\beta = 1.6$| for all quasars to compute |$L_{\rm FIR}$|. The quasars are color coded by their |$M_{\rm 1450}$| values. Only objects with reliable measurements of |$R_{\rm FIR}$| are included. The horizontal dashed line denotes the Milky Way value (Carilli & Walter 2013) for an eye guide. Our best power-law fit (excluding objects with lower limits on |$\Sigma _{\rm FIR}$|) is indicated by the blue dotted line. (Color online)
There are three intimately linked physical processes which may drive the [C ii] deficit in high-|$\Sigma _{\rm FIR}$| regions. The first process is driven by the increased radiation field, under which dust particles have more positive charge. This results in a reduction of the number of free electrons released from the dust particles, which contribute to [C ii] excitation (e.g., Malhotra et al. 1997; Negishi et al. 2001). Second, an increased ionized-to-atomic hydrogen ratio will reduce the fraction of UV photons absorbed by gas, which then leads to the reduction of the |$L_{\rm [C\, \small {II}]}/L_{\rm FIR}$| ratio (Abel et al. 2009). Third, the temperature of the dust (|$T_{\rm d}$|) itself matters. Dust grains are heated to higher |$T_{\rm d}$| in higher-|$\Sigma _{\rm FIR}$| regions, in which a larger number of ionizing photons is available, as seen in local ULIRGs. This greatly enhances |$L_{\rm FIR}$| and thus reduces |$L_{\rm [C\, \small {II}]}/L_{\rm FIR}$| (e.g., Díaz-Santos et al. 2013, 2017). To further test this possibility, however, shorter-wavelength continuum observations are necessary to constrain |$T_{\rm d}$| directly, as we have assumed |$T_{\rm d} = 47$| K (Beelen et al. 2006) for all quasars in figure 11 for consistency.
4.2 Early SMBH–host galaxy co-evolution
We now investigate the early co-evolution of SMBHs and their host galaxies, in both integrated and differential forms. The relevant properties of the seven HSC quasars with ALMA data are compared with those of previously observed |$z \gtrsim 6$| quasars, to give a less biased view on early mass assembly. We recall that the HSC quasars constitute the break (|$M^\star _{\rm 1450} = -24.9$| mag) or further lower-luminosity regime of the quasar luminosity function at |$z \sim 6$| (Matsuoka et al. 2018a), which then represent the bulk of the quasar population at that era. Subsequent NIR follow-up observations started to reveal that they possess a wide range of |$M_{\rm BH}$| (|${\sim } 10^{7.5}\mbox{--}10^{9}\, M_{\odot }$|, Onoue et al. 2019), which are therefore characterized by a wide range of Eddington ratio (|$\sim$|0.1–1). Among the six HSC quasars reported by Onoue et al. (2019), four objects indeed have Eddington ratios of |$0.16\mbox{--}0.24$|. Note that dust obscuration does not play a major role in shaping the low-luminosity nature of most of the HSC quasars, as judged from the rest-UV SED modeling (Onoue et al. 2019).
4.2.1 Integrated form: |$M_{\rm BH}\mbox{--}M_{\rm dyn}$|
We first computed |$M_{\rm BH}$| of J1208|$-$|0200 and J2239|$+$|0207 (table 4) using the broad Mg ii-based virial mass calibration (the so-called single epoch method; Vestergaard & Osmer 2009). Details of the procedure are described in Onoue et al. (2019). J2228|$+$|0152 has no Mg ii spectroscopy, so we assumed Eddington-limited accretion to derive its |$M_{\rm BH}$|. Note that this assumption is often made in |$z \gtrsim 6$| quasar studies (e.g., Wang et al. 2013; Decarli et al. 2018) to compute the lower limit of |$M_{\rm BH}$|. The bolometric luminosity was calculated from the 1450 Å monochromatic luminosity with a correction factor of 4.4 (Richards et al. 2006). The estimated |$M_{\rm BH}$| of the three HSC quasars presented here fall in the range |$(1.1\mbox{--}11) \times 10^8\, M_{\odot }$|. Along with our Cycle 4 measurements, these HSC quasars populate the middle to lower regime of the |$z \gtrsim 6$| quasar mass distribution observed thus far (Onoue et al. 2019). Hence, we are indeed probing a quasar population less biased in terms of |$M_{\rm BH}$| by observing these low-luminosity quasars.
Dynamical properties of the HSC quasars observed in ALMA Cycle 5.|$^*$|
| Name | |$M_{\rm dyn} \sin ^2i$| (10|$^{10}\, M_\odot$|) | |$M_{\rm dyn}$| (10|$^{10}\, M_\odot$|) | |$M_{\rm BH}$| (10|$^8 \, M_\odot$|) |
|---|---|---|---|
| J1208|$-$|0200 | 1.2 |$\pm$| 0.3 | 1.3 | 7.1|$^{+2.4}_{-5.2}$| |
| J2228|$+$|0152 | 1.5 |$\pm$| 0.4 | 2.0 | |$\gt $|1.1 |
| J2239|$+$|0207 | 6.4 |$\pm$| 1.3 | 29 | 11|$^{+3}_{-2}$| |
|$^*$|Formal errors on |$M_{\rm dyn}$| are not given due to multiple unconstrained uncertainties including those of the inclination angles and the geometry of the line-emitting regions. |$M_{\rm BH}$| for J1208|$-$|0200 and J2239|$+$|0207 are measured with the Mg ii emission line, as reported in Onoue et al. (2019). Meanwhile, Eddington-limited mass accretion is assumed for J2228|$+$|0152, giving a lower limit on its |$M_{\rm BH}$|. Following previous works, we assume a typical systematic uncertainty for the Mg ii-based |$M_{\rm BH}$| of 0.5 dex.
We also compiled |$M_{\rm BH}$| and |$M_{\rm 1450}$| values of other |$z \ge 5.7$| quasars from the literature (Willott et al. 2010b; De Rosa et al. 2014; Kashikawa et al. 2015; Venemans et al. 2015a; Bañados et al. 2016; Jiang et al. 2016; Shao et al. 2017; Mazzucchelli et al. 2017; Decarli et al. 2018). Most of these |$M_{\rm BH}$| values were indeed measured with the same Mg ii-based single epoch method that we have used (Vestergaard & Osmer 2009). Exceptions are J1319|$+$|0950 (Shao et al. 2017), as well as J0842|$+$|1218, J1207|$+$|0630, and J2310|$+$|1855 (Shen et al. 2019), for which we recalculated |$M_{\rm BH}$| with the Vestergaard and Osmer (2009) calibration. For those without available |$M_{\rm BH}$| data, we assumed the Eddington-limited accretion. Although this assumption may not be valid for our HSC quasar J2228|$+$|0152, as it shows a rather quiescent nature (non-detection of FIR continuum emission), we nevertheless keep this assumption as we would like to take a statistical approach. The |$M_{\rm dyn}$| of these quasars from the literature were also computed in the same way we adopted for our HSC quasars, i.e., the thin disk approximation with a two-dimensional Gaussian decomposition (Wang et al. 2013; Willott et al. 2013, 2015, 2017; Venemans et al. 2016; Shao et al. 2017; Decarli et al. 2018). Quasars that do not have such a Gaussian decomposition were excluded from our sample. One exception is the second highest redshift quasar known, J1120|$+$|0641 (|$z = 7.08$|; Mortlock et al. 2011). Previous high-resolution [C ii] observations revealed that its host galaxy does not show ordered rotation, and an upper limit on |$M_{\rm dyn}$| was provided by applying the virial theorem (Venemans et al. 2017a).
In figure 12 we display the relation between |$M_{\rm BH}$| and |$M_{\rm dyn}$| for the 40 abovementioned quasars at |$z \gtrsim 6$|, overlaid with the local |$M_{\rm BH}\mbox{--}M_{\rm bulge}$| relation after equating |$M_{\rm dyn}$| to |$M_{\rm bulge}$| (Kormendy & Ho 2013). These quasars are color coded by their |$M_{\rm 1450}$|. Regarding the optically luminous objects, this figure supports conclusions in previous works (e.g., Wang et al. 2013; Venemans et al. 2016). That is, the luminous quasars (|$M_{\rm 1450} \lesssim -25$| mag) typically have overmassive SMBHs with respect to the local relation, while the discrepancy becomes less evident at |$M_{\rm dyn} \gtrsim 10^{11}\, M_{\odot }$|; some luminous quasars even show comparable |$M_{\rm BH}/M_{\rm dyn}$| ratios to the local relation. It is likely for such high-mass host galaxies that past multiple major and minor mergers already led to this convergence.
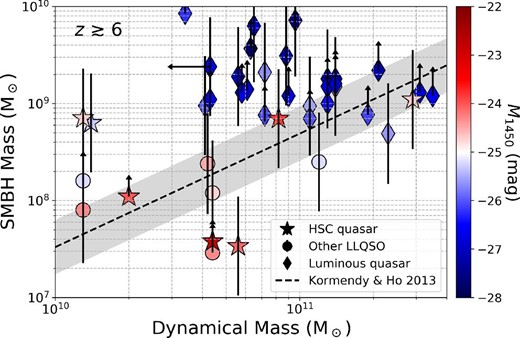
Black hole mass (|$M_{\rm BH}$|) vs. host galaxy dynamical mass (|$M_{\rm dyn}$|) relationship for |$z \gtrsim 6$| quasars, color coded by their absolute UV magnitude (|$M_{\rm 1450}$|). The diagonal dashed line and the shaded region indicate the local |$M_{\rm BH}$|–|$M_{\rm bulge}$| relationship and its 1 |$\sigma$| scatter, respectively (Kormendy & Ho 2013): we equate |$M_{\rm dyn}$| and |$M_{\rm bulge}$| in this plot. From this figure, it is clear that optically luminous quasars (|$M_{\rm 1450} \lesssim -25$| mag) typically show overmassive |$M_{\rm BH}$| with respect to the local relation. On the other hand, a large fraction of the low-luminosity (|$M_{\rm 1450} \gtrsim -25$| mag) quasars, including most of the HSC quasars, lie close to, or even below, that relation. See the main text for the samples of objects shown. (Color online)
On the other hand, most of the low-luminosity quasars with |$M_{\rm 1450} \gtrsim -25$| mag show comparable ratios to, or even lower ratios than, the local relation, particularly at a range of |$M_{\rm dyn} \gtrsim 4 \times 10^{10}\, M_{\odot }$|. The existence of the undermassive SMBHs even implies an evolutionary path, in which galaxies grow earlier than SMBHs, such as expected in a standard merger-induced evolution model (e.g., Hopkins et al. 2008). In this high-|$M_{\rm dyn}$| range, our result demonstrates that previous works on luminous quasars have been largely biased toward the most massive SMBHs (Lauer et al. 2007; Schulze & Wisotzki 2014), easily resulting in objects lying above the local |$M_{\rm BH}\mbox{--}M_{\rm dyn}$| relation. Therefore, our result highlights the power of the sensitive Subaru survey to probe the fainter part of the quasar luminosity and mass functions and to reveal the nature of the early co-evolution of black holes and their host galaxies in a less biased way.
However, we also found that the low-luminosity quasars at |$M_{\rm dyn} \lesssim 3 \times 10^{10}\, M_{\odot }$| start to show overmassive |$M_{\rm BH}$| with respect to the local relation. Regarding the HSC quasars, we argue that this is still due to our selection bias: we basically selected objects with |$M_{\rm 1450} \lt -24$| for the targets in our NIR follow-up observations (Onoue et al. 2019), which corresponds to |$M_{\rm BH} \sim 10^8\, M_{\odot }$| if it is accreting at the Eddington limit. Meanwhile, the |$M_{\rm BH}$| expected at |$M_{\rm dyn} \sim (1\mbox{--}3) \times 10^{10}\, M_{\odot }$| from the local relation is much smaller than |$10^8\, M_{\odot }$|. Thus, given the large scatter of the Eddington ratio distribution at |$z \sim 6$| (|$\sim 0.01\mbox{--}1$|; Onoue et al. 2019), we clearly need to observe much fainter objects to probe the |$M_{\rm BH} \lt 10^8\, M_{\odot }$| region and to reveal the unbiased shape of the relation. Future sensitive observations with the James Webb Space Telescope (JWST) or ground-based extremely large telescopes will allow probing of this very low mass region even at |$z \gt 6$|.
Given their low nuclear luminosities (hence mass accretion rate onto SMBHs) and SFRs, the low-luminosity quasars studied here will not move drastically in the |$M_{\rm BH}\mbox{--}M_{\rm dyn}$| plane even over the next |${\sim } 10$| Myr (typical lifetime of high-redshift quasars expected with the transverse proximity effect; Borisova et al. 2016), unless there is a rich supply of gas which infalls to the galaxy. This is particularly true if the quasar duty cycle is |$\lesssim\!\! 10^{-2}$|, as suggested for |$z \sim 6$| objects recently (Chen & Gnedin 2018). Note that Izumi et al. (2018b) argued that the four HSC quasar hosts studied in ALMA Cycle 4 are on or even below the star formation main sequence at |$z \sim 6$| (e.g., Salmon et al. 2015). This trend also holds for the Cycle 5 samples. Therefore, these low-luminosity quasars may already be near the end of their SMBH growth and galaxy growth, and are transforming into a quiescent phase even at |$z \gtrsim 6$|. This is consistent with the conclusion of Onoue et al. (2019), who raised a similar argument based on the Eddington ratio measurements for HSC quasars. If this is true, there must be a quite rapid physical process to realize the |$M_{\rm BH}\mbox{--}M_{\rm dyn}$| relation at that high redshift, such as expected in a merger-induced evolution (e.g., Di Matteo et al. 2005; Hopkins et al. 2006, 2008). Indeed, a recent very high resolution simulation based on this scheme suggests that even a quasar at |$z = 7$| follows the local co-evolution relation (Lupi et al. 2019).
4.2.2 Differential form: |$L_{\rm Bol}\mbox{--}L_{\rm FIR}$|
The |$M_{\rm BH}\mbox{--}M_{\rm dyn}$| relationship studied in sub-subsection 4.2.1 reflects the integrated history of past mass accumulation. We now investigate the ongoing mass accumulation of |$z \gtrsim 6$| quasars by comparing quasar bolometric luminosity (|$L_{\rm Bol}$|) and |$L_{\rm FIR}$|. As |$L_{\rm Bol}$| and |$L_{\rm FIR}$| can be converted to the growth rate of the central SMBH (|$\equiv \dot{M}_{\rm BH}$|) and the SFR of the host galaxy (see subsection 3.2), respectively, the |$L_{\rm Bol}\mbox{--}L_{\rm FIR}$| relation indicates a differential form of the Maggorian relation (e.g., Willott et al. 2013; Drouart et al. 2014).
We again compiled literature data for |$M_{\rm 1450}$| (Willott et al. 2003, 2010b; De Rosa et al. 2014; Kashikawa et al. 2015; Wu et al. 2015; Jiang et al. 2016; Bañados et al. 2016, 2018; Mazzucchelli et al. 2017; Shao et al. 2017; Decarli et al. 2018; Venemans et al. 2018) and |$L_{\rm FIR}$| (Bertoldi et al. 2003b; Petric et al. 2003; Maiolino et al. 2005; Wang et al. 2007, 2008, 2011a, 2013, 2016; Omont et al. 2013; Willott et al. 2013, 2015, 2017; Bañados et al. 2015; Venemans et al. 2016, 2017a, 2017c, 2018; Shao et al. 2017; Mazzucchelli et al. 2017; Decarli et al. 2017, 2018) of |$z \gtrsim 6$| quasars. In addition to the objects we compiled in sub-subsection 4.2.1, we appended a number of quasars, mostly with single-dish |$L_{\rm FIR}$| measurements. Thus, the total number of quasars in this analysis is increased to 97, including the seven HSC quasars. Their |$L_{\rm Bol}$| and |$L_{\rm FIR}$| values were computed in the same manner as described earlier.
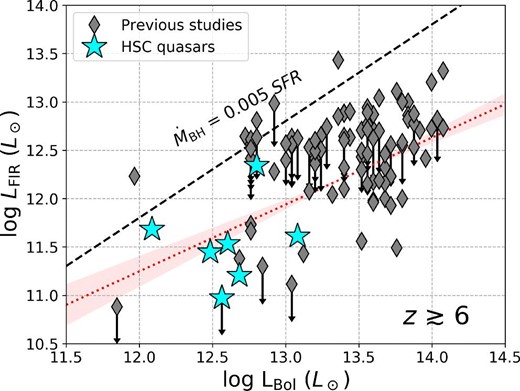
|$L_{\rm Bol}\mbox{--}L_{\rm FIR}$| relationship for 97 |$z \gtrsim 6$| quasars, including the HSC quasars, on a logarithmic scale. The dotted line (red) and the shaded region indicate the best-fit linear regression for the whole sample (including objects with upper limits on |$L_{\rm FIR}$|) and its 1 |$\sigma$| scatter, respectively. The dashed line (black) refers to the so-called parallel growth model, in which SMBHs and galaxies grow simultaneously by following the local |$M_{\rm BH}\mbox{--}M_{\rm bulge}$| relation (Kormendy & Ho 2013). We define the quasar-dominant phase as the region below this parallel growth line, whereas the starburst-dominant phase is above the line. (Color online)
In figure 13, we can define a line of parallel growth (e.g., Willott et al. 2013; Drouart et al. 2014). This indicates an evolutionary path in which SMBHs grow in tandem with their host galaxies to give rise to the local |$M_{\rm BH}\mbox{--}M_{\rm bulge}$| relation. Here, we adopt the local relation of Kormendy and Ho (2013), i.e., |$M_{\rm BH} \simeq 0.005 \times M_{\rm bulge}$|. The parallel growth line is thus equivalent to |$\dot{M}_{\rm BH} = 0.005 \times \mathit {SFR}$| (figure 13). The line moves upward in the figure if we adopt the McConnell and Ma (2013) relation instead (|$M_{\rm BH} \simeq 0.003 \times M_{\rm bulge}$|). |$L_{\rm Bol}$| and |$\dot{M}_{\rm BH}$| are equated as |$\dot{M}_{\rm BH} = [(1-\eta )/\eta ] (L_{\rm Bol}/c^2)$|, where |$\eta$| is the radiative efficiency (|${\sim } 0.1$|; Volonteri & Rees 2005; Zhang & Lu 2019) and c is the speed of light. It is evident that most of the |$z \gtrsim 6$| quasars discussed here, including the low-luminosity objects, are on or below the parallel growth line (quasar-dominant phase) in this differential Magorrian plot.
This result supports the evolutionary scenario that sequentially links vigorous starburst and SMBH growth (e.g., Sanders et al. 1988; Hopkins et al. 2006, 2008; Alexander et al. 2008; Alexander & Hickox 2012; Simpson et al. 2012). In this scenario, the peak of the quasar luminosity comes after the peak of the dust-obscured starburst phase, in which AGN feedback would expel the surrounding dusty ISM and quenches the starburst. As we saw, the low-luminosity quasars, including the HSC quasars, particularly hosted in massive galaxies (|$M_{\rm dyn} \gtrsim 4 \times 10^{10}\, M_{\odot }$|), are located on or below the local Magorrian relation (figure 12). Given the low |$M_{\rm dust}$| of these low-luminosity quasars (mostly of the order of 10|$^7 \, M_\odot$|), the expected gas mass fraction in |$M_{\rm dyn}$| after multiplying by a gas-to-dust mass ratio (e.g., 100; Draine et al. 2007) is small, indicating that stellar masses dominate their |$M_{\rm dyn}$|. Meanwhile, the ongoing star formation in their hosts is also weak; they are entering a quiescent phase (Izumi et al. 2018b). Note that this view is sensitive to the assumed |$T_{\rm d}$| to compute |$L_{\rm FIR}$| from the single ALMA photometry. We recall, however, that now we assume the same high |$T_{\rm d}$| for the HSC quasars as the one canonically adopted for the optically and FIR much brighter quasars (= 47 K). It may be more plausible for the HSC quasars to have lower |$T_{\rm d}$| such as 35 K (see also subsection 3.2). If this is true, the HSC quasars will reside in a further quasar-dominant region on figure 13. Future multi-band ALMA observations will enable better constraints for the |$T_{\rm d}$| of these HSC quasars, as has been performed for some luminous quasars (e.g., Wang et al. 2019). In summary, we suggest that these HSC quasars would have experienced an earlier vigorous starburst phase to generate their host galaxy masses, prior to the currently observed quasar-dominant phase, in order for them to reach the local Magorrian relation.
Prime candidates for such starbursting predecessors are SMGs at even higher redshifts. So far, only three SMGs have been spectroscopically identified at |$z \gt 6$|: SPT0311|$-$|58 at |$z = 6.90$| (Marrone et al. 2018), HFLS3 at |$z = 6.34$| (Riechers et al. 2013), and HATLAS G09 83808 at |$z = 6.03$| (Zavala et al. 2018). These are known to host extreme starbursts with SFR|$\sim 3000 \, M_\odot$| yr|$^{-1}$| (for the former two) and |${\sim } 380 \, M_\odot$| yr|$^{-1}$| (for G09 83808, after correcting for gravitational magnification), which has allowed their host galaxies to grow as massive as |${\sim } 10^{11}\, M_{\odot }$| within a fairly short time. This picture is consistent with recent simulation work of merger-induced galaxy evolution (Ginolfi et al. 2019), which suggested that |$z \sim 7$| hyper-luminous infrared galaxies (HyLIRGs) are indeed the ancestors of |$z \sim 6$| luminous quasars.
While it is quite difficult to determine if there is an AGN in these gas-rich and dusty systems at |$z \gt 6$| using current instruments, studies in the nearby universe have shown that IR-luminous or gas-rich systems tend to possess AGNs with a high Eddington ratio (e.g., Hao et al. 2005; Xia et al. 2012; Izumi 2018a). Such a high Eddington ratio (or even super-Eddington) phase may be essential for cosmic SMBH growth (e.g., Kawaguchi et al. 2004; Di Matteo et al. 2008). Furthermore, recent ALMA observations, supplemented by deep Chandra 7 Ms survey data, have revealed a high fraction of AGNs in moderate-luminosity SMGs (i.e., 90|$^{+8}_{-19}$|% of ULIRG-class objects and 57|$^{+23}_{-25}$|% of LIRG-class objects are AGNs) at |$z \sim 1$|–3 (Ueda et al. 2018). About two-thirds of their sample (25 SMGs in total) are in the starburst-dominant phase in terms of the differential Magorrian relation (see also Wang et al. 2013), which is qualitatively consistent with some earlier works (e.g., Alexander et al. 2005, 2008). Our results, along with these previous findings, support the idea that SMBHs and their host galaxies do not actually co-evolve in a synchronized way. Rather, there seems to be an evolutionary path from the starburst-dominant phase to the quasar-dominant phase.
5 Summary
As a part of the SHELLQs project, a large optical survey of low-luminosity quasars (|$M_{\rm 1450} \gtrsim -25$| mag) at |$z \gtrsim 6$| with the Subaru Hyper Suprime-Cam (HSC), we performed Cycle 5 ALMA follow-up observations toward three HSC quasars, in addition to our previous Cycle 4 study of four quasars. We thus continue to grow the sample of hosts of low-luminosity, high-redshift quasars from the pioneering works of Willott et al. (2013, 2015, 2017). The main findings of this paper strengthen our previous arguments in Izumi et al. (2018b), and are summarized as follows.
We detected [C ii] line emission in all three target HSC quasars, with [C ii] luminosities in the range |$(2.4\mbox{--}9.5) \times 10^8\, L_{\odot }$|. These are consistent with the Cycle 4 measurements for other HSC quasars, but are one order of magnitude smaller than those measured in optically luminous quasars. The [C ii] line width shows no clear dependence on the quasar luminosity.
Within a common |${1{^{\prime \prime}_{.}}0}$| aperture, we detected underlying FIR continuum emission from two of the three target quasars. It is intriguing that one HSC quasar shows a ULIRG-like FIR luminosity (|$L_{\rm FIR} \simeq 2 \times 10^{12}\, L_{\odot }$|), while another object was not detected even with our sensitive ALMA observations (3 |$\sigma$| limit of |$L_{\rm FIR} \lt 9 \times 10^{10}\, L_{\odot }$|). There is a wide spread in |$L_{\rm FIR}$| among the HSC quasars, even though their quasar luminosities in rest-UV are comparable. These |$L_{\rm FIR}$| values are again an order of magnitude smaller than those typically found in optically luminous quasars.
The spatial extents of the (barely resolved) [C ii]-emitting regions of these HSC quasars are |${\sim } 2\mbox{--}4$| kpc, roughly consistent with previous measurements of both optically luminous and low-luminosity quasars. Thus the difference in |$L_{\rm FIR}$| between optically luminous quasars and our HSC quasars roughly translates to the difference in FIR luminosity density.
The |$L_{\rm [C\, \small {II}]}/L_{\rm FIR}$| ratios of the HSC quasars (except for the ULIRG-class object J2239|$+$|0207) are consistent with local star-forming galaxies. However, the ratio is an order of magnitude smaller in some optically and FIR-luminous quasars from the literature. We suggest that the high FIR luminosity density of the observed region and/or existence of a high-temperature dust-emitting region may be the physical origin of this [C ii] deficit.
From the dynamical measurements based on the thin rotating disk assumption, along with the |$M_{\rm BH}$| data, we found that most of the HSC quasars and similarly low-luminosity |$z \gtrsim 6$| CFHQS quasars (|$M_{\rm 1450} \gtrsim -25$| mag) tend to lie on or even below the local |$M_{\rm BH}\mbox{--}M_{\rm bulge}$| relation, particularly at the high |$M_{\rm dyn}$| range (|$\gtrsim\!\! 4 \times 10^{10}\, M_{\odot }$|). This would require a quite rapid mechanism of co-evolution, such as merger-induced galaxy evolution, to grow both the hosts and black holes, given the high redshifts (|$z \gtrsim 6$|) of our sample quasars. Optically luminous quasars (|$M_{\rm 1450} \lesssim -25$| mag), on the other hand, host overmassive SMBHs with respect to the local relation, while the discrepancy becomes less evident at the massive end of |$M_{\rm dyn} \gtrsim 10^{11}\, M_{\odot }$|. However, we also mentioned our current limitation to fully probe the low-|$M_{\rm BH}$| range (|$\lt\!\! 10^8\, M_{\odot }$|), which will be the subject of future sensitive NIR observations.
All the |$z \gtrsim 6$| quasars compiled in this work are located in the quasar-dominant region of the |$L_{\rm Bol}\mbox{--}L_{\rm FIR}$| plane. As low-luminosity quasars seem to be consistent with the local |$M_{\rm BH}\mbox{--}M_{\rm bulge}$| relation at least at the high galaxy-mass range, and are transforming into a quiescent population in terms of both SMBH growth and stellar mass accumulation, there should have been a starburst-dominant phase for them to gain their large host dynamical masses (|${\sim } 10^{10-11}\, M_{\odot }$|), prior to the currently observed quasar phase. Submillimeter galaxies (SMGs) at even higher redshifts (|$z \gtrsim 7$|) would be the prime candidate for such a starbursting ancestor.
In this work, we demonstrated the importance of investigating low-luminosity quasars to probe the nature of early co-evolution of black holes and host galaxies in an unbiased way. The trends of low-luminosity quasars shown above are indeed clearly different from those of optically luminous quasars, although our conclusions are based on a small sample. As the number of low-luminosity HSC quasars at |$z \gt 6$| is growing dramatically, we can statistically confirm the trends we found thus far with sensitive ALMA surveys.
Acknowledgments
We deeply appreciate the anonymous referee for his/her thorough reading and useful comments which greatly improved this paper. We also appreciate Toshihiro Kawaguchi for his intensive advice on this work. This paper makes use of the following ALMA data: ADS/JAO.ALMA 2017.1.00541.S. ALMA is a partnership of ESO (representing its member states), NSF (USA) and NINS (Japan), together with NRC (Canada), MOST and ASIAA (Taiwan), and KASI (Republic of Korea), in cooperation with the Republic of Chile. The Joint ALMA Observatory is operated by ESO, AUI/NRAO, and NAOJ.
The Hyper Suprime-Cam (HSC) collaboration includes the astronomical communities of Japan and Taiwan, and Princeton University. The HSC instrumentation and software were developed by the National Astronomical Observatory of Japan (NAOJ), the Kavli Institute for the Physics and Mathematics of the Universe (Kavli IPMU), the University of Tokyo, the High Energy Accelerator Research Organization (KEK), the Academia Sinica Institute for Astronomy and Astrophysics in Taiwan (ASIAA), and Princeton University. Funding was contributed by the FIRST program from the Japanese Cabinet Office, the Ministry of Education, Culture, Sports, Science and Technology (MEXT), the Japan Society for the Promotion of Science (JSPS), the Japan Science and Technology Agency (JST), the Toray Science Foundation, NAOJ, Kavli IPMU, KEK, ASIAA, and Princeton University.
This paper makes use of software developed for the Large Synoptic Survey Telescope. We thank the LSST Project for making their code available as free software at |$\langle$|http://dm.lsstcorp.org|$\rangle$|.
The Pan-STARRS1 Surveys (PS1) have been made possible through contributions of the Institute for Astronomy, the University of Hawaii, the Pan-STARRS Project Office, the Max-Planck Society and its participating institutes, the Max Planck Institute for Astronomy, Heidelberg and the Max Planck Institute for Extraterrestrial Physics, Garching, The Johns Hopkins University, Durham University, the University of Edinburgh, Queen’s University Belfast, the Harvard-Smithsonian Center for Astrophysics, the Las Cumbres Observatory Global Telescope Network Incorporated, the National Central University of Taiwan, the Space Telescope Science Institute, the National Aeronautics and Space Administration under Grant No. NNX08AR22G issued through the Planetary Science Division of the NASA Science Mission Directorate, the National Science Foundation under Grant No. AST-1238877, the University of Maryland, and Eotvos Lorand University (ELTE).
T.I., M.I., Y.M., N.K., T.N., K.K., and Y.T. are supported by Japan Society for the Promotion of Science (JSPS) KAKENHI grant numbers JP17K14247, JP15K05030, JP17H04830, JP15H03645, JP17H01114, and JP17H06130, respectively. Y.M. is also supported by the Mitsubishi Foundation grant no. 30140. T.G. acknowledges the support by the Ministry of Science and Technology of Taiwan through grant 105-2112-M-007-003-MY3. T.I. is supported by the ALMA Japan Research Grant of NAOJ Chile Observatory, NAOJ-ALMA-217.
Footnotes
1 |$\langle$| https://help.almascience.org/index.php?/Knowledgebase/List |$\rangle$|.
2The [C ii] emission line of J2239|$+$|0207 spans two spectral windows (see figure 2). We thus integrated the emission in the range 261.50–262.25 GHz in one window and 262.25–262.75 GHz in the other, and combined them to generate the moment 0 map.
3The mean and standard deviation of the distribution is |$327 \pm 135$| km s|$^{-1}$| for the full sample of seven objects (Cycle 4 |$+$| 5).
5We used the bolometric correction factor of 4.4 from 1450 Å luminosity (Richards et al. 2006) and Mg ii-based |$M_{\rm BH}$| data to compute the Eddington ratios.
6Emissivity |$\propto \nu ^\beta$|.
7We adopted |$S_* = 2.35$| mJy, |$\phi _* = 1.54 \times 10^3$| deg|$^{-2}$|, |$\alpha = -2.12$|, and effective area = 80% of each field (see table 5 of Fujimoto et al. 2016).
8STSDAS is a product of the Space Telescope Science Institute, which is operated by AURA for NASA.
References
Author notes
NAOJ Fellow.
