-
PDF
- Split View
-
Views
-
Cite
Cite
Satoshi Takeshige, Hiroyuki R Takahashi, Kazunari Shibata, Non-relativistic and relativistic magnetic reconnection with the effects of optically thin synchrotron cooling, Publications of the Astronomical Society of Japan, Volume 71, Issue 3, June 2019, 63, https://doi.org/10.1093/pasj/psz038
Close - Share Icon Share
Abstract
We performed special relativistic resistive magnetohydrodynamic simulations of Petscheck-type magnetic reconnection including an optically thin synchrotron cooling. The magnetization parameter, σ0, which is the ratio of Poynting flux to mass flux in the upstream plasma, is taken to be 0.01 and 3. For the non-relativistic plasma (σ0 = 0.01), the radiative cooling subtracts thermal energy mainly in the upstream plasma and a plasma is strongly compressed at the slow shock. The cooling in the post-shock region and plasmoid also reduces the thermal energy and it forms a narrower outflow. The reconnection rate slightly increases as a result of the radiative cooling, since the plasma beta in the inflow region becomes small. The effect of decreasing thermal energy in the outflow region is more prominent for the relativistic plasma (σ0 = 3). In this case, the outflow temperature increases and the plasma internal energy becomes comparable to the plasma rest mass energy. The subtraction of this thermal energy by radiative cooling leads to a decrease in plasma inertia and the outflows are more accelerated than without radiative cooling. The reconnection rate is also enhanced by its Lorentz contraction effect. For both non-relativistic and relativistic simulations, it is concluded that the reconnection rate is determined by the plasma beta in the inflow region.
1 Introduction
Magnetic reconnection is one of the most promising mechanisms for energy release in space, solar, and laboratory plasmas. While breaking the magnetic topology, the stored magnetic free energy is converted to plasma kinetic and thermal energies in a short timescale (Parker 1957; Petschek 1964). The dissipation of the magnetic energy during this process is now recognized to be important in high-energy astrophysical phenomena, such as black hole accretion disks (Machida & Matsumoto 2003; Takahashi et al. 2016), isolated neutron stars (Kennel & Coroniti 1984; Lyutikov 2003), neutron star binaries (Romanova et al. 2012; Takahashi & Ohsuga 2017; Parfrey et al. 2017), soft gamma-ray repeaters (Masada et al. 2010), active galactic nuclei (Di Matteo 1998), and gamma-ray bursts (Drenkhahn & Spruit 2002; McKinney & Uzdensky 2012).
In high-energy astrophysical phenomena, the plasma is sometimes characterized by the magnetization parameter σ = B2/(4πρc2), where B, ρ, and c are the magnetic field strength, mass density, and speed of light, respectively (Kennel & Coroniti 1984). The magnetization parameter is expected to exceed unity in strongly magnetized plasma. Since the Alfvén speed is close to the speed of light in such a circumstance, a relativistic treatment is inevitable to understand observed flares in these phenomena.
The theoretical model of relativistic magnetic reconnection was first proposed by Blackman and Field (1994), see also Lyutikov (2003), by adopting a simple Ohm’s law for relativistic plasmas (Blackman & Field 1993). Then, Lyubarsky (2005) showed analytically that a fundamental physical view of the relativistic reconnection process can be understood as a straightforward extension of classical reconnection theory.
Following these theoretical studies, a special relativistic resistive magnetohydrodynamic (SR-RMHD) code has been developed and adopted to study relativistic magnetic reconnection. Watanabe and Yokoyama (2006) showed for the first time that steady, Petschek-type magnetic reconnection is realized and a fast energy conversion is plausible (see also Zenitani et al. 2010) in magnetically dominated relativistic plasmas. Then, Takahashi et al. (2011) performed numerical simulations in the context of relativistic Sweet–Parker-type reconnection. Their results are consistent with a theoretical study by Lyubarsky (2005) where relativistic Sweet–Parker-type magnetic reconnection is a slow process for energy conversion, while the system would make transition to a fast process accompanied by plasmoid instability in a high-Lundquist-number regime (Shibata & Tanuma 2001; Takamoto 2013). In addition to these studies, the magnetic reconnection process for collisionless plasmas has been investigated using particle-in-cell (PIC) simulations (Zenitani & Hoshino 2001; Bessho & Bhattacharjee 2005). From these studies, fast magnetic dissipation can be realized through relativistic magnetic reconnection for collisionless plasmas.
In these simple magnetic reconnection models, the magnetic energy is assumed to be converted to plasma kinetic and thermal energies. While the basics of relativistic magnetic reconnection have been developed, these authors ignored another important mechanism, namely the radiation process. Since a high-density and strongly magnetized plasma is expected in high-energy astrophysical phenomena, the radiative cooling and scattering processes, which transport energy and momentum between the plasma and radiation, would affect the reconnection dynamics.
Some authors showed theoretically and numerically that the radiative cooling may affect the reconnection dynamics. Steinolfson and van Hoven (1984) indicated that tearing instability and thermal instability can coexist for solar atmospheric conditions, and numerically investigated the growth of these instabilities using non-relativistic MHD simulations. They found that the growth rate of the tearing instability increases as a result of radiative cooling. Then, Uzdensky and McKinney (2011) studied the stability of the current sheet following the accretion disk theory, and showed that a strong compression due to the radiative cooling can enhance the reconnection rate. Bearing in mind these studies, Takahashi and Ohsuga (2013) performed self-consistent special relativistic resistive radiation magnetohydrodynamic simulations by taking into account free–free emission/absorption and electron scattering for the first time. They showed that a radiation drag force decelerates the inflow and outflow, and it results in reducing the reconnection rate in radiation-dominated plasmas. The importance of radiative cooling has also been investigated for collisionless plasmas using radiative PIC simulations (Jaroschek & Hoshino 2009). The current sheet is disrupted due to the radiative cooling, and to the system transitions to fast reconnection. The role of strong radiative cooling in collisional plasmas is, however, not understood well, especially in the non-linear regime.
In this paper, we focus on magnetic reconnection considering an optically thin synchrotron cooling. Since the emissivity of the synchrotron radiation depends on the magnetic energy density, the synchrotron radiation can be important for magnetic reconnection in magnetically dominated plasmas. As noted before, a relativistic treatment is inevitable in high-σ plasma. Thus, we have investigated magnetic reconnection using the SR-RMHD code based on Takahashi and Ohsuga (2013), examining how synchrotron cooling changes the characteristic quantities of the reconnection process, like the reconnection rate, and also qualitatively discussing synchrotron radiation effects in the MHD regime.
In section 2 we introduce the basic equations for synchrotron cooling based on Esin et al. (1996), and an initial condition for numerical simulations. Then, in section 3 we show our results of numerical simulations comparing the cases with and without radiative cooling. We also discuss the difference between the non-relativistic σ ≪ 1 and relativistic σ > 1 cases. Finally, section 4 discusses the properties of the radiative reconnection process and section 5 summarizes our conclusions.
2 Numerical settings and simulation models
2.1 Basic equations and numerical setting
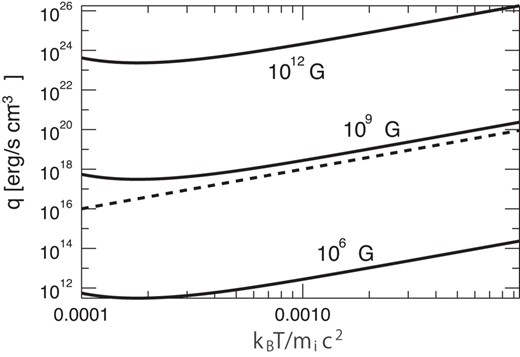
The temperature dependence of the synchrotron emissivity q0 at |$B = 10^6 \, {\rm G}$|, |$10^9 \, {\rm G}$|, and |$10^{12} \, {\rm G}$| (solid lines; Esin et al. 1996). The dashed line represents |$\propto \theta _{\rm i}^2$|.
2.2 Initial conditions and numerical settings
In this paper we consider both non-relativistic and relativistic plasmas. For non-relativistic plasmas, the magnetic field energy is taken to be smaller than the plasma rest mass energy. The corresponding initial plasma beta is β0 = 1 and the initial magnetization parameter, |$\sigma _0 \equiv B_0^2/(4\pi \rho _0 c^2)$|, is σ0 = 10−2, where the initial density of the upstream plasma, |$\rho _0 \equiv (1+\beta _0)B_0^2/8\pi T_{\rm i,0}$|, is |$10^{-8}\, \rm {g\, cm^{-3}}$|. We take the initial temperature to be |$k_{\rm B}T_{\rm i,0}=0.005\, m_{\rm i}c^2$| and the specific heat ratio Γ = 5/3. The corresponding Alfvén velocity is about 0.1c.
For relativistic plasmas, the magnetic energy slightly exceeds the rest mass energy. The corresponding initial plasma beta and magnetization parameter are β0 = 0.3 and σ0 = 3, and we take the typical density as |$\rho _0=10^{-14}\, \rm {g\, cm^{-3}}$|. We take |$k_{\rm B}T_{\rm i,0} = 0.5 \, m_{\rm i}c^2$| and Γ = 4/3. The corresponding Alfvén velocity is about 0.707c.
| Model . | β0 . | σ0 . | V A . | τcool/τA . | βin . | v in/vA . | ρout/ρin . | d/L . | γout/γin . |
|---|---|---|---|---|---|---|---|---|---|
| A | 1 | 0.01 | 0.1 | — | 1.14 | 0.113 | 1.38 | 0.090 | 1.002 |
| B | 1 | 0.01 | 0.1 | 10 | 0.15 | 0.130 | 2.30 | 0.063 | 1.003 |
| C | 0.3 | 0.01 | 0.1 | — | 0.36 | 0.125 | 1.99 | 0.072 | 1.003 |
| D | 0.15 | 0.01 | 0.1 | — | 0.17 | 0.134 | 2.29 | 0.060 | 1.003 |
| E | 0.33 | 3 | 0.707 | — | 0.51 | 0.122 | 2.20 | 0.049 | 1.26 |
| F | 0.22 | 3 | 0.757 | — | 0.34 | 0.125 | 2.51 | 0.042 | 1.32 |
| G | 0.11 | 3 | 0.802 | — | 0.16 | 0.133 | 3.48 | 0.029 | 1.42 |
| H | 0.33 | 3 | 0.707 | 29 | 0.28 | 0.127 | 2.68 | 0.039 | 1.35 |
| I | 0.33 | 3 | 0.707 | 15 | 0.20 | 0.129 | 2.74 | 0.033 | 1.44 |
| J | 0.33 | 3 | 0.707 | 5 | 0.14 | 0.134 | 3.02 | 0.030 | 1.51 |
*In this list, β0, σ0, and vA are the initial plasma beta, the initial magnetization parameter, and the initial Alfvén velocity of the upstream plasma, respectively. For models B, H, I, and J, τcool/τA represents the initial cooling timescale normalized by the Alfvén time in the upstream plasma. βin is the plasma beta of the inflow region in the steady state for each model.
| Model . | β0 . | σ0 . | V A . | τcool/τA . | βin . | v in/vA . | ρout/ρin . | d/L . | γout/γin . |
|---|---|---|---|---|---|---|---|---|---|
| A | 1 | 0.01 | 0.1 | — | 1.14 | 0.113 | 1.38 | 0.090 | 1.002 |
| B | 1 | 0.01 | 0.1 | 10 | 0.15 | 0.130 | 2.30 | 0.063 | 1.003 |
| C | 0.3 | 0.01 | 0.1 | — | 0.36 | 0.125 | 1.99 | 0.072 | 1.003 |
| D | 0.15 | 0.01 | 0.1 | — | 0.17 | 0.134 | 2.29 | 0.060 | 1.003 |
| E | 0.33 | 3 | 0.707 | — | 0.51 | 0.122 | 2.20 | 0.049 | 1.26 |
| F | 0.22 | 3 | 0.757 | — | 0.34 | 0.125 | 2.51 | 0.042 | 1.32 |
| G | 0.11 | 3 | 0.802 | — | 0.16 | 0.133 | 3.48 | 0.029 | 1.42 |
| H | 0.33 | 3 | 0.707 | 29 | 0.28 | 0.127 | 2.68 | 0.039 | 1.35 |
| I | 0.33 | 3 | 0.707 | 15 | 0.20 | 0.129 | 2.74 | 0.033 | 1.44 |
| J | 0.33 | 3 | 0.707 | 5 | 0.14 | 0.134 | 3.02 | 0.030 | 1.51 |
*In this list, β0, σ0, and vA are the initial plasma beta, the initial magnetization parameter, and the initial Alfvén velocity of the upstream plasma, respectively. For models B, H, I, and J, τcool/τA represents the initial cooling timescale normalized by the Alfvén time in the upstream plasma. βin is the plasma beta of the inflow region in the steady state for each model.
3 Results
In both non-relativistic and relativistic simulations, given a spatially localized resistivity, the magnetic fields start to reconnect around the origin after the start of the simulation. As the magnetic reconnection proceeds, upstream plasmas flow toward the reconnection region and reconnection outflow is generated in the ±x directions. The outflow velocity in the outflow region [typically, (x, y) = (25λ, 0)] is close to the inflow Alfvén velocity [typically, (x, y) = (0, 15λ)]. We have also confirmed that slow shocks are formed between inflows and outflows. These results are qualitatively consistent with the classical Petschek model, while steady magnetic reconnection is realized even with synchrotron cooling. We hereafter define the subscripts “in” and “out” as the quantities at (x, y) = (0, 15λ) and (25λ, 0), respectively.
3.1 Non-relativistic cases
3.1.1 Models without radiative cooling
First, we consider the non-relativistic case without radiative cooling, named model A. Figure 2 represents the temperature distribution of model A at t/τA = 50, 100, and 150, respectively. For model A, the magnetic fields are efficiently dissipated in the diffusion region (|$\sqrt{x^2+y^2} \le \lambda$|), plasma flow toward the diffusion region in the y direction is induced, and the plasma is heated and accelerated in the x direction. After t/τA ≈ 100, the steady reconnection is realized. These features are consistent with classical reconnection theory and previous simulations (e.g., Ugai 1992).
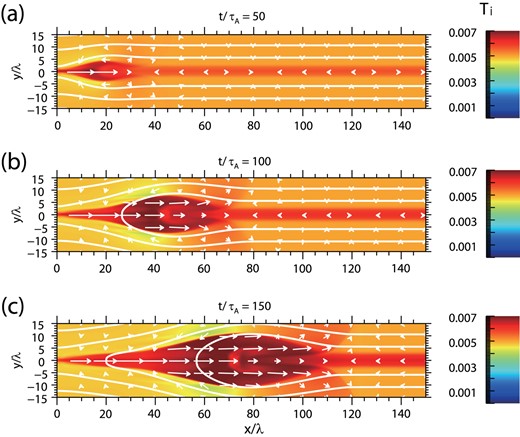
Snapshots of the temperature, Ti, for model A (without radiative cooling) at t/τA = 50, 100, and 150 from top to bottom, respectively. The white curves show the magnetic field lines. (Color online)
3.1.2 Models with radiative cooling
We consider the non-relativistic case with radiative cooling, named model B. Figure 3 represents the temperature distribution of model B at t/τA = 50, 100 and 150, respectively. As shown in figure 3, after the simulation starts the plasma thermal energy is efficiently extracted by radiative cooling within the strongly magnetized upstream plasmas in the timescale τcool. In model B, the temperature of the inflow plasma decreases from θi = BTi/mic2 = 1.8 × 10⁻³ at t/τA = 50 to θi = 6.8 × 10⁻⁴ at t/τA = 200, whereas it is almost constant for model A (θi = 4.9 × 10⁻³ at t/τA = 50 and θi = 4.8 × 10⁻³ at t/τA = 200). We have confirmed that steady reconnection is realized whether considering radiative cooling or not after t/τA ≃ 100.
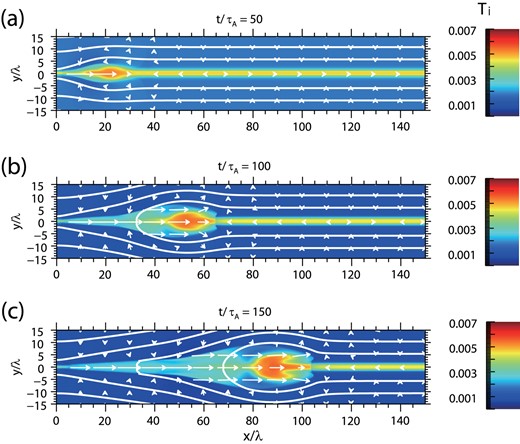
Snapshots of the temperature, Ti, for model B (with radiative cooling) at t/τA = 50, 100, and 150 from top to bottom, respectively. The white curves show the magnetic field lines. (Color online)
3.1.3 Differences in the structure of the reconnection region between models A and B
In figure 4, we show one-dimensional profiles of various physical quantities of the outflow plasma parallel to the y axis across x = 25/λ at t = 150τA for models A and B, respectively. We found that even though the outflow temprature is lower by a factor of 3 for model B than that for model A, its difference across the slow shock is enhanced. This indicates that a stronger shock is formed for model B. The cooling effect is more prominent in the high-density region of outflow (namely, the plasmoid). Since the synchrotron cooling function is proportional to the density and temperature, the internal energy is efficiently transported by radiation in the shock region and plasmoid. This leads to the narrower outflow and shrinking of the plasmoid.

One-dimensional profiles of (a) normalized temperature, (b) density, (c) magnetic field strength, and (d) emissivity parallel to the y axis across x/λ = 25 at t = 150τA. The black dashed curves and red solid curves show the results for models A and B, respectively. (Color online)
Figures 5a–5c show the distributions of the density, temperature, and magnetic energy density at t = 150τA, respectively. In these figures, the upper panels show the results with radiative cooling (model B) and the lower panels show the results without radiative cooling (model A). We can see that the mass density in the outflow region is higher, typically by a factor of 2 for model B than that for model A. Also, the outflow has a narrower angle with radiative cooling. To see this in detail we define an outflow opening angle d/L, where d is the y coordinate of the slow shock at x ≡ L = 25λ. For models A and B, the plasma compression ratio and the outflow opening angle are shown in table 1.
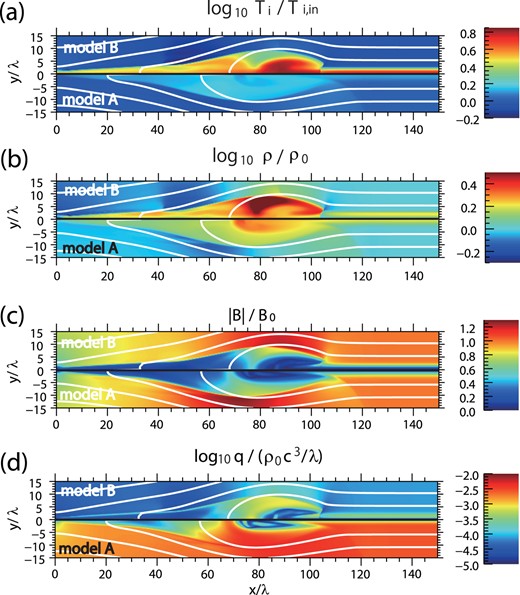
The color contours show two-dimensional profiles of (a) normalized temperature, (b) density, (c) magnetic field strength, and (d) emissivity at t/τA ≃ 150. The white curves show the magnetic field lines. In each figure, the bottom panel shows the results for model A and the top panel shows the results for model B. (Color online)
Also, outflow velocities are different in each model. Model B shows faster outflow than model A, since the outflow speed approaches the local Alfvén velocity of the upstream plasma and the effect of radiative cooling increases the Alfvén velocity in the inflow region. We found that the magnetic field strength and the inflow density become smaller than their initial values. The ratios of the decreased magnetic field strength to the inflow density in models A and B are ≃ 1.03 and ≃ 1.2, respectively. When the reconnection starts, the fast mode rarefaction wave propagates in the upstream plasma. Since the plasma beta in the upstream region decreases due to the radiative cooling, a stronger rarefaction wave is expected to propagate, which drags plasma quickly toward the reconnection region. The inflow region is more rarefied for the radiative cooling model and the Alfvén velocity increases.
In figure 5d, we show profiles of the synchrotron emissivity. In model A, the radiative cooling is not taken into account in the dynamics. The emissivity shown in the bottom panel of figure 5d is simply evaluated from physical quantities obtained from numerical simulations without radiative cooling. The thermal energy in the inflow region is efficiently subtracted due to the radiative cooling. As noted before, the cooling rate is proportional to |$T_{\rm i}^2$|, so that the radiative cooling becomes inefficient after t ≳ 100τA. After that, the reconnection process reaches almost steady state.
We found two high-emissivity regions after the magnetic reconnection is well developed in model B. One is just behind the slow shock and the other is in the plasmoid. Just behind the slow shock, the plasmas are compressed and the density and temperature suddenly increase by dissipating the magnetic and kinetic energies. The synchrotron emissivity slightly increases in this region (see figure 4). Inside the plasmoid, the plasmas and magnetic field are compressed by reconnection outflows. These regions with a high density and/or strong magnetic field can be responsible for strong emission during the magnetic reconnection. The outflow regions, situated between two slow shocks, are not bright compared to the shock region and plasmoid, and the magnetic field is weak in this region. The emission from the outflow region is thus weak, compared to the other regions.
3.1.4 The β dependence of the reconnection rate
Figure 6 shows the time evolution of the reconnection rate for models A (black solid line) and B (black dashed line). We define the reconnection rate as the reconnection inflow speed vin = |vy| normalized by the Alfvén speed at (x, y) = (0, 15λ). We can see that the reconnection rate increases with time and is saturated after t/τA ≃ 100. The reconnection rate for model A is about 0.1, which is consistent with previous results (e.g., Watanabe & Yokoyama 2006), while it is slightly enhanced for model B (≃ 0.13). Thus, the reconnection rate is affected by the radiative cooling.
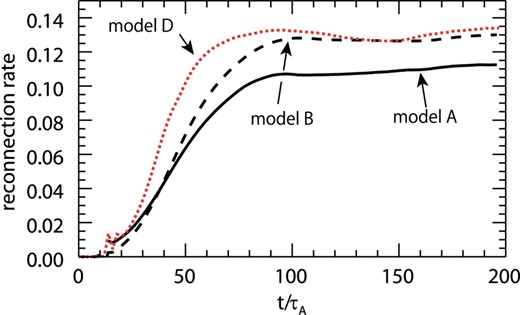
Time evolution of the reconnection rate, vin/vA. The solid line is the result for model A, the dashed line is model B, and the red dotted line is model D. (Color online)
The radiative cooling, however, affects not only the reconnection region but also the inflow plasma. The plasma beta in the inflow beta is different from the initial plasma beta, β0, but it decreases with time. Thus, we performed another simulation (model D) to distinguish the cooling effect and the low beta plasma effect. The initial conditions were the same as model A, but β0 was set at a lower value, β0 = 0.15, by decreasing the initial temperature (kBTi, 0 = 0.0065). In figure 7 we show the time evolution of the inflow plasma beta, |$\beta _{\rm in} \equiv p_{\rm g,in}/(B_{\rm in}^2/8\pi )$|, for models A, B, and D. We can see the plasma beta in the inflow region for models B and D are roughly equal after t ≳ 100τA. The red dotted line in figure 6 shows the reconnection rate for model D. The reconnection rate is terminated around 0.13–0.14. This value is higher than that of model A, but it is close to that of model B. Thus, the enhancement of the reconnection rate observed in model B is due to the decrease in the plasma beta in the inflow plasma.
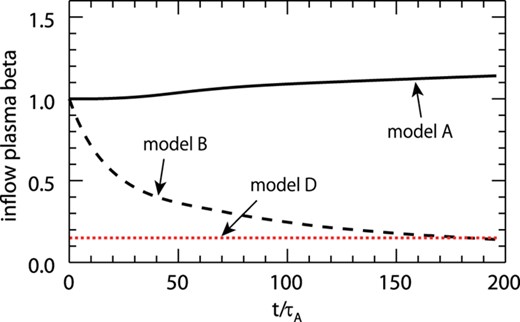
Time evolution of the plasma beta in the inflow region, βin. The solid line is the result for model A, the dashed line is model B, and the red dotted line is model D. (Color online)
In figure 8a, the vertical axis shows the reconnection rate and the horizontal axis is the plasma beta in the inflow region. In this figure, the results of non-relativistic models and relativistic models are represented as black and green symbols, and the results with radiative cooling and without radiative cooling are represented as cross and circle symbols, respectively. We found that the reconnection rate increases as βin decreases, whether taking into account radiative cooling or not. In figure 8b, the vertical axis shows the reconnection rate and the horizontal axis shows the reconnection rate evaluated by multiplying the three terms of the right-hand side of equation (19): the compression ratio, the opening angle, and the Lorentz contraction effect. We can see that the equality in equation (19) holds in all models.
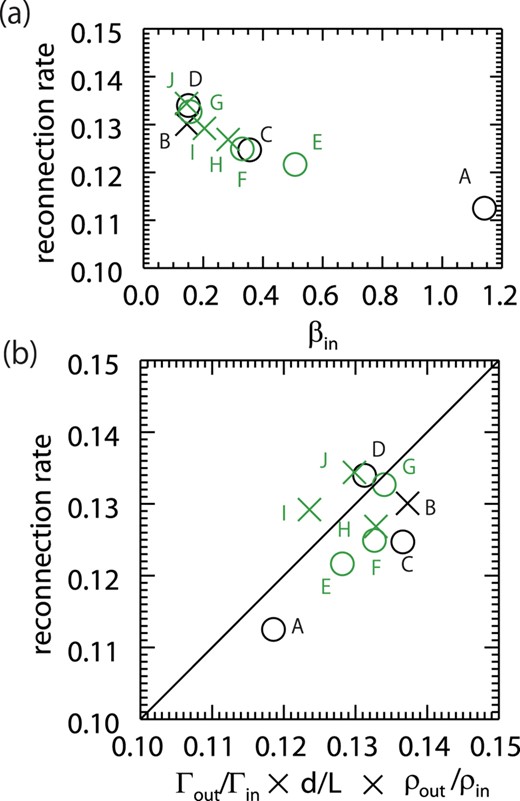
(a) The vertical axis is the reconnection rate, vin/vA, and the horizontal axis is the plasma beta in the inflow region, βin. (b) The vertical axis is the reconnection rate and the horizontal axis is the right-hand side of equation (19). In both figures, the circle and cross symbols represent the results without radiative cooling and with radiative cooling, respectively. The black and green symbols represent the results with the non-relativistic parameter and relativistic parameter, respectively. (Color online)
In figure 9, the horizontal axis represents βin, and the vertical axis represents (a) the reconnection rate, (b) the compression ratio, (c) the opening angle, and (d) the Lorentz contraction effect, respectively. First, the effect of Lorentz contraction can be ignored in models A, B, and D. In these models, the magnetic energy is much smaller than the plasma rest mass energy in the inflow region. The inflow Alfvén velocity, which characterizes the outflow velocity, is much slower than c (vout ≃ vA, in ≃ 0.1c). Thus, the Lorentz contraction effect on the reconnection rate never works in these models. Second, as noted before, the outflow opening angle becomes smaller with decreasing plasma beta. This effect reduces the reconnection rate, while it is compensated by the compression effect. The resulting reconnection rate is enhanced for low-beta plasmas. Lastly, the reconnection rate, as well as the compression ratio and the opening angle, is comparable between models B and D.
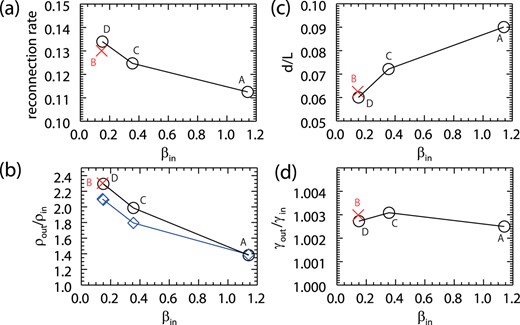
Non-relativistic simulation results. In each figure, the vertical axis represents (a) the reconnection rate, (b) the plasma compression, (c) the outflow opening angle, and (d) the Lorentz contraction. The horizontal axis is the plasma beta in the inflow region, βin, in a steady state. The black circles represent the results without radiative cooling (models A, B, and C), and the red crosses represent the results with radiative cooling (model B). In panel (b), the blue symbols represent the compression ratio evaluated by X = 1 + (Γβ1 + Γ − 1)−1 for each model, where Γ = 5/3 is the adiabatic ratio. (Color online)
3.2 Relativistic case
In this subsection we investigate relativistic magnetic reconnection, in which the magnetic energy density is comparable to the plasma rest mass energy. In order to investigate the dependence on the cooling timescale, we performed numerical simulations using six models (E, F, G, H, I, and J). Model E is a fiducial model where radiative cooling is not taken into account. For models H, I, and J, the initial parameters are the same as in model E (e.g., β0 = 0.3 and σ0 = 3), but we take radiative cooling into account. We take the ratio of the radiative cooling time and the Alfvén time as τcool/τA = 29, 15, and 5 for models H, I, and J, respectively. For models F and G, we do not consider radiative cooling, and the initial plasma beta is set at a lower value than the other models (E, H, I, and J) to mimic the radiative cooling effects in the upstream plasma. We take β = 0.3 for models E, H, I, and J, while β = 0.22 and 0.11 for models F and G. This value of the plasma beta for model F (G) is comparable with that of model H (J) after the reconnection is well developed. The initial distribution of the magnetic field and the plasmas are the same as in our non-relativistic simulations.
In model E, in which radiative cooling is not taken into account, the system reaches steady state after about 100 Alfvén timescales. In the steady state, the reconnection outflow is heated and accelerated to the Alfvén speed of the inflow region through the slow shock, as in other relativistic reconnection studies (Watanabe & Yokoyama 2006; Zenitani et al. 2010; Takahashi & Ohsuga 2013). Steady reconnection is also realized when radiative cooling is taken into account in relativistic plasma. Table 1 shows that the reconnection rate increases for a shorter cooling timescale and lower plasma beta. The compression ratio, the outflow opening angle, and the ratio of outflow Lorentz factor to inflow Lorentz factor are also shown in table 1.
Similarly in the non-relativistic case, the compression ratio and the outflow opening angle are affected by radiative cooling. As the cooling timescale is shorter, the compression ratio is higher and the outflow is narrower. The reconnection rate is determined by the competition between these two factors for non-relativistic plasmas. In relativistic plasmas, an additional effect comes into consideration, namely the Lorentz contraction effect γout/γin. Since the magnetic free energy in the upstream plasma is comparable to the plasma rest mass energy, and thus the Alfvén velocity is close to light speed, the outflows induced by magnetic reconnection have a relativistic speed. The reconnection rate is enhanced by the factor γout/γin in relativistic plasmas (Blackman & Field 1994; Watanabe & Yokoyama 2006).
We also performed another simulation without radiative cooling (models F and G). In models F and G, the initial conditions are the same as model E, but the initial plasma beta was set to be comparable to those of models H (βin ≃ 0.28) and J (βin ≃ 0.14) at t/τA ≃ 200, respectively. Comparing the results of models G and J, βin in the steady state has almost the same value (0.14 in model J and 0.16 in model G). The agreement of βin in the steady state is confirmed in models F and H.
Similarly in the non-relativistic case, the reconnection rate and outflow opening angle are well matched, as shown in figures 10a and 10c for models G and J. In figure 10b, however, the plasma compression effect in model G (3.48) is slightly larger than in model J (3.10), and the outflow speed in model G (vout/c ≃ 0.71, γout ≃ 1.41) is slower than in model J (vout/c ≃ 0.75, γout ≃ 1.50), as shown in figure 10d. Thus, although the reconnection rates are comparable in these models, their compositions [equation (19)] are different. We found that the specific enthalpy of the outflow for model J (h ≃ 2.36) is lower than that of model G (h ≃ 2.78). We also found a similar tendency between models F and H. As noted before, the specific enthalpy contributes to the plasma inertia for a relativistic plasma. This specific enthalpy (and internal energy) is reduced by radiative cooling for model J. The reduction of the plasma inertia makes the plasma more accelerated. These results indicate that, in model J, the outflow plasmas are more efficiently accelerated by removing the outflow thermal energy due to the radiative cooling. We conclude that the radiative cooling behind the Petschek slow shocks contributes to accelerate the outflow plasma.
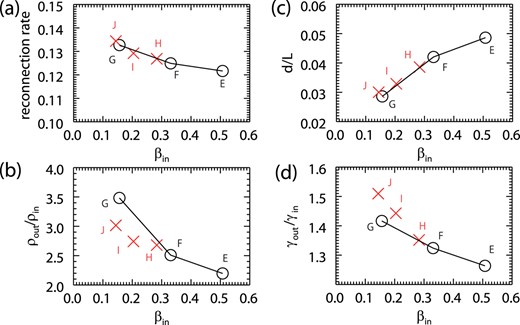
Relativistic simulation results. In each figure, the vertical axis represents (a) the reconnection rate, (b) the plasma compression, (c) the outflow opening angle, and (d) the Lorentz contraction. The horizontal axis is the plasma beta in the inflow region, βin, in a steady state. The black circles represent the results without radiative cooling (models E and I), and the red crosses represent the results with radiative cooling (models F, G, and H). (Color online)
4 Discussion
In this paper we have assumed that the electron temperature, Te, is the same as the ion temperature, Ti. However, radiation is emitted from the gyrating electrons and the radiative cooling timescale is smaller than the ion–electron collision timescale under some circumstances, like a pulsar magnetosphere. Thus, Te is smaller than Ti in regions where the emissivity is large, and the emission region can be different from the results of our numerical simulations. In order to investigate more realistic situations, it is important to perform the MHD simulations considering not only radiative cooling but also different Te and Ti in the energy equation (e.g., Sa¸ dowski et al. 2017).
We estimated the synchrotron emissivity integrated by the frequency as in Esin et al. (1996), and set the critical frequency νc = 0. Mahadevan, Narayan, and Yi (1996) suggested that when the plasma temperature is lower than θi ≃ 10−5, νc is large and the emitted photon is absorbed at low cyclotron harmonics. In our simulation, the ratios of the first and second terms in equation (2) are 1.9 × 10⁻² and 2.4 × 10⁻¹ for θi = 4.9 × 10⁻³ and 6.8 × 10⁻⁴ respectively. In our models with radiative cooling, the temperatures of the inflow plasmas are higher than these values, and thus we have neglected the self-absorption effect. In addition, we considered the radiative cooling of optically thin synchrotron emission in this study. When we consider the reconnection process in optically thick plasmas, the formula for the cooling function in equation (5) could not be also applied. Takahashi and Ohsuga (2013) suggested that compressed outflow plasmas are in thermal equilibrium and that a radiation drag force could have an important role in the reconnection process for optically thick plasmas. It is challenging to investigate the reconnection process in a mildly optically thick regime. We need to solve the radiation transfer equation (Ohsuga & Takahashi 2016): this remains a problem for future work.
In figure 5d, we show that the emissivity is high at the plasmoid and reconnection shocks. Plasma ejections in association with solar flares driven by magnetic reconnection, called coronal mass ejection, are observed and have been theoretically and numerically investigated (Chen & Shibata 2000; Low 2001). This plasma ejection has also been detected as a giant flare from a magnetar, which is a subclass of neutron stars and has a stronger dipole magnetic field (B ∼ 1014−15 G) than ordinary pulsars (B ∼ 1011−13 G; Taylor et al. 2005), and synchrotron radiation will possibly be observed in the future. In addition, recent studies have shown that many MHD shocks are formed through magnetic reconnection, whatever the magnetic diffusion models are (Zenitani & Miyoshi 2011), and flare loops are full of MHD shocks (Takasao & Shibata 2016). Therefore, our study can be the basis for showing how such high-energy phenomena are observed.
We have shown that the synchrotron emissivity becomes large in the plasmoid and just behind the MHD slow shocks. In our simulations, the magnetic energy density in the outflow region becomes small behind the MHD slow shocks, and the cooling timescale in outflow plasmas becomes longer than the dynamical timescale. When the magnetic field is sufficiently strong, radiative cooling would have an effect even in the outflow region. Furthermore, when a strong guide field exists, the plasma also cools down in the outflow region since the guide field is not dissipated.
Lastly, we have shown that the effect of radiative cooling is more prominent in relativistic plasma. The outflow speed increases with decreasing cooling time since the plasma enthalpy is efficiently extracted by radiation. This reduces the plasma inertia. The reconnection rate is enhanced due to the Lorentz contraction effect. We observed an increase in reconnection rate with strong cooling (model J). It is, however, still comparable to the low-beta case (model G), even though the compression effect is important in model J. We expect that faster outflow and energy dissipation would be realized in the strongly magnetized case (σ0 ≫ 1). Unfortunately, such a simulation is difficult due to the growth of a numerical instability. We have to develop a more sophisticated numerical scheme to overcome this problem, but it remains as future work.
5 Summary
In this paper, we have performed special relativistic resistive magnetohydrodynamic simulations of Petschek-type magnetic reconnection by introducing optically thin synchrotron radiative cooling. The initial condition is assumed to be anti-parallel, dynamic equilibrium, and a thermal current sheet, while it is not in thermal equilibrium. We show results for non-relativistic plasmas (σ0 = 10−2) and for relativistic plasmas (σ0 = 3). The introduction of the radiative cooling effect shows the following features:
For non-relativistic plasma, radiative cooling mainly affects the upstream plasma. The decrease in plasma beta due to radiative cooling leads to narrower outflow and stronger compression at the slow shocks. The resulting reconnection rate is higher with radiative cooling (low beta) than without cooling (high beta) because the compression effect compensates for a small angle between two shocks.
Strong synchrotron emission is radiated from the shocked region and a plasmoid, where the density and temperature increases due to the compression.
For relativistic plasma, the outflow velocity increases with radiative cooling for a shorter cooling timescale. The radiative cooling extracts the plasma enthalpy in the inflow region. This leads to an increase in the Alfvén velocity. The radiative cooling also extracts plasma enthalpy in the outflow region. The outflow is more accelerated due to the decrease in plasma inertia. These two effects make the reconnection outflow faster. The reconnection rate is enhanced by the Lorentz contraction effect.
For both non-relativistic plasma (σ0 ≪ 1) and relativistic plasma (σ0 > 1), the reconnection rate increases with decreasing plasma beta for the upstream plasma.
Acknowledgments
S.T. acknowledges support by the Research Fellowship of Japan Society for the Promotion of Science (JSPS). This work is supported in part by JSPS Grant-in-Aid for Young Scientists (17K14260 H.R.T.) and by MEXT as “Priority Issue on Post-K computer” (Elucidation of the Fundamental Laws and Evolution of the Universe) and JICFuS. This work is also supported in part by the Center for the Promotion of Integrated Sciences (CPIS) of Sokendai. Our numerical computations were carried out on a Cray XC30 at the Center for Computational Astrophysics, National Astronomical Observatory of Japan. S.T. and H.R.T. are grateful to K. Itakura for useful discussions and financial support.
References


