


Abstract
We present the results from ALMA CO(3–2) observations of 66 Hα-selected galaxies in three protoclusters around radio galaxies: PKS 1138−262 (|$z$| = 2.16), USS 1558−003 (|$z$| = 2.53), and 4C 23.56 (|$z$| = 2.49). The pointing areas have an overdensity of ∼100 compared to the mean surface number density of galaxies in field environments. We detect the CO emission line in 16 star-forming galaxies, including six previously published galaxies, to measure the molecular gas mass. In the stellar mass range of 10.5 < log (Mstar/M⊙) < 11.0, the protocluster galaxies have larger gas mass fractions and longer gas depletion timescales compared to the scaling relations established for field galaxies. On the other hand, the amounts of molecular gas in more massive galaxies with log (Mstar/M⊙) > 11.0 are comparable in mass to the scaling relation, or smaller. Our results suggest that the environmental effects on gas properties are mass dependent: in high-density environments, gas accretion through cosmic filaments is accelerated in less massive galaxies, while this is suppressed in the most massive system.
1 Introduction
In the local Universe at |$z$| < 0.1, most galaxies in massive clusters occupy the red sequence on the color–magnitude diagram, implying that they are quenched, passively evolving galaxies (e.g., Butcher & Oemler 1984). Massive, red sequence galaxies likely first emerge in protoclusters at |$z$| = 2–3 when the cosmic star formation history peaks (Kodama et al. 2007). Therefore, protoclusters in the forming phase are an appropriate laboratory for studying the origin of forming the massive end of the red sequence. CO measurements of protocluster galaxies are critical for assessing the molecular gas reservoirs fueling star formation. Efficient gas accretion in less massive halos retains or enhances the ability to form stars (e.g., Dekel et al. 2009) while ram pressure stripping in clusters removes hot gas, fueling star formation, from galaxies (e.g., Steinhauser et al. 2016). On the other hand, field galaxies are subject to influence by time variations of gas accretion. A key question is whether the environmental variations in molecular gas properties exceed the time variations seen in field galaxies.
For field galaxies, Tacconi et al. (2018) established the scaling relations of the gas mass fraction, fgas = Mgas/(Mstar + Mgas), and the gas depletion timescale, τdepl = Mgas/SFR, by compiling CO data for 667 galaxies over 0 < |$z$| < 4, predicting CO luminosities from redshift, stellar mass, and star formation rates (SFRs) relative to the main sequence at fixed stellar mass, SFR/SFRMS (see also Genzel et al. 2015). In clusters or protocluster regions, recent observations have detected the CO emission from a few dozen galaxies at |$z$| = 1.5–2.5 (Aravena et al. 2012; Tadaki et al. 2014; Emonts et al. 2016; Hayashi et al. 2017, 2018; Dannerbauer et al. 2017; Lee et al. 2017; Noble et al. 2017; Stach et al. 2017; Rudnick et al. 2017; Coogan et al. 2018; Wang et al. 2018). However, many of these previous studies focus on only one cluster.
Here we present the results from CO J = 3–2 observations of three protoclusters, PKS 1138−262 (PKS1138) at |$z$| = 2.16, USS 1558−003 (USS1558) at |$z$| = 2.53, and 4C 23.56 (4C23) at |$z$| = 2.49, using the Atacama Large Millimeter/submillimeter Array (ALMA). We assume a Chabrier initial mass function (IMF; Chabrier 2003) and adopt cosmological parameters of H0 = 70 km s−1 Mpc−1, ΩM = 0.3, and |$\Omega _\Lambda$| = 0.7.
2 Sample selection
2.1 Hα emitter survey with Subaru
Three protoclusters of PKS1138, USS1558, and 4C23 were originally identified as an excess of Lyα emitters and/or
distant red galaxies around the radio galaxy (Knopp & Chambers 1997; Kurk et al. 2000; Kajisawa et al. 2006; Kodama et al. 2007). In these protoclusters, we have made a systematic Hα emitter survey with narrow-band filters using the MOIRCS (Multi-Object Infrared Camera and Spectrograph) near-infrared instrument on Subaru (MAHALO project; Kodama et al. 2013). Narrow-band filters could pick up [O iii] emitters at |$z$| ∼ 3 as well as Hα emitters at |$z$| ∼ 2. Utilizing the difference in the Balmer break wavelengths in the observed frame, we have efficiently removed the interlopers based on the color–color magnitudes (Hayashi et al. 2016; Shimakawa et al. 2018b). Our panoramic Hα mapping identifies an X-shaped structure centered on the radio galaxy in PKS1138 (Koyama et al. 2013; Shimakawa et al. 2018b), two dense star-bursting groups of galaxies in USS1558 (Hayashi et al. 2012, 2016; Shimakawa et al. 2018a) and a 2 Mpc-scale group on the east side of the radio galaxy in 4C23 (Tanaka et al. 2011). These structures are also spectroscopically confirmed to be associated with the radio galaxies (Tanaka et al. 2011; Shimakawa et al. 2014). In this work, we have not used ten Hα emitters with X-ray detection (Pentericci et al. 2002; Blundell & Fabian 2011; Macuga et al. 2018) because the SFR estimate is highly uncertain due to the active galactic nuclei (AGN) contribution to Hα luminosity.
2.2 Stellar mass and star formation rate
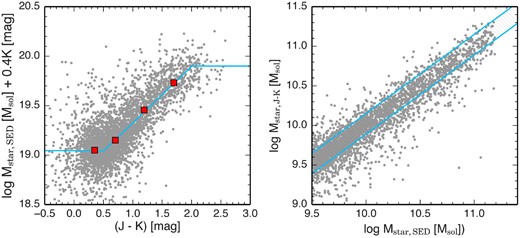
Left: Stellar mass-to-light ratios as a function of J − K color for ∼3000 star-forming galaxies at |$z$| = 2.1–2.6 in field environments (Skelton et al. 2014; Momcheva et al. 2016). The red squares show the median values in each color bin, and a cyan line indicates the best-fit relation given by equation (1). Right: Comparison between SED-fit-based and single-color-based stellar masses. The cyan hatched region shows the standard deviation (±0.13 dex) of the differences (log Mstar, SED/log Mstar, J-K). (Color online)
We used a MIPS (Multiband Imaging Photometer for Spitzer) 24 μm image to identify dusty star formation and estimate the total infrared (IR) luminosities of Hα emitters. The data was retrieved from the Spitzer Heritage Archive (Astronomical Observation Request Keys: 14888704, 14888960, 14889216 for 1138; 21852416 for 1558; 10765568, 17910528 for 4C23). We applied self-calibration on the BCD (Basic Calibrated Data) images to remove large-scale sky patterns and make mosaic images with a pixel scale of |$1{^{\prime \prime}_{.}}25$| using the MOPEX (Mosaicker and Point source Extractor) software (Makovoz & Khan 2005). Source extraction and 7′ aperture photometry were performed with the APEX (Astronomical Point source EXtractor) module in MOPEX. We used an aperture correction of 2.57 to derive total fluxes, following the recipe in the MIPS Data Handbook. The 3 σ limiting fluxes are 43 μJy in 1138, 86 μJy in 1558, and 50 μJy in 4C23, which correspond to SFR = 46 M⊙ yr−1, 174 M⊙ yr−1, and 92 M⊙ yr−1, respectively.
Next, we extrapolated total infrared luminosities, LIR, with MIPS 24 μm fluxes and estimated SFRs (Kennicutt 1998), though 24 μm is not an ideal wavelength to accurately derive total infrared luminosities. Elbaz et al. (2011) showed comparisons between MIPS 24 μm-based and Herschel-based infrared luminosities using Chary and Elbaz (2001) templates. In the range of log (LIR/L⊙) > 12, the 24 μm method overestimates infrared luminosities. Wuyts et al. (2011) found that 24 μm-based infrared luminosities are well correlated with Herschel-based ones if Wuyts et al. (2008) templates are used. Therefore, we used Wuyts et al. (2008) templates to avoid overestimating SFRs.
For galaxies without detection at mid-infrared, SFRs were computed from Hα luminosities with correction for dust extinction. We corrected for the contribution of the [N ii] line to narrow-band fluxes assuming a mass–metallicity relation of star-forming galaxies at similar redshift (Steidel et al. 2014). A combination of stellar mass and Hα equivalent width predicted the dust extinction level (AHα) with a systematic uncertainty of 0.32 mag (Koyama et al. 2015). This prediction was calibrated by using local galaxies, but Cullen et al. (2018) found that dust properties like a dust extinction–stellar mass relation do not evolve significantly from local galaxies out to high redshift. We propagated the measurement errors of observed Hα luminosities, L(Hα)uncor, and the systematic uncertainty of dust extinction, AHα, to the errors in the estimate of intrinsic Hα luminosities, L(Hα)cor, on the basis of the equation |$L(\mathrm{H}\alpha )_\mathrm{cor} = L(\mathrm{H}\alpha )_\mathrm{uncor} \times 10^{(0.4A_{\mathrm{H}\alpha })}$|.
3 Observations and results
3.1 Target fields
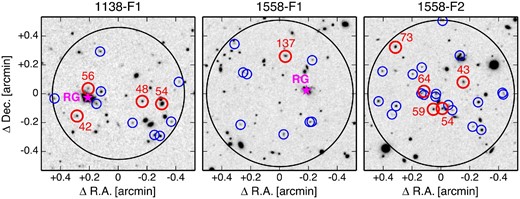
Two-dimensional spatial distributions of Hα emitters in protoclusters at |$z$| ∼ 2 on Subaru/MOIRCS narrow-band images. The red and blue circles represent CO-detected and non-detected objects, respectively. The IDs of CO-detected galaxies are noted near the circles. Magenta stars indicate the positions of radio galaxies. The primary beam of the ALMA pointing is shown by large black circles. (Color online)
3.2 ALMA observations
To observe the CO (3–2) emission line (νrest = 345.796 GHz in the rest frame) at |$z$| ∼ 2.5, we used the Band-3 receivers with the 64-input correlator in time division mode with a central frequency of 110 and 98 GHz. On-source time was 1.3 hr for PKS1138 and 2.4 hr per pointing for USS1558. We utilized the Common Astronomy Software Application package (CASA; McMullin et al. 2007) for the data calibration. We reconstructed clean maps with a channel width of 100 km s−1, adopting natural weighting. In the 1138-F1, 1558-F1, and 1558-F2 cubes, the synthesized beam sizes are |$1{^{\prime \prime}_{.}}8$| × |$1{^{\prime \prime}_{.}}5$|, |$1{^{\prime \prime}_{.}}8$| × |$1{^{\prime \prime}_{.}}4$|, and |$2{^{\prime \prime}_{.}}0$| × |$1{^{\prime \prime}_{.}}5$|, respectively. The rms levels are 125 μJy beam−1, 90 μJy beam−1, and 97 μJy beam−1 per 100 km s−1 bin.
For the 4C23 protocluster, Lee et al. (2017) have made CO(3–2) observations to cover 21 Hα emitters with four ALMA pointings. The median overdensity is δ = 79. We made clean maps in the same way as for the PKS1138 and USS1558 data. With natural weighting, the synthesized beam size and the rms level are |$0{^{\prime \prime}_{.}}9$| × |$0{^{\prime \prime}_{.}}7$| and 174 μJy beam−1 per 100 km s−1 bin, respectively. We also smoothed the maps to match the beam size to |$1{^{\prime \prime}_{.}}5$| for measurements of galaxy-integrated fluxes.
3.3 CO detections
We used velocity-binned cubes with a width of 400 km s−1 to search for a >5 σ peak within a 2′ aperture around the Hα emitters in the frequency range expected from the narrow-band redshift (Δ|$z$| = ±0.02). We also searched for a negative 5 σ peak in the same region, but did not detect any negative signals, indicating that our criterion is safe. We detected the CO line from a total of 16 galaxies (4 in PKS1138, 6 in USS1558, and 6 in 4C23). Lee et al. (2017) reported CO detection in 4C 23.5, but this object does not satisfy the detection criterion adopted in this work. For four galaxies (1138.54, 1558.43, 1558.54, 1558.59), the CO (1–0) emission line was previously detected in ATCA (Dannerbauer et al. 2017) or JVLA observations (Tadaki et al. 2014; Emonts et al. 2016). All CO(3–2)-detected galaxies in PKS1138 were also detected in CO(4–3) (Emonts et al. 2018). Seven galaxies (1138.48, 1138.54, 4C 23.3, 4C 23.4, 4C 23.8, 4C 23.9, 4C 23.16) were detected at MIPS 24 μm. For the remaining nine galaxies, their Hα-based SFRs are consistent within the error with the upper limit given by the MIPS 24 μm data (subsection 2.2).
The CO detection rate is high, 69% (11/16), in the stellar mass range of log (Mstar/M⊙) > 10.5, while it decreases to 12% (6/50) for lower stellar mass galaxies (figure 3). The low detection rate is probably due to a combination of small gas masses and metallicity effects on the CO-to-H2 conversion factor (Genzel et al. 2012; Bolatto et al. 2013). In this stellar mass range, our CO sample is likely to be biased to active star-forming galaxies in the upper side of the main sequence (figure 3).
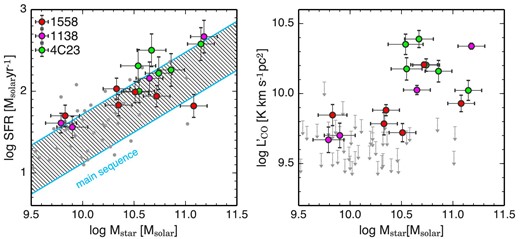
Left: Stellar mass vs. SFR for the CO sample in protoclusters at |$z$| ∼ 2 (red circles for USS1558, magenta circles for PKS1138, and green circles for 4C 23.56). The cyan shaded region shows the range of the main sequence of star-forming galaxies with a 1 σ scatter of 0.3 dex (Speagle et al. 2014). The gray dots show CO non-detected Hα emitters. Right: Stellar mass vs. CO line luminosity. The upper limit was determined by the 5 σ values of CO fluxes, assuming a velocity width of 400 km s−1. (Color online)
Figure 4 presents the CO spectra extracted from the peak position in the clean cubes. Fitting the CO (3–2) spectra with a single Gaussian function, we found that the line width is over a wide range of FWHM = 180–740 km s−1 (table 1). We made moment-0 maps in the velocity range where the flux density is above 15% of the peak of the best-fit Gaussian spectra to measure the velocity-integrated CO fluxes. A flux integrated in an inadequate range of velocity would be boosted or de-boosted by noise fluctuations (Coogan et al. 2018). To investigate this effect, we created a simulated spectra by adding the best-fit Gaussian models to 35 noise spectra extracted in sky regions in the 1558-F2 field as a representative. We then measured the velocity-integrated fluxes in the same way as mentioned above and derived the ratios of the model flux to the measured flux. The median values range from 0.97 to 1.03, indicating little systematic boosting effect.
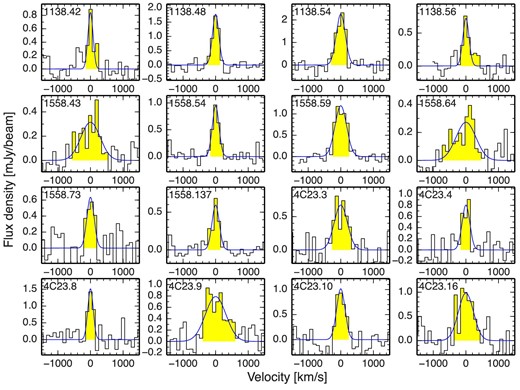
CO spectra of Hα-selected star-forming galaxies in three protoclsuters. The blue lines show the best-fit profile with a single Gaussian model. The integrated velocity ranges are shown by yellow shaded regions. (Color online)
Properties of 16 Hα-selected star-forming galaxies with CO(3–2) line detections.
| ID | RA | Dec | log Mstar | SFR | |$z$| CO | FWHM | S CO dV | log Mgas | f gas | τdepl |
|---|---|---|---|---|---|---|---|---|---|---|
| (°) | (°) | (M⊙) | (M⊙ yr−1) | (km s−1) | (Jy km s−1) | (M⊙) | (Gyr) | |||
| 1138.42 | 175.2029 | −26.4879 | 9.79 ± 0.15 | 41 ± 12 | 2.163 | 185 | 0.19 ± 0.04 | 11.21 | 0.96 | 4.0 |
| 1138.48 | 175.1945 | −26.4862 | 10.65 ± 0.13 | 144 ± 66 | 2.157 | 232 | 0.42 ± 0.03 | 10.99 | 0.69 | 0.7 |
| 1138.54 | 175.1919 | −26.4865 | 11.18 ± 0.13 | 466 ± 214 | 2.148 | 328 | 0.88 ± 0.04 | 11.23 | 0.53 | 0.4 |
| 1138.56 | 175.2014 | −26.4847 | 9.90 ± 0.15 | 36 ± 11 | 2.144 | 224 | 0.20 ± 0.04 | 11.08 | 0.94 | 3.4 |
| 1558.43 | 240.2942 | −0.5189 | 11.08 ± 0.13 | 66 ± 21 | 2.528 | 698 | 0.26 ± 0.04 | 10.84 | 0.37 | 1.1 |
| 1558.54 | 240.2966 | −0.5219 | 10.35 ± 0.13 | 67 ± 20 | 2.515 | 242 | 0.23 ± 0.02 | 11.00 | 0.82 | 1.5 |
| 1558.59 | 240.2977 | −0.5220 | 10.72 ± 0.13 | 88 ± 26 | 2.513 | 420 | 0.49 ± 0.02 | 11.18 | 0.75 | 1.7 |
| 1558.64 | 240.2988 | −0.5199 | 9.83 ± 0.14 | 50 ± 15 | 2.529 | 721 | 0.21 ± 0.04 | 11.54 | 0.98 | 6.9 |
| 1558.73 | 240.3021 | −0.5149 | 10.33 ± 0.13 | 106 ± 31 | 2.526 | 261 | 0.19 ± 0.03 | 10.91 | 0.79 | 0.8 |
| 1558.137 | 240.3247 | −0.4756 | 10.51 ± 0.13 | 98 ± 29 | 2.525 | 264 | 0.16 ± 0.02 | 10.76 | 0.64 | 0.6 |
| 4C 23.3 | 316.8376 | 23.5206 | 10.86 ± 0.13 | 182 ± 84 | 2.488 | 482 | 0.45 ± 0.08 | 11.11 | 0.64 | 0.7 |
| 4C 23.4 | 316.8401 | 23.5281 | 11.15 ± 0.13 | 379 ± 174 | 2.490 | 281 | 0.33 ± 0.05 | 10.93 | 0.38 | 0.2 |
| 4C 23.8 | 316.8164 | 23.5243 | 10.74 ± 0.13 | 166 ± 76 | 2.486 | 197 | 0.50 ± 0.05 | 11.17 | 0.73 | 0.9 |
| 4C 23.9 | 316.8441 | 23.5287 | 10.67 ± 0.14 | 318 ± 146 | 2.485 | 739 | 0.77 ± 0.11 | 11.38 | 0.84 | 0.8 |
| 4C 23.10 | 316.8154 | 23.5200 | 10.55 ± 0.15 | 99 ± 32 | 2.485 | 303 | 0.47 ± 0.09 | 11.20 | 0.82 | 1.6 |
| 4C 23.16 | 316.8110 | 23.5211 | 10.54 ± 0.17 | 205 ± 94 | 2.484 | 544 | 0.70 ± 0.12 | 11.38 | 0.87 | 1.2 |
4 Molecular gas properties
We estimated the gas masses in the protocluster galaxies by following the method of Tacconi et al. (2018). Molecular gas masses are usually estimated from CO(J = 1–0) line luminosities, |$L^{\prime }_{(1-0)}$|, while our ALMA observations provide the CO(J = 3–2) line luminosities, |$L^{\prime }_{(3-2)}$|. The CO line luminosity ratio approaches unity when the gas density and/or temperature are sufficiently high. The environmental dependence of CO excitation would be an interesting issue to study; probing it requires observations of lower-J CO lines. Therefore, we assume the same CO excitation with |$L^{\prime }_{(1-0)}/L^{\prime }_{(3-2)} =1.8$|, which is a typical value in field galaxies (Genzel et al. 2012; Bolatto et al. 2013), for a fair comparison. We also adopted a metallicity-dependent CO-to-H2 conversion factor of |$M_\mathrm{gas}/L^{\prime }_{(1-0)}=4.36\times f_\mathrm{metal}$| [M⊙(K km s−1 pc−2)−1], where fmetal corrects for metallicity effects through the stellar mass–metallicity relation (Genzel et al. 2012; Bolatto et al. 2013). The correction factor is fmetal = 1.1 at log (Mstar/M⊙) = 11 and fmetal = 1.4 at log (Mstar/M⊙) = 10.5. We also give the 5 σ upper limit of molecular gas mass using CO cubes with 400 km s−1 width for galaxies without CO detections (table 2 in the Appendix).
The gas mass fractions and the gas depletion timescales are listed in table 1. As gas mass fractions depend on stellar mass and SFR (Genzel et al. 2015; Scoville et al. 2017; Tacconi et al. 2018), we compared the measured molecular gas properties with the scaling relations at fixed stellar mass and SFR. The scaling relation of Tacconi et al. (2018) was derived from 667 field galaxies, including starburst galaxies as well as normal star-forming galaxies. Their SFR offsets relative to the main sequence are distributed over the range of −0.5 dex < log (SFR/SFRMS) < +1.0 dex. For extreme starburst outliers or quiescent galaxies, the scaling relation is not yet verified. Our sample of protocluster galaxies is within the valid range of the scaling relation. The gas mass fractions are still larger and the gas depletion timescales are significantly longer compared to the scaling relations (figure 5). This is partly due to sample bias and the sensitivity limit of our observations. In the stellar mass range of log (Mstar/M⊙) < 10.5, only five out of 50 galaxies are detected in CO. Therefore, they are particularly gas-rich outliers, resulting in enhancing the star formation activity with log (SFR/SFRMS) ≈ 0.3 dex.
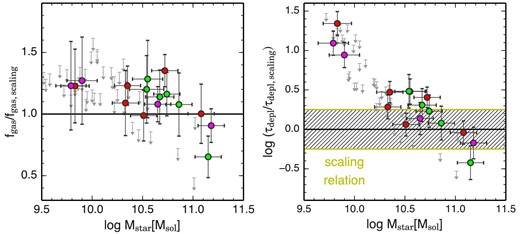
Ratio of gas mass fraction and gas depletion timescale to the predicted values from the scaling relations, as a function of stellar mass. The uncertainty of the scaling relation is shown by the yellow shaded region (±0.25 dex). The error bars take into account the uncertainties of stellar mass, SFR, and gas mass estimates. (Color online)
In the stellar mass range of 10.5 < log (Mstar/M⊙) < 11.0, the excess of gas mass fractions cannot be explained either by sample bias or higher SFRs, because the detection rate of CO is high, 73% (= 8/11), and the galaxies are mostly located on the main sequence in the stellar mass–SFR diagram (figure 3). Nevertheless, the gas depletion timescales are longer than expected from the scaling relation by 0.5 dex. The protocluster galaxies tend to have larger gas reservoirs, as seen in cluster galaxies at |$z$| ∼ 1.5 (Noble et al. 2017).
In contrast, we did not find such a gas-rich system in the stellar mass range of log (Mstar/M⊙) > 11.0. Three CO-detected galaxies (1138.54, 1558.43, 4C 23.4) are moderately gas rich, with fgas = 0.37–0.53, and their gas depletion timescales are consistent with the scaling relation (figure 5). We also comment that one non-detected galaxy (1138.58) has an extremely short gas depletion timescale of τdepl < 0.2 Gyr due to active star formation. This galaxy is likely in the transition phase from star-forming to quiescent.
5 Discussion
At a fixed redshift and stellar mass, galaxies with higher SFR have a larger gas mass fraction, suggesting that the rate of gas accretion onto galaxies is higher as well (Saintonge et al. 2012, 2017). Efficient gas accretion increases the amount of available gas in galaxies, which results in enhancing the star formation activity. The scaling relation takes into account time variations of gas accretion for 667 galaxies with CO measurements but does not include galaxies in high-density environments. Exploiting CO measurements for 16 star-forming galaxies associated with protoclusters at |$z$| ∼ 2.5, we derived the gas mass fractions and the gas depletion time scales. The environmental difference in molecular gas properties is likely dependent on the stellar mass of the system, although we need a larger sample to verify the scaling relation in high-density environments.
In the stellar mass range of 10.5 < log (Mstar/M⊙) < 11.0, we found protocluster galaxies to have larger gas mass fractions than expected from the scaling relation. Such an enhanced gas fraction has been reported in massive clusters at |$z$| ∼ 1.5 (Noble et al. 2017, 2018). In contrast, Darvish et al. (2018) reported no environmental dependence of gas properties for galaxies at |$z$| ∼ 2 in the COSMOS field, but their sample did not include extremely high-density regions with δ ≈ 100. Our results in the protoclusters suggest the existence of more efficient gas accretion in regions at the intersection of cosmic filaments (Shimakawa et al. 2017). Nevertheless, they still remain on the main sequence of star-forming galaxies, resulting in longer gas depletion timescales. The variation of gas depletion timescales could be related to the spatial distributions of molecular gas within galaxies. As star formation occurs only in dense, cold molecular clouds, a supply of newly accreted gas does not necessarily enhance star formation. In this work, we used the CO(3–2) emission line as a tracer of the total amount of molecular gas, including diffuse gas, under the assumption of a constant CO(3–2)/CO(1–0) ratio, although it in principle probes dense (n > 104 cm−3) or warm (T > 30 K) gas. Therefore, it is not clear how much gas is directly associated with star formation. If starburst preferentially occurs in central compact regions and molecular gas is more extended (Tadaki et al. 2017), the galaxy-integrated gas depletion timescales could be longer compared to the case when the molecular gas is compact as well. Higher-resolution CO observations would be needed to look at the origin of the environmental variations of gas depletion timescales.
On the other hand, we found no excess of gas mass fraction in the most massive system with log (Mstar/M⊙) > 11.0. The deficiency of molecular gas requires a physical process to suppress efficient gas accretion only in the most massive systems. Numerical simulations show that there are two modes of gas accretion (cold with T<105 K and hot with T ∼ 106 K; Kereš et al. 2005; Dekel & Birnboim 2006). In less massive halos with log (Mhalo/M⊙) < 12, dense cold gas is directly accreted onto galaxies through streams, leading to starbursts. Because of the steady gas supply, high-redshift star-forming galaxies can maintain active star formation and stay on the main sequence. In massive halos with log (Mhalo/M⊙) > 12, the accreted gas is heated by a virial shock and the remaining gas in galaxies is consumed by star formation. Halo quenching would also affect the gas properties of lower stellar mass galaxies in massive halos, but the current sensitivity is not high enough to identify the deficient CO emission. Another possible mechanism is AGN feedback. AGN-driven outflows preferentially expel low-density gas, leading to decrease of gas fractions, while they have little effect on dense star-forming gas (Gabor & Bournaud 2014). If AGN activities are increased in massive galaxies in high-density environments (Tanaka et al. 2012), the gas fractions would be smaller than those of field galaxies.
It is still challenging to test these scenarios and other possibilities such as ram pressure stripping (e.g., Kenney & Young 1989; Boselli et al. 2014). Our ALMA observations demonstrate great potential to succeed statistical CO studies in protocluster galaxies with log (Mstar/M⊙) > 10.5. Given the high signal-to-noise ratios in some galaxies, higher-resolution observations allow us to spatially resolve the CO emission. Dynamical properties like baryonic mass fraction and rotation velocity-to-dispersion ratio could shed light on the physical processes responsible for the environmental impacts on molecular gas properties.
Acknowledgements
We thank the referee for constructive comments. This paper makes use of the following ALMA data: ADS/JAO.ALMA#2015.1.00395.S. ALMA is a partnership of ESO (representing its member states), NSF (USA), and NINS (Japan), together with NRC (Canada), NSC and ASIAA (Taiwan), and KASI (Republic of Korea), in cooperation with the Republic of Chile. The Joint ALMA Observatory is operated by ESO, AUI/NRAO, and NAOJ. The MIR data used in this paper are taken with the Spitzer Space Telescope, which is operated by the Jet Propulsion Laboratory, California Institute of Technology under a contract with NASA. K.T. acknowledges support by Grant-in-Aid for JSPS Research Fellow JP17J04449 and Scientific Research (S) JP17H06130. Data analysis was in part carried out on the common-use data analysis computer system at the Astronomy Data Center (ADC) of the National Astronomical Observatory of Japan.
Appendix.
Catalog of CO non-detected galaxies in three protoclusters
For protocluster galaxies without CO detections, we give the 5 σ upper limit of molecular gas mass, gas mass fraction, and gas depletion timescales, assuming a line width of 400 km s−1 (table 2). Some galaxies do not have a meaningful upper limit on gas depletion timescale as the 5 σ value is more than 10 Gyr.
Properties of 52 Hα-selected star-forming galaxies without CO(3–2) line detections.
| ID | RA | Dec | log Mstar | SFR | S CO dV | log Mgas | f gas | τdepl |
|---|---|---|---|---|---|---|---|---|
| (°) | (°) | (M⊙) | (M⊙yr−1) | (Jy km s−1) | (M⊙) | (Gyr) | ||
| 1138.35 | 175.1922 | −26.4902 | 10.22 ± 0.13 | 101 ± 29 | <0.23 | <10.88 | <0.82 | <0.8 |
| 1138.37 | 175.1957 | −26.4887 | 10.05 ± 0.15 | 14 ± 5 | <0.15 | <10.82 | <0.86 | <4.6 |
| 1138.39 | 175.1929 | −26.4901 | 10.32 ± 0.13 | 79 ± 30 | <0.21 | <10.80 | <0.75 | <0.8 |
| 1138.41 | 175.1907 | −26.4885 | 9.58 ± 0.17 | 16 ± 5 | <0.23 | <11.76 | <0.99 | — |
| 1138.45 | 175.2004 | −26.4865 | 10.00 ± 0.14 | 45 ± 16 | <0.14 | <10.84 | <0.87 | <1.5 |
| 1138.49 | 175.2058 | −26.4859 | 9.54 ± 0.17 | 18 ± 6 | <0.25 | <11.92 | <1.00 | — |
| 1138.57 | 175.1897 | −26.4839 | 9.68 ± 0.18 | 15 ± 7 | <0.24 | <11.53 | <0.99 | — |
| 1138.58 | 175.1998 | −26.4850 | 10.40 ± 0.13 | 71 ± 21 | <0.14 | <10.57 | <0.60 | <0.5 |
| 1138.65 | 175.1999 | −26.4804 | 10.25 ± 0.14 | 44 ± 13 | <0.18 | <10.76 | <0.77 | <1.3 |
| 1558.31 | 240.2897 | −0.5201 | 10.22 ± 0.19 | 38 ± 12 | <0.16 | <10.92 | <0.83 | <2.2 |
| 1558.32 | 240.2896 | −0.5202 | 10.36 ± 0.14 | 47 ± 15 | <0.16 | <10.84 | <0.75 | <1.4 |
| 1558.35 | 240.2921 | −0.5244 | 9.94 ± 0.13 | 121 ± 36 | <0.14 | <11.18 | <0.95 | <1.2 |
| 1558.38 | 240.2925 | −0.5212 | 11.01 ± 0.13 | 144 ± 42 | <0.12 | <10.51 | <0.24 | <0.2 |
| 1558.39 | 240.2931 | −0.5240 | 10.19 ± 0.17 | 25 ± 8 | <0.13 | <10.85 | <0.82 | <2.8 |
| 1558.44 | 240.2946 | −0.5158 | 10.46 ± 0.13 | 139 ± 41 | <0.12 | <10.67 | <0.62 | <0.3 |
| 1558.46 | 240.2955 | −0.5221 | 9.52 ± 0.15 | 12 ± 4 | <0.10 | <12.20 | <1.00 | — |
| 1558.47 | 240.2959 | −0.5215 | 9.04 ± 0.21 | 13 ± 4 | <0.10 | <17.32 | <1.00 | — |
| 1558.52 | 240.2967 | −0.5118 | 9.86 ± 0.14 | 35 ± 10 | <0.20 | <11.45 | <0.98 | <8.1 |
| 1558.55 | 240.2974 | −0.5205 | 10.27 ± 0.23 | 21 ± 8 | <0.10 | <10.68 | <0.72 | <2.3 |
| 1558.57 | 240.2974 | −0.5202 | 10.02 ± 0.14 | 57 ± 17 | <0.10 | <10.91 | <0.89 | <1.4 |
| 1558.60 | 240.2990 | −0.5172 | 9.23 ± 0.17 | 10 ± 3 | <0.11 | <14.42 | <1.00 | — |
| 1558.61 | 240.2988 | −0.5203 | 10.47 ± 0.22 | 24 ± 9 | <0.10 | <10.59 | <0.57 | <1.6 |
| 1558.65 | 240.2990 | −0.5202 | 9.95 ± 0.14 | 58 ± 18 | <0.10 | <11.02 | <0.92 | <1.8 |
| 1558.66 | 240.3001 | −0.5180 | 9.30 ± 0.15 | 15 ± 5 | <0.11 | <13.71 | <1.00 | — |
| 1558.71 | 240.3020 | −0.5217 | 10.08 ± 0.13 | 68 ± 20 | <0.13 | <10.96 | <0.88 | <1.3 |
| 1558.72 | 240.3024 | −0.5226 | 9.21 ± 0.18 | 6 ± 2 | <0.14 | <14.75 | <1.00 | — |
| 1558.77 | 240.3036 | −0.5177 | 10.20 ± 0.14 | 39 ± 12 | <0.16 | <10.95 | <0.85 | <2.3 |
| 1558.79 | 240.3040 | −0.5211 | 10.55 ± 0.13 | 51 ± 16 | <0.16 | <10.76 | <0.62 | <1.1 |
| 1558.130 | 240.3217 | −0.4832 | 8.79 ± 0.22 | 4 ± 1 | <0.11 | <25.51 | <1.00 | — |
| 1558.131 | 240.3217 | −0.4760 | 9.88 ± 0.14 | 21 ± 7 | <0.12 | <11.20 | <0.95 | <7.6 |
| 1558.132 | 240.3219 | −0.4832 | 9.72 ± 0.15 | 35 ± 11 | <0.11 | <11.52 | <0.99 | <9.5 |
| 1558.134 | 240.3249 | −0.4846 | 10.32 ± 0.13 | 54 ± 16 | <0.11 | <10.71 | <0.71 | <0.9 |
| 1558.145 | 240.3292 | −0.4777 | 10.31 ± 0.13 | 17 ± 6 | <0.11 | <10.70 | <0.71 | <3.0 |
| 1558.147 | 240.3299 | −0.4835 | 9.99 ± 0.15 | 15 ± 5 | <0.13 | <11.05 | <0.92 | <7.3 |
| 1558.148 | 240.3296 | −0.4775 | 9.83 ± 0.14 | 33 ± 10 | <0.11 | <11.27 | <0.97 | <5.6 |
| 1558.151 | 240.3306 | −0.4742 | 10.01 ± 0.13 | 13 ± 5 | <0.16 | <11.14 | <0.93 | — |
| 4C 23.2 | 316.8407 | 23.5304 | 10.85 ± 0.13 | 229 ± 106 | <0.21 | <10.77 | <0.45 | <0.3 |
| 4C 23.5 | 316.8207 | 23.5085 | 10.58 ± 0.13 | 194 ± 89 | <0.18 | <10.77 | <0.61 | <0.3 |
| 4C 23.6 | 316.8395 | 23.5221 | 10.34 ± 0.14 | 40 ± 13 | <0.22 | <10.95 | <0.81 | <2.2 |
| 4C 23.7 | 316.8147 | 23.5271 | 11.02 ± 0.14 | 40 ± 13 | <0.18 | <10.68 | <0.32 | <1.2 |
| 4C 23.12 | 316.8122 | 23.5299 | 9.17 ± 0.19 | 227 ± 68 | <0.23 | <15.24 | <1.00 | — |
| 4C 23.13 | 316.8409 | 23.5283 | 9.79 ± 0.16 | 84 ± 26 | <0.20 | <11.54 | <0.98 | <4.1 |
| 4C 23.14 | 316.8324 | 23.5142 | 9.83 ± 0.16 | 43 ± 14 | <0.19 | <11.43 | <0.98 | <6.4 |
| 4C 23.15 | 316.8331 | 23.5190 | 9.90 ± 0.17 | 37 ± 13 | <0.18 | <11.30 | <0.96 | <5.5 |
| 4C 23.17 | 316.8234 | 23.5307 | 9.75 ± 0.16 | 20 ± 7 | <0.38 | <11.91 | <0.99 | — |
| 4C 23.18 | 316.8401 | 23.5337 | 9.93 ± 0.17 | 29 ± 10 | <0.27 | <11.43 | <0.97 | <9.4 |
| 4C 23.19 | 316.8425 | 23.5294 | 10.11 ± 0.18 | 31 ± 11 | <0.20 | <11.09 | <0.91 | <4.0 |
| 4C 23.20 | 316.8123 | 23.5224 | 10.05 ± 0.18 | 19 ± 7 | <0.22 | <11.18 | <0.93 | <8.1 |
| 4C 23.22 | 316.8244 | 23.5291 | 9.10 ± 0.31 | 25 ± 9 | <0.38 | <16.49 | <1.00 | — |
| 4C 23.23 | 316.8115 | 23.5218 | 9.27 ± 0.37 | 23 ± 9 | <0.24 | <14.15 | <1.00 | — |
References
