


Abstract
ASASSN-14dx showed an extraordinary outburst whose features are a small outburst amplitude (∼2.3 mag) and long duration (>4 yr). Because we found a long observational gap of 123 d before the outburst detection, we propose that the main outburst plateau was missed and that this outburst is just a “fading tail” often seen after the WZ Sge-type super-outbursts. In order to distinguish between WZ Sge and SU UMa-type dwarf novae (DNe), we investigated Gaia Data Release 2 (DR2) statistically. We applied a logistic regression model and succeeded in classifying by using absolute Gaia magnitudes MG and Gaia colors GBP–GRP. Our new classifier also suggests that ASASSN-14dx is the best candidate of a WZ Sge-type DN. We estimated distances from the Earth of known WZ Sge stars by using Gaia DR2 parallaxes. The result indicates that ASASSN-14dx is the third-nearest WZ Sge star (next to WZ Sge and V455 And), and hence the object can show the third-brightest WZ Sge-type super-outburst whose maximum is V = 8–9 mag.
1 Introduction
Cataclysmic variables (CVs) are close binaries composed of a white dwarf (WD) primary and a Roche lobe-filling secondary. An accretion disk is formed around the primary because the secondary transfers its mass to the primary. Dwarf novae (DNe), which are a subclass of CVs, are characterized by a sudden increase of the disk brightness called an “outburst”. There are two competing models to explain a dwarf nova outburst: the mass-transfer burst model (Bath 1973) and the thermal instability model (Osaki 1974; Hōshi 1979). At the present time, the latter is widely accepted at least for typical dwarf nova outbursts. For instance, Dubus, Otulakowska-Hypka, and Lasota (2018) estimated the mass-transfer rates of 130 CVs by using the parallax distances of the Gaia Data Release 2 (DR2). The estimated mass-transfer rates of dwarf novae and nova-like stars are consistent with their theoretical values predicted by the thermal instability model, respectively (for a review of CVs and DNe, see, e.g., Warner 1995).
SU UMa-type DNe show not only normal outbursts but also super-outbursts with larger scales. During super-outbursts, we can observe “superhumps” whose amplitude is 0.1–0.5 mag and period is a few percent longer than the orbital period Porb. Super-outbursts and superhumps are thought to be a result of the thermal-tidal instability (TTI) (Osaki 1989). When an outburst begins, the disk expands. If the object has a sufficiently low mass ratio q, the outer edge of the disk can reach the 3:1 resonance radius which causes the tidal instability (Whitehurst 1988; Osaki 1989; Lubow 1991a, 1991b; Hirose & Osaki 1990.)
WZ Sge-type DNe are a subclass of SU UMa-type ones and considered to be objects at the terminal stage of the CV evolution. WZ Sge stars are characterized by the large amplitude and long duration super-outbursts which are accompanied by “early superhumps” in the early terms of the super-outbursts. According to the modern criteria provided by Kato (2015), WZ Sge stars are defined by the presence of an early superhump phase. It is thought that early superhumps are triggered by the 2:1 resonance (Lin & Papaloizou 1979; Osaki & Meyer 2002). Early superhumps are double-peaked modulations whose periods are close to Porb. Because the early superhumps are caused by a geometrical effect, their amplitudes depend on their inclination angles. Thus, in low-inclination systems, we can observe a long outburst plateau with no superhumps instead of an early superhump phase. SU UMa stars evolve into WZ Sge ones as the mass transfer proceeds because only CVs with extremely low mass ratios (typically q < 0.09) and low mass-transfer rates can reach the 2:1 resonance radius (for a review of WZ Sge-type DNe, see Kato 2015).
According to the theoretical CV evolution calculated by Kolb (1993), 70% of CVs have already passed the period minimum. Such objects are called “period bouncers”. The secondary masses of the period bouncers are below the substellar limit. Their q and mass-transfer rates are thus extremely low as compared with DNe before the period minimum. Empirically, we know many objects around the period minimum show WZ Sge-type super-outbursts. These facts imply that most of DNe are WZ Sge stars. However, the number of WZ Sge stars is much smaller than that of SU UMa ones. The gap between the theory and observation can be caused by the observational bias because WZ Sge stars are fainter and their outburst intervals are longer in comparison to SU UMa ones. Thus, it is important to dig up the hidden WZ Sge stars. In addition, there are some unsolved problems in WZ Sge stars, e.g., the detailed mechanism of early superhumps or rebrightenings. The increasing number of WZ Sge stars will give us more opportunities to observe such phenomena.
We report on the outburst and classification of ASASSN-14dx. The outburst was detected at V = 13.95 on 2014 June 25 by the All-Sky Automated Survey for Supernovae (ASAS-SN) (Shappee et al. 2014). The coordinates are RA |$= {02^{\rm h}34^{\rm m}27{^{\rm s}_{.}}73}$| and Dec |$= -04^{\circ }{54^{\prime }30{^{\prime\prime}_{.}}7}$| at J2000.0. The Sloan Digital Sky Survey (SDSS) magnitudes are u = 16.42, g = 16.26, r = 16.37, i = 16.55, and z = 16.63 (Ahn et al. 2012). The object is an XMM-Newton source and has a GALEX counterpart with near-UV (NUV) and far-UV (FUV) magnitudes of 16.4 and 16.6 (Martin et al. 2005). The spectra were obtained in 2014 August (Kaur et al. 2014) and in 2014 October (Thorstensen et al. 2016). The authors reported double-peaked emission lines with broad and narrow absorption ones on a blue continuum, and thus the object was confirmed as a CV. Since follow-up photometries by our group and Hardy et al. (2017) reported the superhump-like modulations, the object was initially classified as an SU UMa star. Hardy et al. (2017) confirmed that the object does not show any eclipses. On the basis of our light curve analyses and new classification method by using Gaia DR2 (Gaia Collaboration et al. 2016, 2018a), we propose that ASASSN-14dx is a WZ Sge star rather than an SU UMa one.
2 Observation and analysis
Our time-series observations are summarized in table E1.1 The data were acquired by time-resolved unfiltered CCD photometry using 30–40 cm class telescopes by the VSNET Collaboration (Kato et al. 2004). The times of the observations were corrected to Barycentric Julian Date (BJD). We adjusted the zero-point of each observer to Franz-Josef Hambsch’s data.
We used the phase dispersion minimization (PDM) method for analyzing the periodic modulations. We estimated 1σ errors by using the methods in Fernie (1989) and Kato et al. (2010). Before our period analyses, we subtracted the global trend of the light curve which was calculated by using locally weighted polynomial regression (LOWESS: Cleveland 1979).
3 Results
3.1 Overall light curve
Figure 1 shows the overall light curve of ASASSN-14dx. The light curve also includes the public data of the Catalina Real-Time Transient Survey (Drake et al. 2009) and ASAS-SN Sky Patrol (Shappee et al. 2014; Kochanek et al. 2017). Before the outburst, the object was stable around V = 16.36 mag. The outburst was detected at V = 13.95 mag on 2014 June 25 (BJD 2456833), then the object gradually decreased to V ∼ 15.7 mag until 2018. Such a small-amplitude and long-duration outburst is very unusual for DN outbursts.
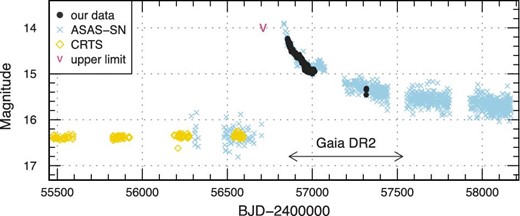
Overall light curves of ASASSN-14dx. Filled circles, crosses, open diamonds and the “V”-mark represent our observations, the ASAS-SN data, the CRTS data, and the upper limit, respectively. Our time-series observations were binned to 0.01 d. The observation period of Gaia DR2 is indicated by the arrows. (Color online)
We found an upper limit of 14.0 mag on 2014 February 22 (BJD 2456710) indicated in figure 1 by a “V”-mark. After this observation, we do not have any data until the outburst detection due to seasonal reasons, and so there is a long observational gap of 123 d. This gap implies that we missed the initial phase of the outburst and that this outburst is just a “fading tail”.
A fading tail is a well-known phenomenon seen after WZ Sge-type super-outbursts. Specifically, Kuulkers et al. (2011) reported the moderate declines of WZ Sagittae after the end of the super-outbursts plateau. The brightness just after the super-outbursts is about 0.5 mag brighter than in quiescence. They proposed that the decline can be caused by the development of a cavity in the inner disk and that the time scale is about a decade. For another example, SSS J122221.7−311523 (hereafter J1222) showed a fading tail lasting at least 500 d and the brightness just after the super-outburst is about 3 mag brighter (Neustroev et al. 2017). The outburst profile of ASASSN-14dx is in good agreement with those observations rather than ordinary outbursts.
3.2 Double-wave modulations
During the outburst, the object showed persistent double-wave modulations. The result of the period analysis of our observations in BJD 2456854.82–2457014.09 is indicated in figure 2. The estimated period is 0.0575054(4) d. The interval of two peaks is nearly 0.5 phase. Since the modulations were initially interpreted as superhumps, the object was classified as an SU UMa-type DN (cf. vsnet-alert 17598, Hardy et al. 2017).

Results of the period analyses of orbital modulations in quiescence (BJD 2453627.89–2456591.85) (left) and outburst (BJD 2456854.82–2457014.09) (right). Upper: θ diagram of our PDM analysis of superhumps. The shaded area means 1σ errors. Lower: Phase-averaged profiles of orbital modulations. The zero phases were defined to be BJD 2456945.8837, which is the time of the inferior conjunction obtained by Thorstensen, Alper, and Weil (2016). (Color online)
4 Discussion
4.1 Orbital modulations
The left-hand panel of figure 2 shows the period analysis of the CRTS data in quiescence (BJD 2453627.89–2456591.85). We reported a weak signal of a possible orbital period of 0.0575060(2) d (vsnet-alert 18017). Thorstensen, Alper, and Weil (2016) estimated the orbital period to be 0.05756(6) d from Hα radial velocities via spectroscopy, and they confirmed that this value is consistent with our result. These values are close to the period detected during the outburst of 0.0575054(4) d. The averaged profiles are also similar to each other (the lower panels in figure 2). Thus we propose that the modulations in the outburst are not superhumps but orbital modulations. We adopted the period in quiescence of 0.0575060(2) d as the orbital one because of the small error and the long baseline of the data.
WZ Sge-type DNe, especially in high-inclination systems, often show double-wave orbital modulations in quiescence or a fading tail (e.g., Patterson et al. 1996). Skidmore et al. (2000) investigated the disk structure of WZ Sagittae in quiescence from the Doppler mapping. They found that the bright spot exists along the ballistic trajectory, and considered that a low-density disk allows an accretion stream to penetrate and thus can explain double-wave modulations originating from a change of the line-of-sight. Kononov et al. (2015) simulated the humps of WZ Sge stars by using the three-dimensional computation. They proposed that a spiral density wave and four kinds of shocks can cause such modulations. Because the density wave undergoes a slow retrograde precession in the observer’s frame and the interaction between the density wave and four shocks generates the modulations, they succeeded in reproducing the profile variations and phase shifts of humps, which are sometimes seen in WZ Sge stars. Note that the period of such humps can be shorter than the orbital one in a strict sense. The modulations of ASASSN-14dx could also be explained by these mechanisms.
The estimated period of ASASSN-14dx in the outburst is very slightly shorter than that in quiescence. According to the thermal instability model, a disk after an outburst gradually shrinks due to the accreting mass (cf. Osaki 1989). Shrinkage of a disk could lead to a phase shift of the modulations, e.g., a shift of the position of the bright spot. In principle, we cannot discriminate between a continuous phase shift and a period variation. On the other hand, the model of Kononov et al. (2015) can account for the shorter period owing to the change of the precession rate of the density wave. The small difference in the periods might be caused by these varying disk structures.
We drew the averaged profiles of orbital modulations (the lower panels of figure 2). We estimated the time of the inferior conjunction, means that the secondary star is located between the primary star and the Earth to be BJD 2456945.8837(7) on the basis of the time-resolved spectroscopies obtained by Thorstensen, Alper, and Weil (2016), and we defined the zero phases to be BJD 2456945.8837. For the purpose of understanding the mechanism of the humps, it may be worth mentioning that both of the peaks of the modulations are close to the conjunction. However, we must note that the time of the conjunction is estimated by using the disk emissions, whose light source is unclear. Therefore this value has an uncertainty, and we need to observe lines from the secondary star to obtain the accurate time of the conjunction. The lower panels of figure 2 suggest that the phases of the peaks in quiescence and outburst are respectively −0.06(2) and 0.08(1), namely the object showed a phase shift of 0.14(2). Note that the folding periods are different from each other. However, even if we fold the light curve in outburst by using the period in quiescence, the phase is little varied (less than 0.01 phase). It may be difficult to explain the large shift only by a simple bright spot and shrinking disk, while the model of Kononov et al. (2015) can explain it on the basis of the retrograde-precession density wave.
4.2 Classification by Gaia DR2
In order to distinguish WZ Sge stars from SU UMa ones, we investigated the known DNe of the Gaia DR2. By using the parallaxes ϖ and three broad-band optical magnitudes (white light G, blue GBP, and red GRP) provided by the Gaia, we can estimate the absolute Gaia magnitudes MG and Gaia colors Gcol = GBP − GRP (Luri et al. 2018; Riello et al. 2018; Evans et al. 2018). Although the Gaia team has already studied the color–absolute magnitude diagram of variable stars (Gaia Collaboration et al. 2018c), we concentrated more on the subclasses of DNe. The CV evolutionary track computed by Knigge, Baraffe, and Patterson (2011) shows that absolute magnitudes become fainter and that the colors become bluer as CVs evolve. Actually, we can see WZ Sge-type DNe lying on the bluer area in the color–color diagram of the SDSS (Kato et al. 2012a). Furthermore, it is considered that MG depends also on the mass-transfer rates from secondaries, i.e. the brightness of bright spots and disks (cf. Dubus et al. 2018).
We identified known SU UMa/WZ Sge-type DNe with the Gaia DR2 sources. The list of known DNe was taken from the International Variable Star Index (VSX) of the American Association of Variable Star Observers (AAVSO).2 We only used objects whose ϖ errors are within 20%. The galactic extinctions in the V and B bands (AV and AB) for each object were obtained from the NED (Schlafly & Finkbeiner 2011).3 Because the galactic extinctions are affected by the positions of the objects, we estimated the effects by using equation (2) in Ak et al. (2008), the distances d calculated from ϖ, and the assumed scale height for the interstellar dust H = 100 pc. Then we converted AV and AB to the extinctions in Gaia magnitudes (AG, ABP, ARP) on the basis of equation (1) and table 1 in Gaia Collaboration et al. (2018b). Eventually, we used the corrected absolute magnitudes MG0 = MG − AG, de-reddened colors Gcol0 = Gcol − (ABP − ARP), and Porb for the statistics. We note that the effects of galactic extinction have large uncertainties and are sometimes neglected (e.g., Gaia Collaboration et al. 2018c). Thus we removed the objects with large extinctions AG > 0.5 in our statistics to suppress the uncertainty.
List of nearby WZ Sge-type DNe.
| Object | d* (pc) | G † (mag) | ||
|---|---|---|---|---|
| ASASSN-14dx | 80.8 [80.6, 81.1] | 15.0 | ||
| WZ Sge | 45.1 [45.0, 45.2] | 15.2 | ||
| V455 And | 75.4 [75.1, 75.7] | 16.1 | ||
| BW Scl | 94.2 [93.3, 95.0] | 16.3 | ||
| V627 Peg | 99.4 [98.8, 100.1] | 15.7 | ||
| GW Lib | 112.5 [111.4, 113.5] | 16.5 | ||
| EZ Lyn | 145.3 [142.1, 148.6] | 17.8 | ||
| V355 UMa | 149.6 [147.7, 151.5] | 17.4 | ||
| FL Ps | 153.1 [150.0, 156.3] | 17.5 | ||
| V406 Vir | 168.8 [164.5, 173.3] | 17.7 | ||
| PNV J1714‡ | 176.9 [172.5, 181.6] | 17.2 | ||
| EG Cnc | 184.9 [175.0, 195.9] | 18.8 | ||
| QZ Lib | 189.2 [178.0, 201.9] | 18.9 | ||
| V1838 Aql | 201.6 [195.0, 208.7] | 17.9 | ||
| 1RXS J0232‡ | 206.9 [198.8, 215.8] | 18.7 | ||
| OV Boo§ | 210.5 [204.4, 216.9] | 18.2 | ||
| V624 Peg | 217.7 [204.1, 233.2] | 18.4 | ||
| TCP J1815‡ | 220.0 [208.6, 232.7] | 19.2 | ||
| SSS J1222‡ | 239.8 [220.5, 262.8] | 18.9 | ||
| PNV J0309‡ | 246.6 [230.8, 264.6] | 18.7 | ||
| ASASSN-14cl | 261.2 [248.9, 274.9] | 18.2 |
*Distance estimated by using the parallax ϖ in Gaia DR2 and the method of Bailer-Jones et al. (2018). The left-hand values are the medians of the distance probability distributions, and the right-hand values in the brackets are the 16th and 84th percentiles.
† G magnitude in Gaia DR2.
‡PNV J1714 = PNV J17144255−2943481, 1RXS J0232 = 1RXS J023238.8−371812, TCP J1815 = TCP J18154219+3515598, SSS J1222 = SSS J122221.7−311523, PNV J0309 = PNV J03093063+2638031.
§Population II CV below the period minimum which showed a WZ Sge-type super-outburst.
Figure 3 shows the density distributions of MG0 and Gcol0. Hatched and shaded boxes represent SU UMa and WZ Sge stars, respectively. As expected by previous studies, WZ Sge stars are basically fainter and bluer. These features can give the interpretations that the mass-transfer rate is lower and that the WD’s contribution to the color is more important in WZ Sge stars. The upper panel implies that there is a lower limit of MG0 ∼ 10.5, as for WZ Sge stars. This fact is consistent with the interpretation of early superhumps by the TTI model. In other words, a low mass-transfer rate is needed to accumulate enough mass at the onset of an outburst to trigger the 2:1 resonance (Osaki 1995).
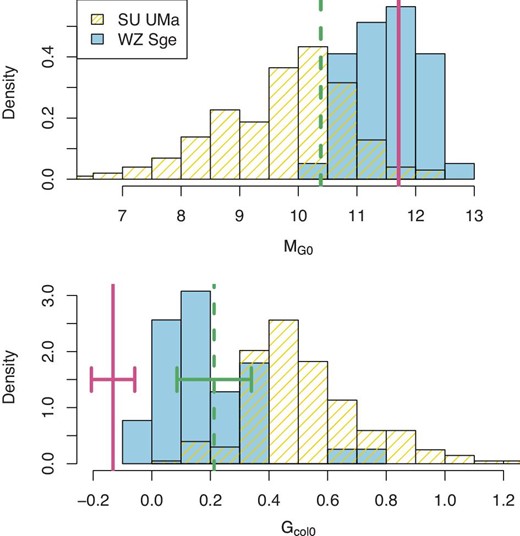
Density distributions of corrected absolute Gaia magnitudes MG0 (upper) and Gaia colors Gcol0 (lower). Hatched and shaded boxes represent SU UMa and WZ Sge-type DNe, respectively. Solid and dashed vertical lines indicate ASASSN-14dx in the SDSS (quiescence) and Gaia DR2 (outburst), respectively. The error bars of ASASSN-14dx are shown only in the lower panel because of the large errors. We removed three WZ Sge-type DN candidates mentioned in subsection 4.3. (Color online)
ASASSN-14dx is indicated by the dashed line in figure 3. Its position is a little far from other WZ Sge-type objects. The reason is that Gaia obtained the data during the outburst as indicated in figure 1. In order to estimate the Gaia magnitudes in quiescence, we converted the SDSS magnitudes, which were observed before the outburst, to Gaia ones using table A.2 in Evans et al. (2018). Then, we obtained the quiescent values of MG0 = 11.711(43) and Gcol0 = −0.112(74) indicated by solid lines in figure 3. This figure gives the impression that ASASSN-14dx is indeed a WZ Sge-type DN.
Figure 4 shows the relations between MG0 and Porb (upper panel), and MG0 and Gcol0 (lower panel). The filled squares, circles, and star represent SU UMa, WZ Sge-type DNe, and ASASSN-14dx in quiescence, respectively. The triangles indicate new WZ Sge-type DN candidates discussed in subsection 4.3. We removed them from our statistics. Three WZ Sge-type stars around Porb ∼ 0.076 d are two long-Porb WZ Sge stars (RZ Leo and ASASSN-16eg) and one period bouncer, J1222. Wakamatsu et al. (2017) interpreted the long-Porb WZ Sge stars as borderline objects between SU UMa and WZ Sge-type DNe, which have low mass-transfer rates in spite of their high mass ratios. They are indeed fainter than other SU UMa stars that have similar Porb values. On the other hand, their colors are redder in comparison with the other WZ Sge stars (see two objects with Gcol0 of 0.6–0.8 in the lower panels of figures 3 and 4).
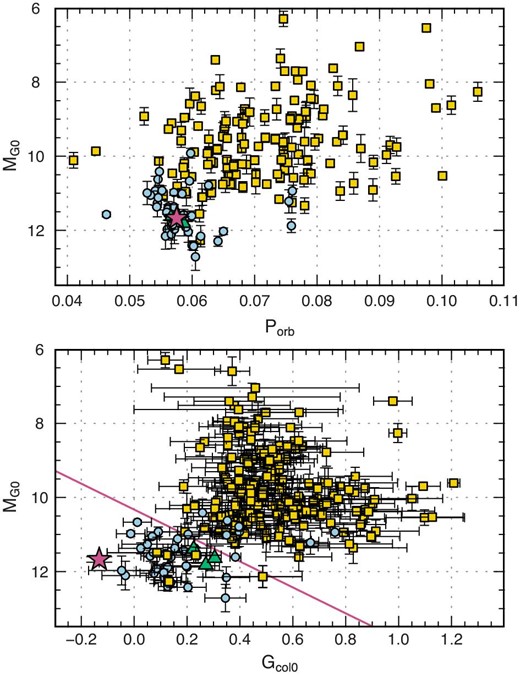
Corrected absolute Gaia magnitude MG0 versus orbital period Porb (upper) and Gaia color Gcol0 (lower). Regarding WZ Sge-type DNe whose orbital periods are unknown, we estimated the orbital periods from the superhump periods and equation (6) in Kato et al. (2012b). The filled squares, circles, and stars represent SU UMa, WZ Sge-type DNe, and ASASSN-14dx, respectively. Three WZ Sge star candidates mentioned in subsection 4.3 are shown by filled triangles. The solid line in the lower panel indicates PWZ = 0.5, which represents the borderline between SU UMa and WZ Sge stars. (Color online)
We estimated PWZ for each object including large-AG objects, and summarize the results in tables E2 and E3.1PWZ of ASASSN-14dx is 0.21(14) in the Gaia DR2 (outburst) but 0.97(1) in the SDSS (quiescence). Our new classifier also suggests that ASASSN-14dx is the best candidate of a WZ Sge star. We evaluated the validity of the PWZ = 0.5 method. This method correctly classified 32 in 41 WZ Sge stars and 219 in 225 SU UMa ones. Whereas, the |$P^{\prime }_{\rm WZ}=0.5$| method succeeded in classifying 30 WZ Sge ones and 220 SU UMa ones. However, some WZ Sge stars could be classified as SU UMa ones due to the lack of data. Intensive observations for high-PWZ systems will improve our classification method.
4.3 Exploration of WZ Sge-type DN candidates
We concluded that the following three objects are good candidates of WZ Sge-type DNe on the basis of PWZ and the modern criteria provided in Kato (2015).
PNV J19321040-2052505
The estimated PWZ is 0.63(18). This object was detected on 2017 November 11 by H. Nishimura.5 A follow-up observation confirmed a possible signal of superhumps, and hence the object was classified as an SU UMa-type DN (vsnet-alert 21694). According to ASAS-3 data, the object showed an outburst in 2003 (Pojmański 2002). The duration of the outburst was longer than 27 days and the outburst amplitude was large (∼8 mag). These values strongly suggest that the object is a WZ Sge-type DN.
CRTS J200331.3-284941
The estimated PWZ is 0.74(19). The ordinary superhumps were detected in the 2015 outburst. Kato et al. (2016) speculated that this object can be a WZ Sge-type DN on the basis of the low mass ratio of 0.084(1), the long duration of growing (stage A) superhumps (more than 50 cycles), the fading tail like WZ Sge-type DNe, and the long observational gap.
ASASSN-17kg
The estimated PWZ is 0.62(17). This object was detected on 2016 July 31 by the ASAS-SN and the last observation before the detection was on July 27 (Shappee et al. 2014). The follow-up observation on August 3 detected growing superhumps (vsnet-alert 21326). In other words, there was an observational gap of seven days. Although the typical duration of the early superhump stage is 10 d or more (Kato 2015), table 9 in Nakata et al. (2013), which listed the durations of the early superhump stages of well-observed WZ Sge-type DNe, shows the minimum duration is 5 d.This fact suggests that the observational gap of one week could conceal the early superhump phase. Moreover, the object showed one rebrightening after the super-outburst (vsnet-alert 21360). We thus concluded that this object is a WZ Sge-type DN candidate.
Other SU UMa stars with a long observational gap could also be WZ Sge ones. In future, we should pay attention to high-PWZ objects in order not to miss the early superhump phase. Note that there are some unusual WZ Sge stars. It may be difficult to discover them on the basis of PWZ. Although AL Com was considered to be a typical WZ Sge star, the object showed SU UMa-type super-outburst in 2015 (Kimura et al. 2016). The estimated PWZ of 0.11(19) is indeed low (we removed AL Com from our statistics due to the large error of ϖ). As mentioned in subsection 4.2, the long-Porb WZ Sge stars (RZ Leo, ASASSN-16eg, and BC UMa) have large Gcol0, and hence their PWZ values are less than 0.15. In addition, the Gaia DR2 data are possibly contaminated by outbursts, eclipses and so on like ASASSN-14dx. Therefore, a complete classification based on the Gaia data may be essentially difficult.
4.4 Distances of WZ Sge-type DNe
We calculated the probability distributions of the distances d of known WZ Sge stars by using the Gaia parallaxes ϖ and the method of Bailer-Jones et al. (2018), which assumes a Galaxy model. We obtained the median values and the 16th and 84th percentiles of the distributions. Those of nearby object are listed in table 1. ASASSN-14dx seems to be the third-nearest WZ Sge-type DN. This fact suggests that the super-outburst maximum of ASASSN-14dx can reach V = 8–9 mag. Thus ASASSN-14dx is one of the best targets for the observational research of WZ Sge-type DNe.
5 Summary
Although ASASSN-14dx was classified as an SU UMa-type DN due to the long observational gap, the object is likely to be the best candidate of a WZ Sge-type judging from the outburst behavior, Gaia absolute magnitude, and Gaia color. The double-wave modulations observed in the outburst seem to be orbital modulations, are often seen in WZ Sge stars, rather than superhumps. The estimated distances of known WZ Sge stars indicate that ASASSN-14dx is the third-nearest WZ Sge star and that the super-outburst maximum of ASASSN-14dx can reach V = 8–9 mag. ASASSN-14dx is one of the best targets for observational research of WZ Sge stars because such a bright object will give us high signal-to-noise ratio data.
We examined a new classification method of WZ Sge/SU UMa-type DNe based on the Gaia DR2. The logistic regression model provided the probability of WZ Sge-type DNe PWZ. We proposed PWZ = 0.5 as a classifier which correctly identified 32 in 41 WZ Sge stars and 219 in 225 SU UMa ones. A sample R code to estimate PWZ and the galactic extinctions is provided on our website.4 The next Gaia data release and further observational studies to increase the statistics will improve our classification method. Our classifier will be a powerful tool to judge a priority target.
Supplementary data
Tables E1, E2, and E3.
Acknowledgements
This work was supported by the Grant-in-Aid for Japan Society for the Promotion of Science (JSPS) Fellows (No. 17J10039). This work was also partially supported by the Grant-in-Aid “Initiative for High-Dimensional Data-Driven Science through Deepening of Sparse Modeling” (25120007) from the Ministry of Education, Culture, Sports, Science and Technology (MEXT) of Japan. We are grateful to the survey projects CRTS and ASAS-SN. This work has made use of data from the European Space Agency (ESA) mission Gaia (https://www.cosmos.esa.int/gaia), processed by the Gaia Data Processing and Analysis Consortium (DPAC, https://www.cosmos.esa.int/web/gaia/dpac/consortium). Funding for the DPAC has been provided by national institutions, in particular the institutions participating in the Gaia Multilateral Agreement. This research has made use of the NASA/IPAC Extragalactic Database (NED), which is operated by the Jet Propulsion Laboratory, California Institute of Technology, under contract with the National Aeronautics and Space Administration. We are also thankful to the AAVSO International Database contributed by many worldwide observers.
Footnotes
Tables E1– E3 are available online as the supplementary data for this article.
The NASA/IPAC Extragalactic Database (NED) is operated by the Jet Propulsion Laboratory, California Institute of Technology, under contract with the National Aeronautics and Space Administration.
References
