


Abstract
Employing the high spatio-temporal Interface Region Imaging Spectrograph 1330 Å observations, we investigated the jet-like features that occurred during the X8.2 class flare in NOAA active region (AR) 12673 on 2017 September 10. These jet-like features were rooted in the flare ribbons. We examined 15 features, and the mean values of the lifetimes, projected widths, lengths, and velocities of these features were 87 s, 890 km, 2.7 Mm, and 70 km s−1, respectively. We also observed many jet-like features which happened during the X1.0 class flare on 2014 October 25. We studied the spectra at the base of a jet-like feature during its development. The Fe xxi 1354.08 Å line in the corona displays blueshift, while the Si iv 1402.77 Å line in the transition region exhibits redshift, which indicates the chromospheric evaporation. This is the first time that the jet-like features are reported to be rooted in the flare ribbons, and we suggest that these jet-like features were driven by the mechanism of chromospheric evaporation.
1 Introduction
Solar X-ray jets, extreme-ultraviolet (EUV) jets, and surges are similar plasma eruptions that are magnetically rooted in the photosphere and ejected into the corona along open magnetic field lines (e.g., Shibata et al. 1994; Yokoyama & Shibata 1995; Raouafi et al. 2016). Solar jets have been extensively studied in many wavelengths, e.g., Hα (Schmieder et al. 1995; Li et al. 2015), ultraviolet (UV: Chen et al. 2008), EUV (Jiang et al. 2007; Innes et al. 2016), X-ray (Zhang et al. 2000), and white light (Moore et al. 2011).
Solar jets are ubiquitous transient features occurring in various solar environments, such as coronal holes (Yang et al. 2011; Chen et al. 2012), active regions (ARs: Shimojo et al. 1996) and quiet regions (Hong et al. 2011; Panesar et al. 2016). Sometimes, jets are observed to be associated with filament eruptions (Moore et al. 2010; Sterling et al. 2015), coronal mass ejections (CMEs: Shen et al. 2012), and flares (Wang & Liu 2012).
The unceasing advances made on spatial and temporal resolution of data obtained by different space missions have enriched our understanding of different observational processes and numerical investigations behind solar jets. However, the underlying driving mechanisms of solar jets have not been understood completely. A generally accepted driving mechanism for jets is magnetic reconnection between emerging magnetic fluxes and ambient magnetic fields (e.g., Canfield et al. 1996; Zhang & Zhang 2017), which sometimes is also accompanied by magnetic cancellation (Young & Muglach 2014). Furthermore, simulation works furnish evidence that coronal jets can be generated by the mechanism of chromospheric evaporation (Shimojo et al. 2001; Miyagoshi & Yokoyama 2003).
There are also many small-scale plasma eruptive phenomena such as macrospicules and chromosphere dynamic structures like spicules and mottles. These jet-like structures are thought to be different scale jets or manifestations in different wavelengths of the jet phenomenon (e.g., De Pontieu et al. 2011; Tsiropoula et al. 2012). In this paper, exploring the X8.2 flare produced in AR 12673 and the X1.0 class flare in AR 12192, we reported the jet-like features rooted in the flare ribbons for the first time.
2 Observations and data analysis
We adopted the observations from the Helioseismic and Magnetic Imager (HMI: Scherrer et al. 2012; Schou et al. 2012) and the Atmospheric Imaging Assembly (AIA: Lemen et al. 2012) on board the Solar Dynamics Observatory (SDO: Pesnell et al. 2012). The HMI full-disk line-of-sight magnetograms with the pixel size of 0|${^{\prime\prime}_{.}}$|5 and the cadence of 45 s were employed. AIA gives full-Sun images with high spatial resolution (0|${^{\prime\prime}_{.}}$|6 pixel−1, ∼430 km) and high temporal cadence (12/24 s) in seven EUV wavelength bands and three UV-visible channels. On 2017 September 10, we used the AIA 94 Å, 131 Å, 171 Å, 193 Å, and 304 Å images, which have strong responses to logarithmic temperatures (Kelvin) of about 6.8, 7.0 (and 5.6), 5.8, 6.2, and 4.7, respectively, from 15:30 UT to 16:30 UT to study the jets occurring during the X8.2 flare.
The Interface Region Imaging Spectrograph (IRIS: De Pontieu et al. 2014) satellite provides simultaneous spectral and imaging observations of the solar atmosphere. For the X8.2 class flare on 2017 September 10, we obtained a series of IRIS slit-jaw 1330 Å images taken from 12:59:47 UT to 19:23:38 UT with a pixel scale of 0|${^{\prime\prime}_{.}}$|333, a cadence of 9 s, and a field of view (FOV) of 119′ × 119′. The 1330 Å channel contains emission from the strong C ii 1334/1335 Å lines formed in the chromosphere and lower transition region as well as the continuum from the photosphere and lower chromosphere. For the X1.0 class flare on 2014 October 25, we obtained the IRIS slit-jaw 1330 Å images with a cadence of 16 s and a pixel scale of 0|${^{\prime\prime}_{.}}$|333. We also employed the IRIS spectral profiles of two windows at “C ii 1336” and “Si iv 1394” with a cadence of 5 s.
3 Results and discussion
3.1 The X8.2 flare on 2017 September 10
From 2017 September 4 to 10, AR 12673 produced four X-class, 27 M-class and plenty of lower-class flares, becoming the most actively flaring region of Cycle 24 (Yang et al. 2017). On September 10, an X8.2 class flare occurred in this AR. This X8.2 class flare started at 15:35 UT and reached its peak at 16:06 UT. Using the AIA 171 Å observations [see panels (a1)–(a4) of figure 1 and movie 11], we observed numerous jet-like features at the south side of this flare. At 15:55 UT, these small scale jet-like features began to occur. Along with the development of the flare, the jets appeared farther south in succession since 16:09 UT, with an average spreading speed of ∼45 km s−1. Two obvious jet-like features [labelled as “1” and “2” in panel (a2)] are displayed. These features emerged, rapidly grew, and had apparent velocities of 192 km s−1 and 212 km s−1 in 171 Å, respectively. The apparent velocity here is the speed of the propagating intensity front of the feature. The lengths of the two features were both more than 9 Mm. The red arrows in panels (a3)–(a4) denote the post-flare loops in the 171 Å observations. As the post-flare loops showed up, the jet-like features rooted in the footpoints of these loops faded away [see panel (a4)]. These jet-like features are also distinct on the other AIA wavelength images. Panels (b1)–(b2) and (d1)–(d2) are the AIA 193 Å and 304 Å images displaying the development of the features “1” and “2”, individually. Panels (b1) and (d1) show the situation prior to the feature onset. The green and blue arrows point to the places where the features occurred. Panels (b2) and (d2) display the manifestations of these two features. The trajectories of feature “1” are indicated by the green triangular symbols. The apparent velocity of feature “1” was 172 km s−1 in 193 Å and 184 km s−1 in 304 Å. The blue diamond symbols reveal the path of the feature “2”. In 193 Å, the velocity was 196 km s−1, and in 304 Å, feature “2” had a apparent velocity of 207 km s−1. Panels (c1)–(c2) and (e1)–(e2) show the development of the feature “3” at 94 Å and 131 Å wavelengths, respectively. The red arrows illustrate the position of feature “3”, the red symbols display the trajectories of this feature, and the apparent velocities are 72 km s−1 in 94 Å and 64 km s−1 in 131 Å.
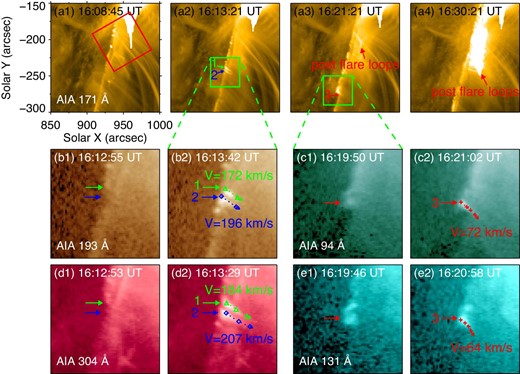
(a1)–(a4): AIA 171 Å images showing the flare and jet-like features on 2017 September 10. The red square in panel (a1) outlines the FOV of figure 2. (b1) and (b2): AIA 193 Å images displaying the development of two jet-like features which is pointed out by the green and blue arrows. (d1) and (d2): Evolution of same two features as shown in panels (b1) and (b2) using AIA 304 Å images. The green triangular symbols and the blue diamond symbols indicate the trajectories of these two features. Panels (c1)–(c2) and (e1)–(e2) are AIA 94 Å images and 131 Å images displaying the development of a jet-like feature which is marked by the red arrows, respectively. The red symbols display the trajectories of this feature. An animation of this figure (movie 1) is available online as supplementary data.
IRIS also observed lots of jet-like features rooted in the flare ribbons (see movie 21) and the FOV of IRIS is delineated by the red square in figure 1(a1). Figures 2(a1)–2(a6) display the development of these jet-like features observed in IRIS 1330 Å. At 15:38 UT, small scale jet-like features [marked by the arrow in panel (a1)] started to occur. From 15:52 UT to 15:58 UT, the jet-like features on a flare ribbon brightened up successively, as indicated by the arrows in panels (a2)–(a4). The second ribbon can also be observed since 15:58 UT, and there were a lot of jet-like features rooted in the both flare ribbons as shown in panel (a5). After 16:23 UT, there was cold material which started to condense at the top of the loops and dropped to the footpoints, identifying the structures of the post-flare loops. Since the condensation showed up, these jet-like features located on the flare ribbons began to disappear [see panel (a6)]. To estimate the number of the jet-like features, we studied the brightness along the positions identified by slice “A–B” in panel (a4). The trend value is estimated using the single Gaussian fitting. Figure 2(b) displays the result of brightness minus the trend value. The background value was about 1000 digital number (DN) pixel−1, and we defined that a feature’s brightness exceeded a quarter of the background brightness. Therefore, there existed 28 jet-like features whose exceeded brightness was over 250 DN pixel−1 [the blue line in panel (b)] on the 41-Mm-length area. We estimate the number of jet-like features, and its variation during the flare is presented in panel (c) with the cross symbols. The curve displays the variation of the GOES soft X-ray 1–8 Å flux, and the start and peak times of the flare are indicated by the blue dotted lines. The jet-like features occurred after the flare began, and the number of jets increased. After the peak of the flare, the number of the jet-like features decreased and then disappeared.
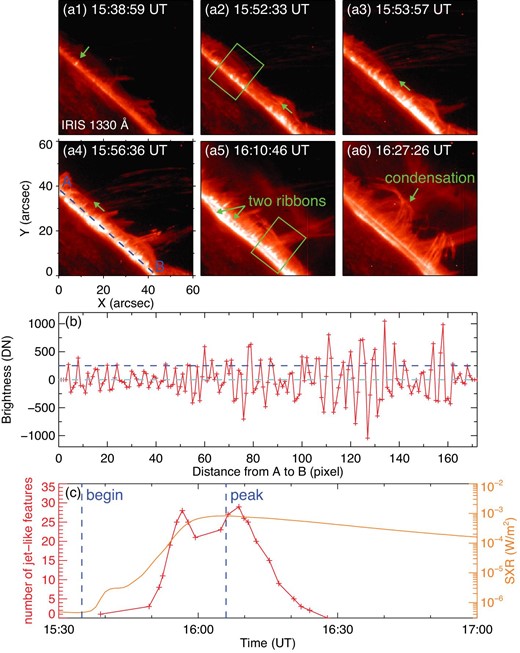
(a1)–(a6): IRIS 1330 Å images displaying the development of the jet-like features rooted in the flare ribbons. The arrow in panel (a1) denotes the position where the brightening first occurred and the arrows in panels (a2)–(a4) indicate the propagating of the ribbons. The rectangle in panel (a2) outlines the FOV of figures 3(a1)–3(a4) and the rectangle in panel (a5) outlines the FOV of figures 3(b1)–3(b4). (b): Brightness above the mean value across the slice “A–B” in panel (a4). (c): Variations of the number of the jet-like features during the flare presented by the cross symbols. The curve displays the variation of the GOES soft X-ray 1–8 Å flux and the dashed lines indicate the begin and peak time of the flare. An animation of this figure (movie 2) is available online as supplementary data. (Color online)
Figure 3 displays the evolution of two jet-like features observed in IRIS 1330 Å images. The blue arrows in the upper/lower panels point out the positions of the first/second feature we focus on. The first jet-like feature occurred at the area outlined by the rectangle in figure 2(a2), which began at 15:59:52 UT, rose up from the limb and then fell back. During its rising stage, the feature had a apparent velocity of 44 km s−1. The feature had a maximum width of 1040 km, and lasted for about 140 s. At 16:09:59 UT, the second feature took place in the area delineated by the rectangle in figure 2(a5). It ejected upward, fell back, and then disappeared at 16:10:55 UT. The width of the second feature was about 820 km, and the feature had a apparent velocity of 116 km s−1.
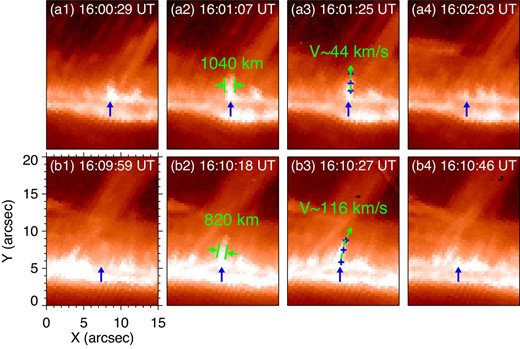
IRIS 1330 Å images displaying the evolutions of two jet-like features. The bottom arrows denote the positions of the two features. The crosses in panels (a3) and (b3) indicate the trajectories of the bright points which we track to determine the velocities of these features. (Color online)
We analyzed the properties of 15 isolated jet-like features. The lifetimes of the jet-like features were 56–184 s, with the mean value of 87 s. The widths of the jet-like features were between 670 and 1340 km, and the lengths of the jet-like features were 2.0–3.8 Mm. All these features went upward and had apparent velocities of 28–116 km s−1. Through statistics, the mean values of width, length, and velocity of the jet-like features were 890 km, 2.7 Mm, and 70 km s−1, respectively. The IRIS observed the flare ribbon with a length of 51 Mm, and the occurrence of the jet-like features lasted for about 20 min. Since there were 28 jet-like features on a 41 Mm length flare ribbon and the mean lifetime of jet-like features was 87 s, we can estimate that there arose approximately 480 jet-like features in the IRIS observations.
The jet-like features rooted in the flare ribbons are reported for the first time. The temporal and spatial relationships between the jet-like features and flare suggest that these jet-like features may possess a different driving mechanism, which is related to the onset of the two-ribbon flare. According to the standard model of two-ribbon flares (Forbes 2010; Fletcher et al. 2011), magnetic reconnection releases energy, and this energy accelerates non-thermal particles and heats the plasma near the reconnection site. The combination of the thermal conduction and particle beams transport the energy to the chromosphere through the relatively tenuous corona, stopping in the cooler, dense plasma. When the energy input to the chromosphere exceeds what can be shed by radiative and conductive losses, chromospheric material is heated rapidly up to a temperature on the order of 10 MK. The overpressure associated with the chromospheric heating will drive the heated plasma upward to fill the flare loops (Priest & Forbes 2002). The evaporation upflows are often from the outer edges of the flare ribbons, which may make it look as though the evaporation upflows are rooted in the flare ribbons.
This flare was located at the solar west limb, so we could directly observe the vertical motions of the jet-like features against the solar surface. These jet-like features were rooted in the flare ribbons and could be recognised using the AIA EUV wavelengths. The velocities of jet-like features were 28–116 km s−1 with the mean value of 70 km s−1, consistent with previous IRIS spectroscopic observations in which the velocities of evaporation upflows are mostly around 100 km s−1 or smaller (e.g., Zhang et al. 2016; Li et al. 2017). Combining these observations with the theory, we suggest that these jet-like features on the flare ribbon were driven by chromospheric evaporation.
3.2 The X1.0 flare on 2014 October 25
Previous works on chromospheric evaporation mostly rely on spectroscopic observations, since the best way to observe vertical flow in on-disk observations is spectroscopy. The spectral signature of chromospheric evaporation is the blueshift of hot emission lines, indicating the presence of hot and fast (from tens of km s−1 to several hundreds of km s−1) plasma upflows (Fisher et al. 1985; Tian et al. 2015). We checked more IRIS data to look for the events in which similar jet-like features occurred and the features were captured by the IRIS slit. During the X1.0 class on 2014 October 25, we found similar jet-like features. The X1.0 flare happened in AR 12192, which produced six X-class and 29 M-class flares from October 18 to 29. As shown in figure 4(a), this flare is a two-ribbon flare. The GOES soft X-ray 1–8 Å flux showed that the X1.0 flare initiated at 16:55 UT and reached its peak at 17:08 UT (see the green curve). The flare ribbons could also be observed using the IRIS 1330 Å slit-jaw images. During the rising stage of the flare, we observed several jet-like features at one ribbon of this flare, and two of them are displayed in figures 4(b1)–4(b2).
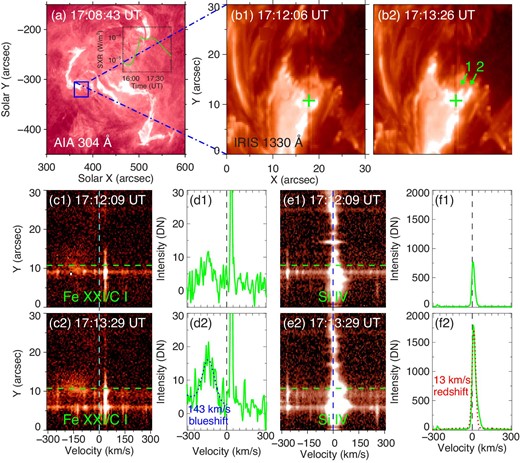
(a): SDO/AIA 304 Å images displaying the X1.0 class flare on 2014 October 25. (b1) and (b2): IRIS 1330 Å images displaying the evolution of two jet-like features. The plus symbols denote the positions where Doppler shifts are measured. (c1) and (c2) are simultaneous appearances of the Fe xxi 1354.08 Å spectra in the slit range of (b1) and (b2) for Doppler velocities from −310 km s−1 to 310 km s−1. (d1) and (d2) exhibit observed profiles (solid curves) at the selected locations in (c1) and (c2). The dotted line in (d2) represents the Gaussian fitting to the blueshifted Fe xxi 1354.08 Å feature. (e1) and (e2) display simultaneous appearances of the Si iv 1402.77 Å spectra in the slit range of (b1) and (b2) for Doppler velocities from −310 km s−1 to 310 km s−1. The solid curves in (f1) and (f2) are observed profiles at the selected locations in (e1) and (e2). The dotted line in (f2) exhibits the corresponding Gaussian fitting to the Si iv 1402.77 Å profile. An animation of this figure (movie 3) is available online as supplementary data. (Color online)
During the development of the jet-like feature “1”, it passed through the IRIS slit. At the base of the jet-like feature (marked by the green cross symbols), we employed the IRIS raster level 2 data, which have been dark-corrected, flat-fielded, and geometrically corrected, to measure the spectral information of this jet-like feature. The hot line of Fe xxi 1354.08 Å (log T ∼ 7.05) in the corona and the cool line of Si iv 1402.77 Å (log T ∼ 4.8) in the transition region were chosen to investigate chromospheric evaporation (De Pontieu et al. 2014; Tian et al. 2014). The nearby relatively strong neutral lines, “O i” 1355.5977 Å and “S i” 1401.5136 Å (Tian et al. 2015), were used for absolute wavelength calibration, respectively. As shown in figures 4(c1)–4(d2), there is significant enhancement at the blue side of the Fe xxi 1354.08 Å rest position. There are several neutral and singly ionized lines, i.e., the C i line at 1354.29 Å, the Fe ii lines at 1353.02 Å, 1354.01 Å, and 1354.75 Å, the Si ii lines at 1352.64 Å and 1353.72 Å, and some unidentified lines at 1353.32 Å and 1353.39 Å, are blended with the broad line of Fe xxi 1354.08 Å. However, these lines are narrow and cannot explain the bulk enhancement. This emission feature is likely due to the blueshifted Fe xxi line. The blueshift of the Fe xxi line became enhanced and more clear as the jet-like feature developed [∼143 km s−1, see panel (d2) and movie 31]. As shown in panels (e1) and (e2), the cool Si iv 1402.77 Å line exhibits obvious redshift, and the Doppler velocity relative to the background was about 13 km s−1 [see panels (f1) and (f2)]. Our results agree with the spectroscopic observations that explosive chromospheric evaporation is usually identified by high-speed blueshift (∼100–400 km s−1) in the hot lines from corona, and accompanied by chromospheric condensation which is distinguished by low-speed redshift (∼10–40 km s−1) in the cool lines from the upper chromosphere and the transition region (Doschek et al. 2013).
4 Conclusions
We explored the X8.2 class flare in AR 12673 on 2017 September 10. Using the SDO/AIA 171 Å observations, we discovered lots of jet-like features occurring in succession along with the development of the flare ribbons. The average spreading speed of these features was 45 km s−1, in accordance with the elongation velocity (ranging from 11 to 100 km s−1) of the flare ribbons (Fletcher et al. 2004; Qiu et al. 2017). The footpoints of these jet-like features were located on the flare ribbons and the apparent velocities of two most distinct jets were 153 km s−1 and 192 km s−1. These jet-like features could also be distinguished in other EUV wavelengths. Using the high spatio-temporal IRIS 1330 Å data, we also observed a great deal of jet-like features rooted in the flare ribbons. During the development of the flare, these jet-like features rose up from the limb and then fell back. We studied 15 isolated features, and their estimated lifetime, average projected width, projected length, and apparent velocity were 87 s, 885 km, 2.7 Mm, and 70 km s−1, respectively. After 16:23 UT, cold material started to condense, dropping from the top to the footpoints of the loops, and the jet-like features stopped occurring.
Using the IRIS spectroscopic observations, we also investigated the jet-like features appeared during the X1.0 flare in AR 12192 on 2014 October 25. We analysed the spectral profiles of Fe xxi 1354.08 Å and Si iv 1402.77 Å at the base of a jet-like feature. The hot Fe xxi line is blueshifted by ∼143 km s−1, while the cool Si iv line exhibits obvious redshift of ∼13 km s−1, which is consistent with the scenario of chromospheric evaporation.
Here, we directly observed the jet-like features with apparent motion perpendicular to the flare ribbons, which is the direct observational evidence of chromospheric evaporation.
Supplementary data
Movies 1–3.
Acknowledgments
We thank the referee for valuable suggestions. This work is supported by the National Natural Science Foundations of China (11533008, 11790304, 11673035, 11773039, 11673034, 11790300), Key Programs of the Chinese Academy of Sciences (QYZDJ-SSW-SLH050), and the Youth Innovation Promotion Association of CAS (2014043). The data are used courtesy of IRIS, SDO, and GOES science teams.
Footnotes
Movies 1–3 are available in the supplementary data section of online edition of this article.
References
