-
PDF
- Split View
-
Views
-
Cite
Cite
Jun Toshikawa, Hisakazu Uchiyama, Nobunari Kashikawa, Masami Ouchi, Roderik Overzier, Yoshiaki Ono, Yuichi Harikane, Shogo Ishikawa, Tadayuki Kodama, Yuichi Matsuda, Yen-Ting Lin, Masafusa Onoue, Masayuki Tanaka, Tohru Nagao, Masayuki Akiyama, Yutaka Komiyama, Tomotsugu Goto, Chien-Hsiu Lee, GOLDRUSH. III. A systematic search for protoclusters at z ∼ 4 based on the >100 deg2 area, Publications of the Astronomical Society of Japan, Volume 70, Issue SP1, January 2018, S12, https://doi.org/10.1093/pasj/psx102
Close - Share Icon Share
Abstract
We conduct a systematic search for galaxy protoclusters at z ∼ 3.8 based on the latest internal data release (S16A) of the Hyper Suprime-Cam Subaru strategic program (HSC-SSP). In the Wide layer of the HSC-SSP, we investigate the large-scale projected sky distribution of g-dropout galaxies over an area of 121 deg2, and identify 216 large-scale overdense regions (>4 σ overdensity significance) that are likely protocluster candidates. Of these, 37 are located within 8΄ (3.4 physical Mpc) of other protocluster candidates of higher overdensity, and are expected to merge into a single massive structure by z = 0. Therefore, we find 179 unique protocluster candidates in our survey. A cosmological simulation that includes projection effects predicts that more than 76% of these candidates will evolve into galaxy clusters with halo masses of at least 1014 M⊙ by z = 0. The unprecedented size of our protocluster candidate catalog allows us to perform, for the first time, an angular clustering analysis of the systematic sample of protocluster candidates. We find a correlation length of 35.0 h−1 Mpc. The relation between correlation length and number density of z ∼ 3.8 protocluster candidates is consistent with the prediction of the ΛCDM model, and the correlation length is similar to that of rich clusters in the local universe. This result suggests that our protocluster candidates are tracing similar spatial structures to those expected from the progenitors of rich clusters, and enhances the confidence that our method for identifying protoclusters at high redshifts is robust. In years to come, our protocluster search will be extended to the entire HSC-SSP Wide sky coverage of ∼ 1400 deg2 to probe cluster formation over a wide redshift range of z ∼ 2–6.
1 Introduction
Structure formation in the universe proceeds hierarchically. Small perturbations in the initial density field grow and merge together with time, leading to the emergence of a cosmic web: a filamentary structure with voids and overdensities (Bertschinger 1998). How galaxy clusters, the largest overdensities at the nodes of this web, are assembled remains an open question. When and where does the evolution of galaxies residing in these highest-density peaks differ from those in the field? To address this question, it is necessary to directly investigate all the evolutionary stages of galaxy clusters through cosmic time, including their progenitors, “protoclusters” (Overzier 2016). In the local universe, galaxy clusters exhibit tight red sequences, composed of massive quiescent galaxies, and can be traced by X-ray emission from the hot gas trapped in their massive dark matter halos. Increasing redshifts, the fraction of star-forming galaxies becomes higher, and quiescent galaxies would be a rare galaxy population even in overdense environments at z ≳ 2. Galaxies in protoclusters are predicted to be the first to transition from star-forming to quiescent due to environmental effects. Numerical simulations suggest that at early epochs these galaxies may experience enhanced accretion and galaxy merger rates (Somerville & Davé 2015). Protoclusters thus represent a unique laboratory for the study of early (massive) galaxy growth. However, direct empirical data in support of these expectations remains elusive. Despite their importance, protoclusters remain poorly understood due to their rarity. So far, the number of known protoclusters in the early universe (z ≳ 3) is limited to less than a dozen systems (e.g., Venemans et al. 2007; Toshikawa et al. 2016).
To find such rare protoclusters at high redshifts, radio galaxies (RGs) and quasars (QSOs) are commonly used as tracers of protoclusters (e.g., Wylezalek et al. 2013; Adams et al. 2015) because these galaxies hosting powerful active galactic nuclei (AGN) are thought to be embedded in massive dark matter halos. However, not all RGs and QSOs appear to reside in high-density environments (Hatch et al. 2011; Mazzucchelli et al. 2017; Uchiyama et al. 2018), and Hatch et al. (2014) found that although RGs are found in environments that are, on average, relatively biased compared to other galaxies, they can be found in a wide range of low- to high-density environments based on a study of 419 RGs. It is therefore still unclear whether, and how, the AGN activity in, for example, RGs and QSOs is related to their surrounding environments. Because of non-unity AGN duty cycles, we also expect that a large fraction of protoclusters would be missed if using powerful AGNs as tracers. Furthermore, strong radiation from RGs and QSOs could also result in a suppression of galaxy formation (e.g., Barkana & Loeb 1999; Kashikawa et al. 2007). Therefore, in order to avoid possible selection biases, it has been a long-standing goal to search for protoclusters in large “blank” fields. At z ∼ 1–2, many galaxy clusters have been discovered by blank surveys (e.g., Rettura et al. 2014). Beyond z ∼ 3, while some protoclusters that do not host RGs or QSOs have been discovered (Steidel et al. 1998; Ouchi et al. 2005), the number of such protoclusters is still very small due to very limited sky coverage at a sufficient depth. Based on a relatively wide 4 deg2 optical imaging survey of the Canada-France-Hawaii Telescope Legacy Survey Deep Fields and follow-up spectroscopy, the number density of protoclusters was found to be only ∼ 1.5 deg−2 at z ∼ 4 (Toshikawa et al. 2016).
Here, we present a systematic survey of protoclusters at z ∼ 3.8 based on the wide-field survey with the Hyper Suprime-Cam (HSC: Miyazaki et al. 2012) conducted as part of the Subaru strategic program (SSP). The HSC is mounted at the prime focus of the Subaru telescope and has a large field-of-view (FoV) of 1.8 deg2. The wide-field imaging capability of the HSC enables us to find high-redshift protoclusters in large blank fields with relative ease. The HSC-SSP started early in 2014 and will be completed by 2019. The HSC-SSP is composed of three layers, the UltraDeep (UD; 3.5 deg2, i ∼ 28 mag), the Deep (26 deg2, i ∼ 27 mag), and the Wide (1400 deg2, i ∼ 26 mag) layers (Aihara et al. 2018). By using the extremely wide area coverage and the high sensitivity through five optical broad-bands (g, r, i, z, and y bands), we construct a systematically selected sample of protoclusters at z ≳ 3. The present paper is one in a series of papers on Lyman break galaxies (LBGs) based on the HSC-SSP, named Great Optically Luminous Dropout Research Using Subaru HSC (GOLDRUSH), which include sample selection and UV luminosity function (Ono et al. 2018), clustering analysis (Harikane et al. 2018), and the protocluster search presented in this paper. In addition, Uchiyama et al. (2018) and Onoue et al. (2018) discuss the relation between LBG overdensity and QSOs by using the sample of protocluster candidates constructed in this paper. The HSC-SSP also allows us to study high-redshift Lyα emitters (LAEs) by narrow-band imaging in the project known as Systematic Identification of LAEs for Visible Exploration and Reionization Research Using Subaru HSC (SILVERRUSH: Ouchi et al. 2018; Shibuya et al. 2018a, 2018b; Konno et al. 2018). This paper is organized as follows: Section 2 describes the selection of z ∼ 3.8 galaxies and the systematic sample of protocluster candidates. In section 3, we investigate the spatial distribution of protocluster candidates through a clustering analysis. We discuss the dark matter halo mass of protoclusters based on a systematic sample of protocluster candidates in section 4. The summary is given in section 5. We assume the following cosmological parameters: ΩM = 0.3, |$\Omega _\Lambda =0.7$|, H0 = 100h km s−1 Mpc−1 = 70 km s−1 Mpc−1, and magnitudes are given in the AB system.
2 Protocluster candidates
2.1 Selection of z ∼ 3.8 galaxies
In this paper, we make use of the latest internal HSC-SSP data release (S16A). The current UD and Deep layers have not yet reached the final depths of the five-year HSC-SSP. In the Wide layer, the survey area at full depth has been steadily increasing as the HSC-SSP proceeds. The sky coverage with all five broad-bands (g, r, i, z, and y) is 178 deg2 in the Wide layer of the S16A data release, and is already dozens of times larger than any previous survey capable of detecting protoclusters at z ≳ 3. Therefore, in this paper, we focus on a systematic search for protoclusters at z ∼ 3.8 in the Wide layer as our initial attempt. Although the Wide layer is composed of three large regions (two around the spring and autumn equators and the other around the Hectmap region) at the end, the current Wide data release includes six disjoint regions in the XMM-LSS, GAMA09H, WIDE12H, GAMA15H, HECTOMAP, and VVDS fields.
2.2 Identification of protocluster candidates
The depth in the Wide layer is inhomogeneous over the whole area because the sky conditions vary during long-term observations; furthermore, even in the same portion of the Wide layer, all five optical filters are not observed in the same night. The inhomogeneity of depth could have a large impact on the number of detected objects, making it difficult to fairly compare number densities among different fields. The hscPipe processes HSC imaging data separately in 1.7 × 1.7 deg2 rectangular tracts, and a tract is further divided into sub-regions of 12 × 12 arcmin2 patch. We estimate the sky noise of each patch, determined as the standard deviation of the sky flux measured by PSF photometry (figure 1). We search for protocluster candidates in an area where the 5 σ limiting magnitudes of the g, r, and i bands are fainter than 26.0, 25.5, and 25.5 mag, respectively. These limits, slightly shallower than the target depths, are met by most of the patches in the Wide layer except the Wide-GAMA09H regions, whose r-band depth is shallower than the limit, as shown in figure 1, and the difference in depth between the r and i bands is large. Since the UV slope, or equivalently the r − i color, of g-dropout galaxies is expected to be flat, the imbalance in depth between r and i bands could bias the g-dropout selection. Thus, the Wide-GAMA09H region is not used in this study. The total effective area of our analysis is 121 deg2 (table 1). In these regions, we use g-dropout galaxies down to the i-band magnitude of 25.0 mag, corresponding to the characteristic UV magnitude at z ∼ 4, for the estimate of surface number density.
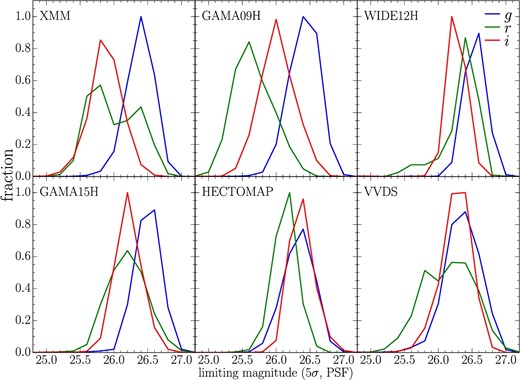
Sky noise distribution over the whole Wide layer. The blue, green, and red lines indicate the sky noises measured in the g, r, and i bands, respectively.
| Name . | RA . | Dec . | Effective area [deg2] . |
|---|---|---|---|
| Wide-XMM | 1h36m00s–3h00m00s | −6°00΄00″–−2°00΄00″ | 31.3 |
| Wide-WIDE12H | 11h40m00s–12h20m00s | −2°00΄00″–2°00΄00″ | 17.0 |
| Wide-GAMA15H | 14h00m00s–15h00m00s | −2°00΄00″–2°00΄00″ | 39.3 |
| Wide-HECTOMAP | 15h00m00s–17h00m00s | 42°00΄00″–45°00΄00″ | 12.6 |
| Wide-VVDS | 22h00m00s–23h20m00s | −2°00΄00″–3°00΄00″ | 20.7 |
The local surface number density of g-dropout galaxies is quantified by following the same method as in Toshikawa et al. (2016), which is derived from counting the number of g-dropout galaxies within an aperture of 1|${^{\prime}_{.}}$|8 (0.75 physical Mpc) radius. This radius is expected to be the typical extent of regions which will coalesce into a single massive halo of > 1014 M⊙ by z = 0 (e.g., Chiang et al. 2013). Although progenitors of more massive galaxy clusters could be even larger, they are still expected to exhibit their significant excess number density on a ∼ 1|${^{\prime}_{.}}$|8 scale. On the other hand, our choice may make it difficult to identify smaller structures, like progenitors of galaxy groups, because their clustering signal would be diluted by applying somewhat larger apertures than their typical extent. Furthermore, projection effects resulting from the relatively wide redshift range of g-dropout galaxies will also affect the estimate of surface number density because the typical size of protoclusters (Δz ≲ 0.03) is tens of times smaller than the redshift range of g-dropout galaxies. It is possible that an alignment of two small structures by chance shows a significantly high density, while the overdensity of protoclusters can diminish due to fore/background void regions. The apertures are distributed over the Wide layer in a grid pattern at intervals of 1΄. By using only apertures in which the masked area is less than 5%, the mean and the dispersion, σ, of the number of g-dropout galaxies in an aperture are found to be 6.4 and 3.2, respectively. The difference in the mean among the five fields of the Wide layer is only 0.54 (0.17 σ) at most. Thus, while the limiting magnitudes of each field are slightly different, we confirm that we obtain a highly uniform sample over all five regions by limiting the selection of g-dropout galaxies to being brighter than 25.0 mag and by removing patches in which the g-, r-, and i-band depths are shallower than our criteria. Both statistical errors and cosmic variance should contribute to the estimate of σ (Somerville et al. 2004), but the derived σ is almost equal to that expected from Poisson statistics (Gehrels 1986) due to the small number of g-dropout galaxies in an aperture. The detailed study of cosmic variance at high redshift will be addressed based on the HSC-Deep layer. In this study, we only aim to significantly identify overdense regions, rather than mapping environments from low to high density accurately. The surface number density of g-dropout galaxies in masked regions is assumed to be the same as the mean, but apertures in which >50% of the area is masked are excluded from our protocluster search. Overdensity is defined as the excess surface number density over the mean, and overdensity contours of the Wide layer are plotted in figure 2.
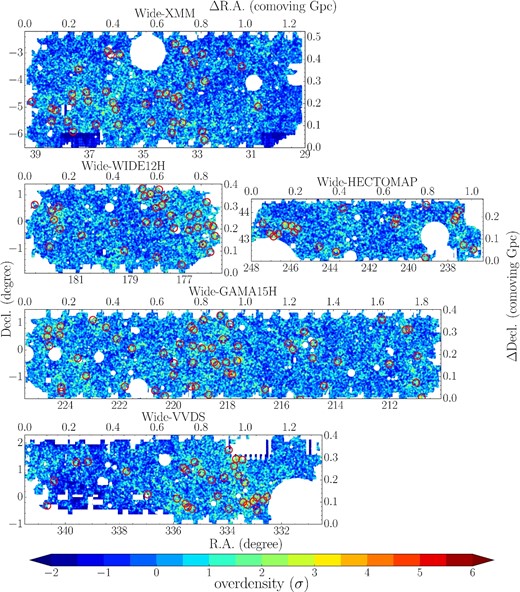
Overdensity contours of g-dropout galaxies. Higher density regions are indicated by redder colors. The white shows the regions that are masked due to survey edges, bright stars, or insufficient depth. The positions of the unique 179 protocluster candidates are indicated by red circles. The areas of all the panels are shown on the same scale.
Since the central ∼ 1 deg2 area of the UD-COSMOS overlaps with the Canada-France-Hawaii Telescope Legacy Survey (CFHTLS) Deep 2 field, we can make a consistency check of our overdensity estimate by directly comparing ours with the overdensity contours of g-dropout galaxies in the CFHTLS (Toshikawa et al. 2016). The same color selection of g-dropout galaxies and overdensity estimate described above are applied to both the HSC and CFHTLS data sets. As shown in figure 3, the overdensity contours derived by the HSC data set are clearly consistent with those of the CFHTLS data set, suggesting that we can correctly map overdensity in the Wide layer as well.
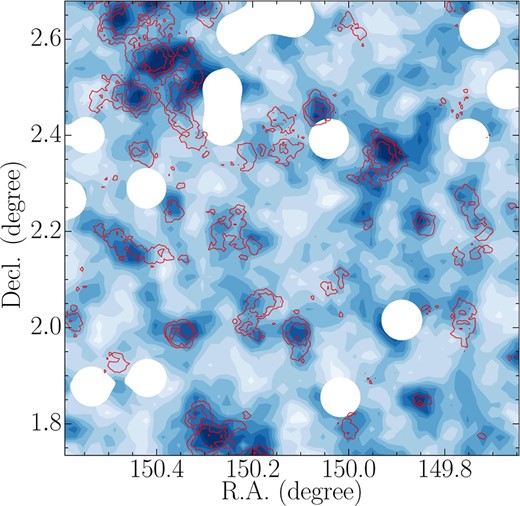
Overdensity contours of g-dropout galaxies based on the HSC (blue color scale) and CFHTLS (red lines) data set. The white regions are masked areas due to bright stars. The positions of overdensity peaks in the HSC data set are almost identical to those found in the CFHTLS data set.
The distribution of overdensity significance in the Wide layer largely deviates from the expected distribution from the Poisson distribution at the high-overdensity end (figure 4). For example, the number of 4 σ overdense regions is ∼ 30 times higher than the expectation from a Poisson distribution. Thus, high overdense regions would result from clustering of physically associated galaxies rather than a chance alignment due to a projection effect. Furthermore, we have also compared the HSC data set with a theoretical prediction derived from the light-cone model of Henriques et al. (2012) by selecting mock g-dropout galaxies and applying the same overdensity measurements—see subsection 3.2 in Toshikawa et al. (2016) for details. The observed distribution is consistent with that of the model prediction, although the model somewhat underestimates the number of >6 σ overdensity significance regions. Such overdense regions are extremely rare, and the excess observed in the Wide layer over the simulations comes as no surprise given that the volume of our survey is ∼ 1 Gpc3 compared to the volume of ∼ 0.4 Gpc3 for the simulation from which the light-cone model extracted. The model thus reasonably reproduces the observed overdensity distribution except at the extreme high-density end, and the mass of the descendant halo at z = 0 can be deduced from the halo merger trees given by the simulation. As shown in Chiang, Overzier, and Gebhardt (2013) and Toshikawa et al. (2016), the surface overdensities observed toward protoclusters are statistically correlated with the descendant halo mass at z = 0, though we expect a large scatter caused by the redshift uncertainty of the dropout galaxies—see subsection 3.2 in Toshikawa et al. (2016) for details. Protocluster candidates are defined as regions where the overdensity significance is >4 σ at the peak. With this definition, 76% of these candidates are expected to evolve into galaxy clusters of > 1014 M⊙ at z = 0, and the overdensities of the others are enhanced by projection effects, though they will be smaller structures than galaxy clusters. On the contrary, only ∼ 6% of progenitors of > 1014 M⊙ halos at z = 0 are expected to be located on >4 σ regions at z ∼ 4 because the overdensity of most progenitors is decreased by the projection effect. Our selection method for protocluster candidates can make a clean sample at high purity, though its completeness is small. It should be noted that our sample has low contamination, guaranteeing minimal effects of contamination on our measurements of angular clustering (section 3). Because our selection strategy minimises the selection of structures suffering from large projection effects, our sample of protocluster candidates will be biased to the richest structures with the average descendant halo mass of ∼ 5 × 10¹⁴ M⊙.
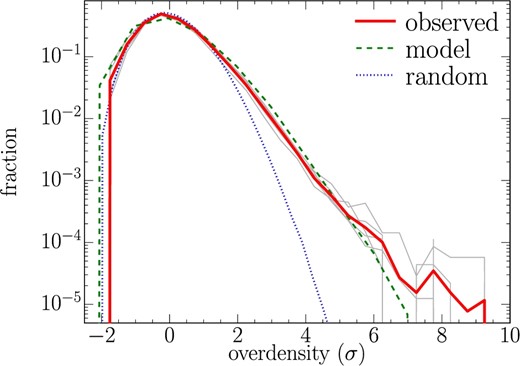
Distribution of overdensity significance. The gray and red lines indicate the individual regions of the Wide layer and their average, respectively. The green dashed and blue dotted lines show the distributions expected from our theoretical model and a Poisson distribution, respectively.
We have found 216 overdense regions of g-dropout galaxies having the >4σ overdensity in the Wide layer. The individual overdense regions show a wide range of morphologies (figure 5). The morphology of these overdense regions will eventually provide clues to understanding galaxy/halo assembly from the large-scale structure of the universe, but this is beyond the scope of this paper. Some overdense regions have neighboring overdense regions within a few arcminutes (figure 5). Although, as mentioned above, 0.75 physical Mpc (1|${^{\prime}_{.}}$|8) is the typical extent of protoclusters, protocluster galaxies can be located a few or more physical Mpc away from their center depending on the direction of the filamentary structure (e.g., Muldrew et al. 2015). It is unlikely that two overdense regions are located within a few arcminutes just by chance, because the mean separation is ∼ 40΄ based on the surface number density of overdense regions. Toshikawa et al. (2016) quantitatively investigated how far protocluster members are typically spread from the center and found that galaxies lying within the volume of Rsky < 8΄(6΄) and Rz < 0.013(0.010) at z ∼ 3.8 will be members of the same protocluster with a probability of >50%(80%). Overdense regions which are located near each other are expected to merge into a single structure by z = 0. In this study, if >4 σ overdense regions are located within 8΄ from another more overdense region, they can be regarded as substructures of that protocluster, though the spectroscopic follow-up will be required to distinguish them from a chance alignment. Thirty-seven regions out of the 216 having >4 σ overdensity have more overdense regions in the neighborhood. The fraction of neighboring overdense regions is significantly higher than that expected by uniform random distribution (N = 10.6 ± 3.2), implying that the large fraction of neighboring overdense regions is physically associated with each other, rather than a chance alignment. As a result, we have found 216 protocluster candidates at z ∼ 3.8, and 179 out of them would trace the unique progenitors of galaxy clusters in the Wide layer, which is about ten times larger than any previous study of protoclusters (N ∼ 10–20 at z ≳ 3). Toshikawa et al. (2016) indicate that three protocluster candidates out of four identified by the same method are confirmed to be real protoclusters by spectroscopic follow-up observations, which is consistent with the model prediction.
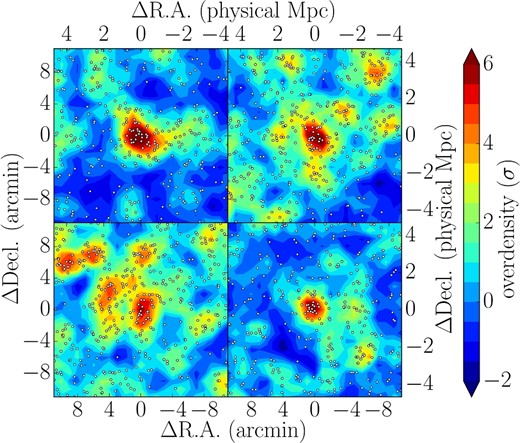
Examples of the protocluster candidates. The points indicate g-dropout galaxies. Individual protocluster candidates exhibit unique shapes, and some are accompanied by several other overdense regions (e.g., bottom-left and top-right panels).
3 Angular clustering
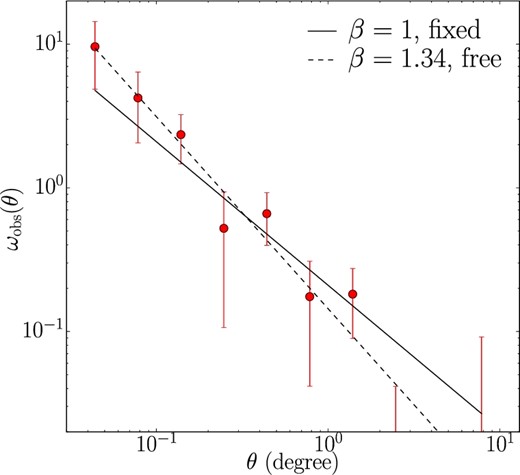
Observed angular correlation function of all protocluster candidates. The solid and dashed lines show the best-fit power laws in the case of fixed and free β, respectively.
4 Halo mass estimate
The mass of the dark matter halo is a key quantity to charactrize the physical properties of protoclusters because the evolution of the dark matter halo or the formation of the large-scale structure is relatively well understood compared with complex baryon physics. Once the dark matter halo mass is estimated at high redshifts, we can predict the descendant halo mass in the context of a hierarchical structure formation model. However, in actual observations, protocluster candidates are defined by the number density of galaxies, and it is not straightforward to estimate their halo mass. For local clusters, their velocity dispersion is frequently used to measure halo mass, and the same technique is applied to protoclusters at high redshifts; however, protoclusters would be far from virialization. Another method is based on galaxy number density, which can be converted into mass density by using the bias parameter; then, mass can be calculated by the volume of a protocluster (e.g., Steidel et al. 1998; Venemans et al. 2007). It should be noted that the mass estimated like this means the total mass which will collapse into a single structure rather than the current halo mass at high redshifts.
In this study, we show two alternative approaches. One is abundance matching by assuming that protoclusters occupy all the most massive dark matter halos, and the other is to utilize the clustering strength of protocluster candidates estimated in section 3. We use these methods for protocluster candidates at z ∼ 3.8 for the first time because a systematic sample is required.
4.1 Abundance matching
The number density of the protocluster candidates is estimated to be n = 4.6 × 10⁻⁷ h3 Mpc−3 by assuming that the redshift selection function of protoclusters is identical with that of g-dropout galaxies. The number density of protocluster candidates is found to correspond to that of dark matter halos of ∼(0.8–1.1) × 1013 h−1 M⊙ at z ∼ 3.8 (figure 7). The difference of cosmology or mass function model does not have a large effect on the estimate of the halo mass. In the same manner, it would be possible to predict the descendant halo mass at z = 0, though we need to consider the change of the number density from z ∼ 3.8. If individual protocluster candidates will evolve into different clusters, or if the number density at z = 0 is identical to that at z ∼ 3.8, the descendant halo mass of protocluster candidates is expected to be ∼ 6.3 × 10¹⁴ h−1 M⊙. However, as discussed in subsection 2.2, some protocluster candidates have other neighboring protocluster candidates. Since such protocluster candidates can merge into single massive structures, the number density at z = 0 will be smaller than at z ∼ 3.8. In the case where protocluster candidates located within half the mean separation (20΄) will coalesce into a single halo by z = 0, the number density decreases by 37%. Along with the decline of number density, the expected descendant halo mass increases to ∼ 7.6 × 10¹⁴ h−1 M⊙. As shown in figure 7, the slope of the mass function is very steep at the high-mass end; hence, the estimate of halo mass based on abundance matching has a small dependence on the fraction of protocluster merging.
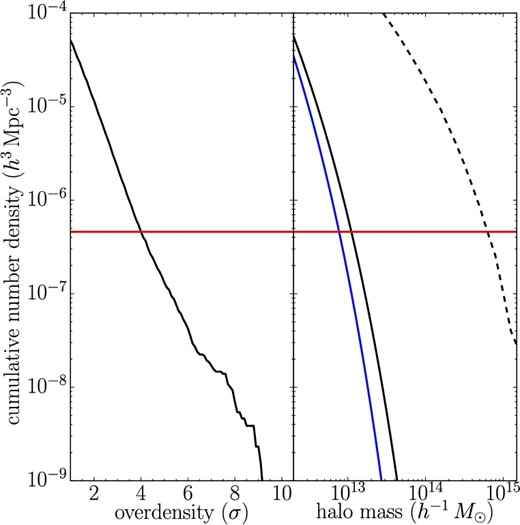
Cumulative number density of overdense regions of g-dropout galaxies (left) and dark matter halos (right). In the right-hand panel, the solid lines represent halo mass functions at z ∼ 3.8 with different cosmology (black: WMAP9; blue: Planck), and the halo mass function at z = 0 is shown by the dashed line. The horizontal line (red) indicates the number density of protocluster candidates at z ∼ 3.8 (>4 σ overdense regions). It should be noted that the number density of descendant clusters at z = 0 would be smaller than that of protoclusters at z ∼ 3.8 due to merging.
4.2 Clustering
We also calculate the dark matter halo mass of our protocluster candidates based on our clustering analysis. We have used the analytical model proposed by Sheth, Mo, and Tormen (2001) and Mo and White (2002), which has been shown to provide a connection between the bias of the dark matter halo and the mass of the dark matter halo based upon ellipsoidal collapse (Sheth et al. 2001), provided the bias of the dark matter halo and the redshift are given. We estimate the mean dark matter halo mass, 〈Mh〉, from a comparison between the effective bias parameter and the bias of the dark matter halo. The dark matter halo mass was estimated to be |$\langle M_h \rangle =2.3^{+0.5}_{-0.5}\times 10^{13}\, h^{-1}\, {M_\odot }$|, which is roughly consistent with that estimated by abundance matching. Based on this dark matter halo mass at z ∼ 3.8, the descendant halo mass at z = 0 is evaluated as |$\langle M_h \rangle =4.1^{+0.7}_{-0.7}\times 10^{14}\, h^{-1}\, {M_\odot }$| using the extended Press–Schechter model.
4.3 Relation between abundance and clustering strength
![Comoving number density, n, versus correlation length, r0, for protocluster candidates at z ∼ 3.8 (red star, this study), distant clusters at z ∼ 1.5 (blue circles: Papovich 2008; Rettura et al. 2014), local clusters at z = 0.1–0.3 (black squares: Croft et al. 1997; Bahcall et al. 2003), and X-ray-selected clusters at z < 0.2 (green triangles, Abadi et al. 1998; Collins et al. 2000; Bahcall et al. 2003). The dashed line indicates the expected relation between n and r0 from ΛCDM [equation (7): Younger et al. 2005]. (Color online)](https://oup.silverchair-cdn.com/oup/backfile/Content_public/Journal/pasj/70/SP1/10.1093_pasj_psx102/2/m_pasj_70_sp1_s12_f8.jpeg?Expires=1750226298&Signature=jI4-jqDM7SWzn-SjuCtkKXv8-c2qM4vPVemtse6tyRTXhaPqfqJPHy~DA-q7miV3HlRAGdZoKmG0Wr8GO1A~yw37GHAFQC9Nn2arVVs8sLV-hfGfJXU6R5sD4n4p9gxbrJWA7Punnlsvl-lkU2ucXUFCACIaaD~PYI73INywDeGQbqvUyKHKjUwaDfrfRrqNKFiVqm7uyvRWpYtk76e54~~Ov7lNpn1H2uLC3swjbPN9mJQbMyW6CBQOZbQrEdV9-jY7QwSA3761U2kBChFJKxN5Iw4Tzy7DtY5Vawl6TkdjWieYzhLRp6xgKiRw3ZaOZsZu2436tdzGAWnOFa0pFg__&Key-Pair-Id=APKAIE5G5CRDK6RD3PGA)
Comoving number density, n, versus correlation length, r0, for protocluster candidates at z ∼ 3.8 (red star, this study), distant clusters at z ∼ 1.5 (blue circles: Papovich 2008; Rettura et al. 2014), local clusters at z = 0.1–0.3 (black squares: Croft et al. 1997; Bahcall et al. 2003), and X-ray-selected clusters at z < 0.2 (green triangles, Abadi et al. 1998; Collins et al. 2000; Bahcall et al. 2003). The dashed line indicates the expected relation between n and r0 from ΛCDM [equation (7): Younger et al. 2005]. (Color online)
5 Summary
We have presented a systematic sample of protoclusters at z ∼ 3.8 in the HSC Wide layer based on the latest internal data release of the HSC-SSP (S16A). The unprecedentedly wide survey of the HSC-SSP allowed us to perform a large protocluster search without having to rely on preselection of common protocluster probes (e.g., RGs or QSOs). We selected a total of 216 overdense regions with an overdensity significance greater than 4 σ. Of these regions, 37 can be considered to be substructures of a larger overdensity region, and thus in total we have identified 179 unique protocluster candidates. By comparing these candidates with theoretical models, we found that >76% of them are expected to evolve into galaxy clusters of > 1014 M⊙ by z = 0. We investigated for the first time the spatial distribution of protoclusters through clustering analysis, and the correlation length was found to be r0 = 34.1 h−1 Mpc. Both the abundance matching method and the clustering analysis resulted in consistent protocluster halo masses of ∼ (1 − 2) × 1013 M⊙ at z ∼ 3.8. These halos are expected to evolve into galaxy clusters of ≳5 × 10¹⁴ M⊙ by z = 0 (figures 7 and 8). The relation between number density and correlation length is consistent with the prediction of the ΛCDM model, suggesting that our sample of protocluster candidates at z ∼ 3.8 indeed probes the progenitors of local rich clusters. When the HSC-SSP is completed, we expect that >1000 protoclusters will be identified at z ∼ 3.8 from the Wide layer and a total of ∼ 100 protoclusters from z ∼ 2 to z ∼ 6 will be found from the UD and Deep layers. Based on a systematic sample of protoclusters across cosmic time, we will be able to understand the process of cluster formation from birth to maturity.
Acknowledgements
The HSC collaboration includes the astronomical communities of Japan and Taiwan, and Princeton University. The HSC instrumentation and software were developed by the National Astronomical Observatory of Japan (NAOJ), the Kavli Institute for the Physics and Mathematics of the Universe (Kavli IPMU), the University of Tokyo, the High Energy Accelerator Research Organization (KEK), the Academia Sinica Institute for Astronomy and Astrophysics in Taiwan (ASIAA), and Princeton University. Funding was contributed by the FIRST program from the Japanese Cabinet Office, the Ministry of Education, Culture, Sports, Science and Technology (MEXT), the Japan Society for the Promotion of Science (JSPS), the Japan Science and Technology Agency (JST), the Toray Science Foundation, NAOJ, Kavli IPMU, KEK, ASIAA, and Princeton University. This paper makes use of software developed for the Large Synoptic Survey Telescope (LSST). We thank the LSST Project for making their code available as free software at http://dm.lsst.org. We thank the anonymous referee for valuable comments and suggestions that improved the manuscript. We acknowledge support from JSPS grant 15H03645. Authors RO and YTL received support from CNPq (400738/2014-7).
References


