


Abstract
We report the Australia Telescope Compact Array 16 cm observation of CIZA J1358.9−4750. Recent X-ray studies imply that this galaxy cluster is composed of merging, binary clusters. Using the EW367 configuration, we found no significant diffuse radio emission in and around the cluster. An upper limit of the total radio power at 1.4 GHz is ∼1.1 × 10²² W Hz−1 in 30 square arcminutes, which is a typical size for radio relics. It is known that an empirical relation holds between the total radio power and X-ray luminosity of the host cluster. The upper limit is about one order of magnitude lower than the power expected from the relation. Very young (∼70 Myr) shocks with low Mach numbers (∼1.3), which are often seen at an early stage of merger simulations, are suggested by the previous X-ray observation. The shocks may generate cosmic-ray electrons with a steep energy spectrum, which is consistent with non-detection of bright (>1023 W Hz−1) relic in this 16 cm band observation. Based on the assumption of energy equipartition, the upper limit gives a magnetic field strength of below 0.68f(Dlos/1 Mpc)−1(γmin/200)−1 μG, where f is the cosmic-ray total energy density over the cosmic-ray electron energy density, Dlos is the depth of the shock wave along the sightline, and γmin is the lower cutoff Lorentz factor of the cosmic-ray electron energy spectrum.
1 Introduction
In the large-scale structure formation, merging galaxy clusters release their huge gravitational energy into the thermal energy of the intracluster medium (ICM) (e.g., Sarazin 2002; Markevitch & Viklinin 2007). A merger sequence of two clusters can be divided into (i) the early stage, where the two clusters are getting close (e.g., Abell 399/401, Fujita et al. 2008), and (ii) the late stage, where they are receding from each other (e.g., Abell 3667, Nakazawa et al. 2009); an intermediate stage between these two phases occurs on a short time-scale because of high-speed crossing of the two gravitational potential cores. Hydrodynamic simulations suggest that shock waves with position-dependent Mach numbers, |$\mathcal {M}$|, arise in the merger (e.g., Ryu et al. 2003; Takizawa 2008; Akahori & Yoshikawa 2010). The shocks with |$\mathcal {M}<2$| appear in the linking region of the two clusters in the early stage, while the shocks with larger Mach numbers, |$2<\mathcal {M}<4$|, appear ahead of the two receding cores in the late stage because the shocks propagate to cooler gas at cluster outskirts.
The merger stage is, therefore, one of the essential pieces of information in understanding the nature of cluster mergers. However, although shock waves and their Mach numbers are important clues for elucidating the merger stage, they are studied only in a limited number of bright X-ray clusters (e.g., Finoguenov et al. 2010; Akamatsu & Kawahara 2013; Itahana et al. 2015). Even though we know the presence of shocks, the merger stage is controversial in some clusters (e.g., RX J1347.5−1145, Kitayama et al. 2016). Significant effort has been ongoing over the last years to determine the merger stage by morphology of X-ray surface brightness, analysis of weak gravitational lensing, optical spectroscopy, and galaxy distribution (e.g., Okabe & Umetsu 2008; Okabe et al. 2011; Dawson 2013; Dawson et al. 2015; Okabe et al. 2015; Jee et al. 2016). For example, separation of a cD galaxy from the peak of X-ray surface brightness is frequently seen in the late stage of a merger (Abell 2163, Okabe et al. 2011).
Radio observation provides us with complementary information on the shock wave and the merger stage (e.g., Ozawa et al. 2015). Many clusters possess diffuse radio emissions, which are in general classified into radio halos, mini-halos, and relics, according to their size, location, morphology, and so on (see, e.g., Feretti et al. 2012 for a recent review). The connection between diffuse radio emission and the dynamical state of the system has been discussed (e.g., powerful radio halos in under-luminous X-ray clusters; Giovannini et al. 2011, and giant radio halos in cool core systems; Bonafede et al. 2014). Double-arc shapes seen in several radio relics suggest the presence of shock waves which appear in the late stage of mergers, although there are also radio relics that have more roundish shapes. The origin of such diversity amongst the relics has been intensively studied in the literature (see Feretti et al. 2012).
The cluster diffuse radio emission is likely synchrotron radiation, suggesting the presence of an intracluster magnetic field and cosmic-ray electrons (CRes). Because a GeV CRe emitting synchrotron radiation in the GHz band has a short lifetime, the emission would be associated with fresh CRes which are recently accelerated (e.g., Sarazin 1986; Enßlin et al. 1998; Carilli & Taylor 2002). For the merger shocks, diffusive shock acceleration (DSA) has been studied in the literature (e.g., Blandford & Eichler 1987; Kang & Ryu 2013; Vazza & Brüggen 2014). This theory can link the spectral index of radio emission with the shock Mach number. However, the standard DSA (the first-order Fermi acceleration) suffers from a low efficiency of acceleration, particularly at a shock with a low Mach number. To overcome this injection problem, other mechanisms have been studied, such as shock drift acceleration (SDA, e.g., Matsukiyo et al. 2011; Caprioli & Spitkovsky 2014; Guo et al. 2014; Matsukiyo & Matsumoto 2015) and second-order Fermi (re-)acceleration (Fujita et al. 2015, 2016; Kang et al. 2017). van Weeren et al. (2017) found a radio emission and interpreted it as synchrotron radiation from the CRes which were originally injected by anactive galactic nucleus (AGN) and were recently re-accelerated by a cluster merger shock.
Various mechanisms take place in the structure formation; shock heating, eddy cascading (turbulence), cosmic-ray acceleration, and magnetic-field amplification, as well as radiative cooling, AGN feedback, and metal enrichment. Therefore, observational diagnostics of energy budgets in galaxy clusters is crucially important in understanding the structure formation history. Thermal and non-thermal energies in the ICM can be partly estimated from X-ray continuum emission and synchrotron emission, respectively. It is known that a correlation holds between the radio power, P, and the X-ray luminosity, LX, of the host cluster. This LX–P relation applies to both radio halos and relics (e.g., Brunetti et al. 2007, 2009; Rudnick & Lemmerman 2009; Cassano et al. 2010, 2013; Enßlin et al. 2011; Feretti et al. 2012; Xu et al. 2012; Govoni et al. 2013; de Gasperin et al. 2014; Kale et al. 2015) and even to radio mini-halos in cool-core clusters (Gitti et al. 2015).
Although many late-stage clusters have been observed, there are only a small number of candidates of early-stage clusters, and little is known about shock waves, radio emission, the radio spectral index, and the LX–P relation in the early stage (e.g., Akamatsu et al. 2016). In the present paper, we report the first 16 cm (1–3 GHz) observations of CIZA J1358.9−4750 (hereafter CZ1359), which is a candidate early-stage cluster. We discuss the nature of CZ1359, such as its merger scenario and particle acceleration. This paper is organized as follows. We describe the observations and data reduction in sections 2 and 3, respectively. Results are shown in section 4. Our discussion is presented in section 5, followed by concluding remarks in section 6.
2 Radio observations
2.1 The target
CZ1359 is a nearby (redshift z ∼ 0.07) galaxy cluster listed in the X-ray cluster catalog, CIZA (the Clusters in the Zone of Avoidance, Ebeling et al. 2002; Kocevski et al. 2007). This object exhibits two X-ray surface brightness enhancements in the southeast and northwest directions with a separation of 14΄ ∼ 1.2 Mpc. The enhancements are likely sub-clusters and the separation is ∼0.7–0.8 times smaller than the virial radius (r200, Kato et al. 2015) of each sub-cluster. Each X-ray core possesses a giant elliptical galaxy, which does not significantly deviate from the X-ray center.
Kato et al. (2015) observed CZ1359 with the Suzaku X-ray telescope, and found that the ICM in the linking region between the cores is ∼30% hotter than the ICM around the cores. Moreover, they discovered a temperature jump in the region and confirmed an associated X-ray brightness jump in an archival XMM-Newton image. Applying the Rankine–Hugoniot condition to the largest temperature increase, they estimated the Mach number of the shock, |$\mathcal {M} =1.32 \pm 0.22$|. This number is broadly consistent with a prediction by numerical simulations (|$\mathcal {M} \sim 1.5$|, Akahori & Yoshikawa 2008, 2010).
The coincidental position of giant elliptical galaxies with X-ray cores, the X-ray brightness enhancement, and the X-ray temperature jumps all suggest that CZ1359 is in the early stage of merger, though further evidence such as radio emission is helpful to understand its thermal and dynamical state. There are no scientific centimeter observations covering the CZ1359 field, except the 843 MHz Sydney University Molonglo Sky Survey (SUMSS) shallow survey (Bock et al. 1999). There are also two 150 MHz surveys that are publicly available: the TIFR GMRT Sky Survey (TGSS) (Intema et al. 2017) and the GaLactic and Extragalactic All-sky MWA survey (GLEAM) (Hurley-Walker et al. 2017). All of these surveys detected several compact sources in the CZ1359 field (section 4), but no diffuse radio emission (L. T. George & R. Kale 2015 private communication).
2.2 The observation
In order to explore possible radio halos, mini-halos, and relics in the CZ1359 field, we carried out a deep centimeter observation of the entire CZ1359 field which extends to ∼30΄ in diameter. The observation was made with the Australia Telescope Compact Array (ATCA). We adopted the 16 cm band (from 1.1 GHz to 3.1 GHz) which gives a field-of-view of |$22 {^{\prime}_{.}} 3$| at the center frequency, 2.1 GHz. The observation required a trade-off between (i) an array configuration as compact as possible to gain a better sensitivity for diffuse emission, and (ii) a beam size of ∼1΄ or better so as to identify arc-shaped structures of potential relics. We adopted the EW367 array configuration in which all six antennas were mounted in the east–west track. The minimum baseline was 46 m and the largest well-imaged structure at 2.1 GHz is ∼20΄.1 The maximum baseline was 367 m without the distant antenna 6 (CA06), and 4408 m with CA06. Resultant beam position angles and beam major/minor axes at 2.1 GHz were −89° and ∼23″ × 20″ with CA06, and |${-1 \rm {.^{\circ}}6}$| and ∼137″ × 91″ without CA06, respectively.
We adopted four pointings to cover the CZ1359 field. About a half of each primary beam overlaps the other beams. The observations were performed on 2014 June 6 (northeast, NE), June 8 (northwest, NW), June 9 (southeast, SE), and June 10 (southwest, SW) (PI: T. Akahori, ID: C2916). The parameters of these pointings are listed in table 1. Observation time for each pointing was 12 hours in total, including the overhead of standard calibration and antenna slew time. On-target exposure times were 9.33, 9.92, 9.92, and 9.33 hr in total for NE, NW, SE, and SW, respectively. Such a long tracking provided us with good hour angle coverage.2 The system temperature was between 38 K (meridian passage) and 50 K (rising and setting) and those were stable during the observing days.
Observation log of CZ1359 with the ATCA.
| Pointing | Right ascension | Declination | Date | Period | Frequency | Bandwidth | Exposure |
|---|---|---|---|---|---|---|---|
| (J2000.0) | (J2000.0) | (UT) | (MHz) | (MHz) | (min) | ||
| NE | 13:59:10.0 | −47:41:00.0 | 2014 June 06 | 04:58–16:37 | 1100–3100 | 2048 | 560 |
| NW | 13:58:10.0 | −47:40:00.0 | 2014 June 08 | 05:02–17:06 | 1100–3100 | 2048 | 595 |
| SE | 13:59:10.0 | −47:52:00.0 | 2014 June 09 | 04:30–16:36 | 1100–3100 | 2048 | 595 |
| SW | 13:58:00.0 | −47:51:00.0 | 2014 June 10 | 04:31–16:46 | 1100–3100 | 2048 | 560 |
On each day, we observed the calibrator 0823−500 for 10 minutes at the start of the schedule, the band-pass calibrator 1934−638 (12.6 Jy at 2.1 GHz, a compact source, no linear polarization, where 1 Jy = 10−26 W Hz−1 m−2) for 10 minutes in the middle and at the close of the schedule, and the gain/phase calibrator 1421−490 (7.38 Jy at 2.1 GHz; the distance from the target is |${4{^{\circ}_{.}}48}$|) for three minutes of every 35 minutes of on-target observations. The 1M-0.5k Compact Array Broadband Backend (CABB, Wilson et al. 2011) receiver mode was selected to allow full spectro-polarimetry observations. The raw spectral channel is 1 MHz and the bandwidth is 2048 MHz.
3 Data reduction
We performed the standard ATCA data reduction using the MIRIAD software (version 1.5) as follows. All data were loaded by the MIRIAD task atlod with options birbie, rfiflag, xycorr, and noauto. 40 channels at the band edges that are likely affected by the bandpass rolloff were removed by uvflag. Data were then split into subsets for the band-pass calibrator, the gain/phase calibrator, and the target, using uvsplit. For each subset, we performed uvflag, pgflag, and blflag to flag out radio frequency interferences (RFIs). These were done iteratively until RFI signals disappeared from the visibility plots. The band-pass solution was made by mfcal, using the subset of the band-pass calibrator. The solution was transferred to the gain/phase calibration by gpcopy, and then gpcal was carried out to obtain the gain and phase solutions. The error of the absolute value was computed by bootstrap estimation using gpboot. Finally, all solutions were applied to the target data using gpcopy and gpaver.
The visibility data were transformed into images using invert, where the robustness parameters, r = 0.5 and 2.0, were chosen to optimize the images for the studies of compact and diffuse sources, respectively. We created the images including CA06, which gives the longest baselines and improves the angular resolution. We also created the images excluding CA06, because it makes the image rms noise level worse due to the large side-lobes caused by large uv gaps between the longest baselines and the others. The deconvolution was carried out using mfclean, where we employed the best iteration number which minimized the rms noise on the cleaned image. Finally, four pointing images were linearly combined into a mosaic image using linmos.
The Stokes I images were successfully reduced and the flux scale was verified using a SUMSS source (appendix 1). The 128, 512, and 2048 MHz bandwidth images were made to compare the rms noise levels. Here, in the 128 MHz case, we did not consider the bottom (1140 MHz) and top (3060 MHz) bands, since the noise levels were high due to RFIs. Figure 1 summarizes the rms noise levels we have achieved with the robustness r = 2.0. Typical noise levels were 0.5 mJy beam−1 (1.5–2 GHz) and 0.3 mJy beam−1 (2–3 GHz). Meanwhile, Stokes Q and U images have no significant signal. We did not obtain reliable noise levels of Stokes Q and U because of artefacts in the images.
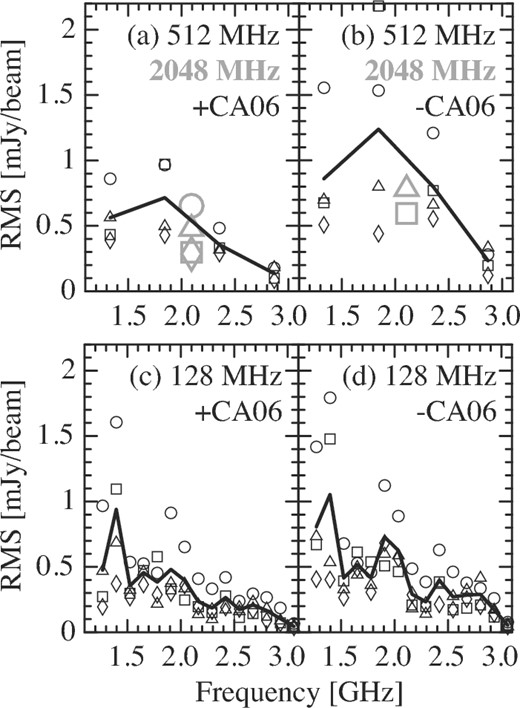
(a) Image rms noise levels for the NE (circles), NW (boxes), SE (triangles), and SW (diamonds) pointings with 512 MHz (black) and 2048 MHz (gray) bandwidth. The solid line is the average for the four pointings of 512 MHz bandwidth. (b) The same as (a) but without CA06 baselines. Note that rms noise levels of NE (51.26 mJy beam−1) and SW (4.730 mJy beam−1) for a 2048 MHz bandwidth are outside the frame of (b). (c), (d) Same as (a) and (b), respectively, but with a 128 MHz bandwidth.
The typical noise levels were several times worse than the theoretical rms noise level (e.g., 0.038 mJy beam−1 at 2036 MHz with a 128 MHz bandwidth). This is thought to be mostly due to a very bright source, PMN J1401−4733 (or SUMSS J140158−473336), located at the edge of each pointing image. The total intensity of this source, 0.433 Jy beam−1 at 1524 MHz, was ∼1000 times higher than the image rms noise level, and this strong signal inevitably produces frequency-dependent sidelobes. Actually, the sidelobe effect caused the noise to be highest in the NE images, and increasing the bandwidth above 128 MHz did not improve the image rms noise level, as shown in figure 1. The sidelobe effect cannot be removed by tuning the robustness and taper parameters in imaging, nor by iterating the CLEAN algorithm. We also performed self-calibration, but the noise level remains within ±10%–20%, depending on the direction (NE, NW, SE, SW) and the frequency. Therefore, hereafter we only show our results without taking self-calibration.
4 Result
We first report compact sources found in the CZ1359 field, and then explore diffuse sources. As mentioned, visibility data were imaged with the robustness r = 0.5 for compact sources and r = 2.0 for diffuse sources to optimize each detection.
4.1 Compact sources
Radio compact sources which have fluxes larger than the detection limit (>5σ) were explored, and 12 reliable compact sources were found. Here, by eye, we rejected several spurious sources (not listed) which were unreliable in the two senses that (i) they only appear in less than half of the 128 MHz band images, or (ii) their positions depend on frequency and move beyond angular resolutions. The locations of the detected compact sources are shown in figure 2 with alphabetic labels from east to west. The spectra of these sources are shown in figure 3.
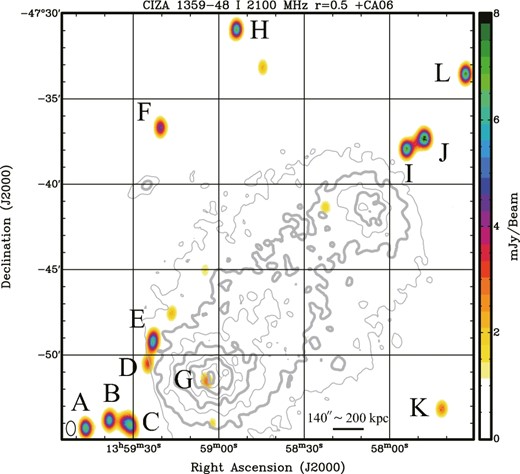
Total intensity map of CZ1359 at 2100 MHz with a 2048 MHz bandwidth and with CA06 baselines. Gray contours show the X-ray surface brightness (Kato et al. 2015). (Color online)
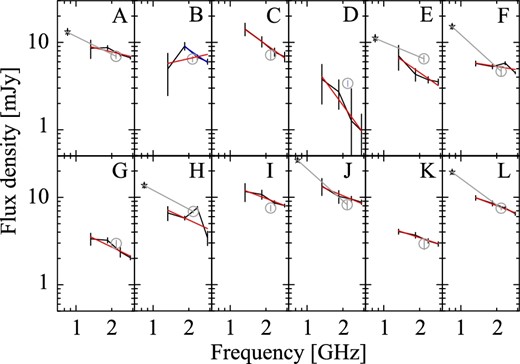
Radio intensity spectra for 12 compact sources in the CZ1359 field. Solid lines and gray circles show the ATCA 512 MHz and 2048 MHz bandwidth data, respectively. Stars indicates the data of SUMSS. Red lines are best fits of the ATCA 512 MHz data only. The blue line for Source B is the best fit without the bottom band data (see the text). Gray lines are best fits of the SUMSS + ATCA 2048 MHz bandwidth data. (Color online)
Summary of compact sources in the CZ1359 field.
| ID | Right ascension | Declination | This work* | αobs | TGSS† | SUMSS‡ | 2MASX | |$\alpha _{\rm obs}^{\rm SUMSS+ATCA}$| |
|---|---|---|---|---|---|---|---|---|
| (error in arcsec) | (error in arcsec) | (mJy beam−1) | (mJy beam−1) | (mJy beam−1) | ||||
| A | 13:59:46.536 (1.139) | −47:54:14.37 (0.975) | 6.96 ± 0.44 | 0.33 | 18.32 | 13.2 ± 1.2 | — | 0.67 |
| B | 13:59:37.828 (1.342) | −47:53:52.25 (1.142) | 6.45 ± 0.47 | 0.94 | 16.16 | — | — | |
| C | 13:59:31.085 (1.455) | −47:54:06.73 (1.239) | 7.16 ± 0.92 | 0.98 | 21.76 | — | Yes | |
| D | 13:59:24.841 (1.613) | −47:50:19.07 (1.431) | 3.39 ± 0.26 | 1.86 | — | — | Yes | |
| E | 13:59:22.770 (1.625) | −47:49:05.25 (1.411) | 6.53 ± 0.57 | 0.95 | — | 11.2 ± 1.1 | Yes | 0.57 |
| F | 13:59:19.316 (1.559) | −47:36:41.85 (1.344) | 4.68 ± 0.51 | 0.22 | 34.83 | 15.2 ± 1.1 | — | 1.24 |
| G | 13:59:03.488 (1.987) | −47:51:33.62 (1.709) | 2.99 ± 0.26 | 0.66 | — | — | Yes§ | |
| H | 13:58:53.790 (1.151) | −47:30:55.74 (0.985) | 6.89 ± 0.26 | 0.63 | 17.39 | 13.7 ± 1 | — | 0.72 |
| I | 13:57:53.588 (1.382) | −47:37:48.99 (1.186) | 7.49 ± 0.57 | 0.51 | 45.39 | — | Yes | |
| J | 13:57:47.991 (1.508) | −47:37:19.39 (1.290) | 8.28 ± 0.89 | 0.57 | 44.29 | 26.4 ± 1.3 | — | 1.22 |
| K | 13:57:41.723 (0.975) | −47:53:03.78 (0.827) | 2.94 ± 0.41 | 0.44 | 16.04 | — | — | |
| L | 13:57:33.947 (1.271) | −47:33:33.36 (1.086) | 7.49 ± 0.34 | 0.52 | 64.88 | 19.4 ± 1.1 | — | 1.00 |
*Flux at 2100 MHz.
†Flux at 150 MHz.
‡Flux at 843 MHz.
§See also the text.
We checked TGSS images and the SUMSS catalog to look for possible counterpart emission, where the search range was set to be 30″ (about one and a half beam size) in radius. We also searched for possible association of extragalactic objects using the NASA Extragalactic Database (NED). The results found in TGSS (150 MHz) images, the SUMSS (843 MHz) catalog, and the 2MASX (near-infrared) database are listed in table 2. The spectral index, |$\alpha _{\rm obs}^{\rm SUMSS+ATCA}$|, was derived using the SUMSS data and our 2048 MHz bandwidth data.
It is found that Source G, which has no TGSS or SUMSS counterparts, is located near the center of the SW cluster 2XMM J135904.3−475125 (13:59:04.3, −47:51:25). A superposed map at 2292 MHz is shown in figure 4, where the coordinate errors of right ascension and declination are |$1{^{\prime\prime}_{.}} 42\hbox{ and }1{^{\prime\prime}_{.}} 23$|, respectively, and the beam major/minor axes are |$19{^{\prime\prime}_{.}} 79 \times 17{^{\prime\prime}_{.}} 23$|. The peak position of the radio emission deviates from that of the X-ray by about one beam size (∼20″ or ∼30 kpc at z = 0.07). It also deviates from the central galaxy 2MASX J13590381−4751311 (13:59:03.8, −47:51:31), and a nearby galaxy 2MASX J13590223−4751502 (13:59:02.2, −47:51:50) each by about half a beam size. The size of Source G is at least smaller than ∼40 kpc and the spectral index is 0.66. These features could be explained by AGN emission in the cluster or background, the host galaxy of which is one of the two 2MASX sources or is too faint to list in the 2MASX catalog. With the spectral index of 0.66, the expected flux densities at 150 MHz and 843 MHz are 17.1 mJy and 5.46 mJy, both of which are below the detection limits of TGSS and SUMSS, respectively.
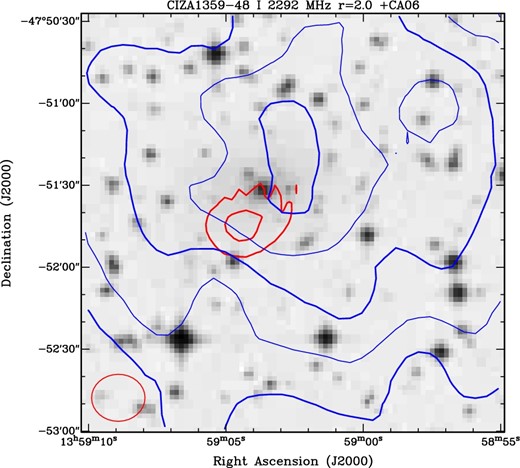
Superposed image near the center of southeast sub-cluster of CZ1359. Background is the DSS optical image. Blue contours are the Suzaku X-ray surface brightness. Red contours are 2.3 GHz radio continuum images for a 128 MHz bandwidth with levels of 1 mJy beam−1 (5.4σ) and 2 mJy beam−1 (10.7σ). Also shown at the bottom left is the beam size of the radio image. (Color online)
4.2 Diffuse sources
Figure 5a shows the CA06-included Stokes I image at 2036 MHz with a 128 MHz bandwidth, where gray contours represent the X-ray surface brightness (Kato et al. 2015) for reference. We only found compact sources, and did not detect diffuse sources in the CZ1359 field. The CA06-excluded image is also shown in figure 5b. There are apparently extended emissions, but all of them are consistent with compact sources convolved with a low-resolution beam, or noise. Because the largest well-imaged structure (∼20΄) should be enough to detect possible diffuse emission in the CZ1359 field, it is unlikely that we miss the diffuse emission due to a lack of short baselines of the interferometry. We have checked all 128, 512, and 2048 MHz bandwidth images, and found no diffuse emission among any of them.
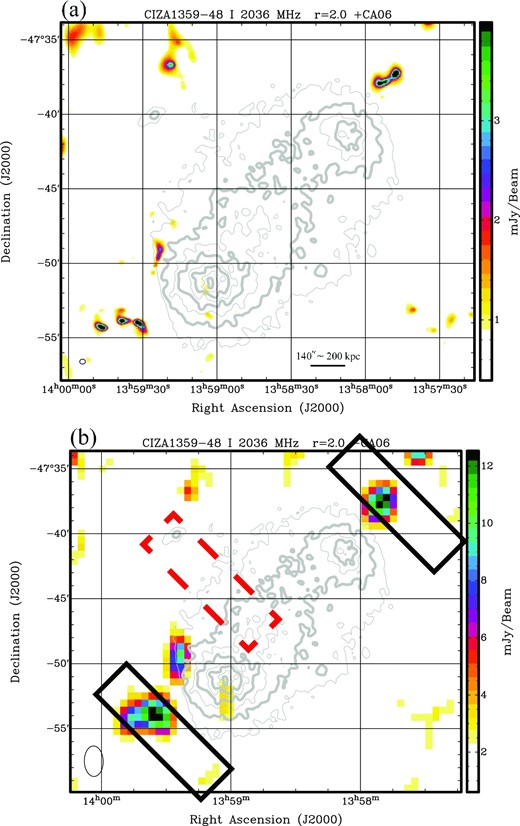
Total intensity map of CZ1359 at 2036 MHz with a 128 MHz bandwidth (a) with CA06 baselines and (b) without CA06 baselines. The color range is shown from 1σ to 10σ rms noise level. Gray contours show the X-ray surface brightness (Kato et al. 2015). The black solid and red dashed boxes indicate 10΄ × 3΄ areas in which radio relics are expected in the late- and early-stage of cluster merger, respectively; the latter is associated with the observed X-ray shock front (Kato et al. 2015; subsection 5.4). (Color online)
Let us consider a typical, bright diffuse emission, i.e. radio halo and relic, possessing a surface brightness of 1 μJy arcsec−2 at 1.4 GHz with αobs ∼ 1 (Feretti et al. 2012). For the SUMSS at 843 MHz with a beam size of 2295 arcsec2, the brightness becomes 3.8 mJy beam−1 or only ∼3 times its sensitivity limit. Meanwhile, for our observation at 2.1 GHz with beam size 14126 arcsec2 (without CA06), the brightness becomes 9.5 mJy beam−1 or ∼20–30 times the achieved sensitivity limit. Therefore, our non-detection firmly excludes the presence of bright diffuse emission in the CZ1359 field. Even a faint case of 0.1 μJy arcsec−2 is excluded at a ∼3σ level.
We adopt DL(z = 0.07) ∼ 9.74 × 1024 m for the cosmological parameters H0 = 70 km s−1 Mpc−1, ΩM = 0.3, and ΩΛ = 0.7. The noise level is Irms = 0.5 mJy beam−1 at 1.4 GHz, where the beam size (Abeam) at 1396 MHz is 955.9 arcsec2 with CA06 and 29741 arcsec2 without CA06. The upper-limit area is determined such that radio relics typically extend over a size several times larger than the cores of merging galaxy clusters (Feretti et al. 2012). If we consider a relatively large (i.e., conservative) upper-limit area of 30 arcmin2 shown in figure 5, we obtain the upper limit of radio power at 1.4 GHz to be P1.4 = 6.34 × 10²² W Hz−1 with CA06 and P1.4 = 1.14 × 10²² W Hz−1 without CA06. If we consider a typical, large radio halo with an area of 1 Mpc2 (Feretti et al. 2012) or 144 arcmin2 in the CZ1359 field, we obtain P1.4 = 1.39 × 10²³ W Hz−1 with CA06 and 2.49 × 10²² W Hz−1 without CA06.
Figure 6 shows the LX–P1.4 relation taken from Feretti et al. (2012). The arrow depicts the upper limit of CZ1359, P1.4 = 1.14 × 10²² W Hz−1, against the X-ray luminosity, LX = 3.14 × 1044 erg s−1, derived from the Suzaku X-ray observation (Kato et al. 2015). Here, so as to compare with the other ROSAT data in Feretti et al. (2012), we derived the 0.1–2.4 keV luminosity from the bolometric luminosity, temperature, and metal abundance. We summed up the X-ray luminosities of the two sub-clusters as the total X-ray luminosity of the system, following studies of other clusters.
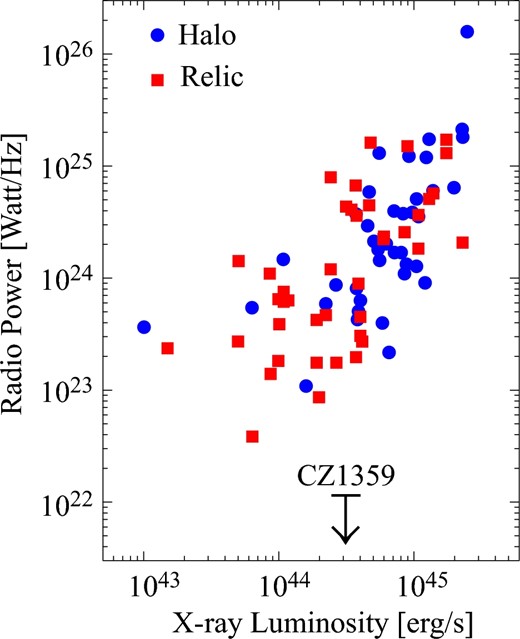
Correlation between the radio power at 1.4 GHz and the 0.1–2.4 keV X-ray luminosity of 39 radio relics (red squares) and 41 radio halos (blue circles), all taken from Feretti et al. (2012). The black arrow indicates the upper limit of this work for a radio relic derived in section 4. (Color online)
The upper limit of CZ1359 falls by one to two orders of magnitude lower than the LX–P1.4 relation. This observation first determined a strong upper limit of radio emission for a known intracluster shock with |$\mathcal {M} \sim 1.3$|. To date, there are several observations which introduce similar upper limits of Mpc-scale radio emission with the radio power of ≲1023 W Hz−1 around the X-ray luminosity of ∼1044–1045 erg s−1 (not shown, as it makes the plot crowded; see, e.g., Kale et al. 2015). The upper limit of CZ1359 is a factor of several lower than the limits obtained in previous works.
5 Discussion
The non-detection of diffuse radio emission in the CZ1359 field may be ascribed to various reasons. One of the potential explanations would be the collision impact parameter and viewing angle, both of which can alter apparent morphology (e.g., Akahori & Yoshikawa 2010). While this geometrical dilution of radio halos and mini-halos is not well-known, relics can be significantly diluted if the shock surface is nearly perpendicular to the line-of-sight (LOS). However, Kato et al. (2015) discussed bulk velocities of member galaxies and concluded that the collision takes place almost parallel to the sky plane. Therefore, the geometrical effect could be minor.
At the X-ray shock front, the expansion speed of the post-shock region is estimated to be 2400 km s−1 (Kato et al. 2015). Since the apparent thickness of the shock-heated region is 120″ (168 kpc), the shock age is expected to be 68 Myr. This timescale is at least one order of magnitude shorter than the GeV electron cooling time (Sarazin 1999). Therefore, the underluminous radio emission cannot be caused by synchrotron cooling.
A more realistic explanation would be that CRes are not accelerated and/or magnetic fields are not amplified enough, and hence synchrotron emission is too weak to be observed. In order to argue the possibilities, we discuss CRe content and magnetic-field strength below. For this purpose, we consider potential radio relic regions each with a size of 10΄ × 3΄, as shown in figure 5b. The red dashed box indicates the X-ray shock region (Kato et al. 2015), and the black solid boxes corresponds to potential late-stage shock regions.
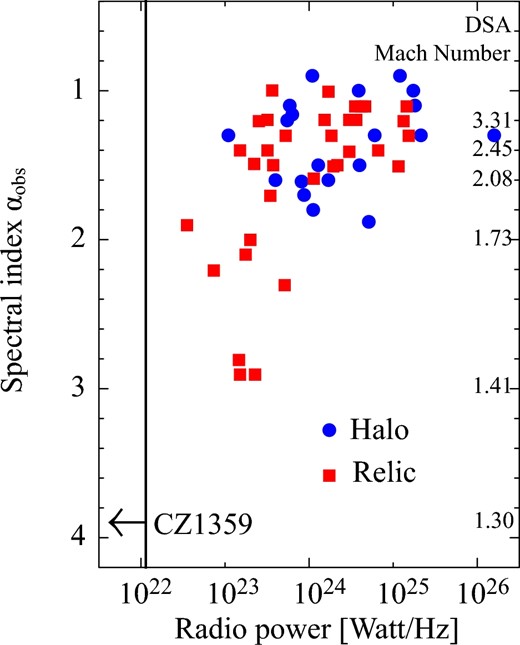
Correlation between the radio power at 1.4 GHz and the spectral index αobs, all taken from Feretti et al. (2012). The black arrow indicates the constraint on CZ1359 from the present work (see text for details). (Color online)
Under the assumption of the minimum energy equipartition (appendix 2), the steep spectrum of p = 7.8 for the X-ray shock gives a very small CRe density and negligible intensity I ∼ 1.06 × 10⁻⁸f−1 mJy beam−1, where f is the ratio of the cosmic-ray energy density over the cosmic-ray electron energy density. Therefore, the non-detection of diffuse radio emission at the X-ray shock front can be explained by the standard DSA scenario.
As a cross-check, let us consider a case in which CZ1359 hosts a α ∼ 1.5 relic or halo, but is just dim. Our upper limit of 0.5 mJy beam−1 at 1.4 GHz and representative values (p, γmin, γmax, Dlos) = (3, 200, 3000, 1 Mpc) gives B < 0.682f μG, where Dlos is the depth of the shock along the LOS. γmin and γmax are the minimum and maximum Lorentz factor of the cosmic-ray electrons, respectively. The upper limit is approximately proportional to |$\gamma _{\rm min}^{-1}$| for 50 ≤ γmin ≤ 600, and changes by only a few percent for γmax > 3000. The upper limit excludes the presence of strongly-magnetized shocks with |$\mathcal {M} \gtrsim 2$| in the standard DSA scenario. The upper limit also gives the limit of the cosmic-ray electron density, nce < 6.03 × 10⁻¹¹f cm−3. With the mean thermal electron density at a potential late-stage shock, ne ∼ 0.5 × 10⁻³ cm−3 (Kato et al. 2015), the injected fraction of CR electrons is ξe = nce/ne < 1.21f × 10−7. This value is small compared to the efficiency estimated for a M ∼ 2–4 shock, ξe ∼ 10−3–10−6 (see, e.g., Kang & Ryu 2013; Vazza & Brüggen 2014). Finally, the upper limit gives rather loose upper limits of the non-thermal to thermal energy budget, εNT/εT < 4.0f 2% and <3.1f 2% for the temperature Te = 4.6 × 10⁷ K (north) and Te = 5.8 × 10⁷ K (south), respectively (Kato et al. 2015).
Note that we have used the Mach number measured from the X-ray observation. However, an inconsistency among the Mach numbers derived from X-ray and radio observations has been reported in the literature (e.g., Akamatsu & Kawahara 2013; Ogrean et al. 2013; Itahana et al. 2015). Therefore, there might exist a discrepancy between a radio-derived spectral index and an X-ray-derived spectral index.
Finally, let us consider the picture beyond the DSA. A simple DSA model assumes that cosmic rays are well-accelerated with sufficient acceleration time. This may not be the case for the X-ray shock with an age of 68 Myr (Kato et al. 2015), in that both field amplification and particle acceleration may be in progress, resulting in the synchrotron emission being too weak to be detected. This scenario implies a weak pre-amplified magnetic field and fewer seed cosmic-ray electrons in the linking region of the cluster. Nevertheless, low-energy cosmic-ray electrons, which emit radio synchrotron at low frequencies and not in the GHz band, may exist on some level. Thus, low-frequency deep observations will be an important next step.
Recently, Fujita et al. (2015) and Fujita, Akamatsu, and Kimura (2016) proposed that cluster diffuse radio emission can be produced through the second-order Fermi (re-)acceleration, which is different from the DSA (the first-order Fermi acceleration, see also Kang et al. 2017). Even if the second-order Fermi acceleration is taking place, electrons may not have had enough time to be accelerated, or scatterers of electrons (e.g., turbulence) may not have developed well behind the shock. Numerical simulations suggest that the early-stage merging clusters have relatively weak turbulence, which is also consistent with non-detection of radio halo in CZ1359.
6 Conclusion
We conducted an ATCA 16 cm observation of a merging galaxy cluster, CIZA J1358.9−4750 (CZ1359). In the CZ1359 field, we first obtained a significant upper limit of diffuse emission, which was about one order of magnitude lower than was estimated using the X-ray luminosity–radio power relation for bright radio halos and relics. Therefore, an environment of this merging-cluster system is different from the clusters possessing typical, bright radio halos and relics. Using the upper limit of total intensity and assuming a model of shock acceleration, we first derived non-thermal properties at the X-ray shock front and potential shock fronts in CZ1359.
Because a steep spectral index is expected due to a low (∼1.3) Mach number, low-frequency deep observations with Murchison Widefield Array (MWA) and Giant Metrewave Radio Telescope (GMRT) are important to investigate possible diffuse radio emission in the CZ1359 field further. In future, the Square Kilometre Array (SKA) and its precursors, Australian SKA Pathfinder (ASKAP) and MeerKAT, will provide an unprecedented sensitivity in the Southern hemisphere (Johnston-Hollitt et al. 2015). They will advance the study of this cluster significantly.
Acknowledgments
The authors acknowledge Mr. Lijo Thomas George and Dr. Ruta Kale for their kind attention and checking of TGSS and GLEAM data. The authors would also like to thank the anonymous referee for his/her constructive comments and suggestions. This work was supported in part by JSPS KAKENHI Grant Numbers 26400218(MT), 15H03639(NK, TA), 15K05080(YF), 15K17614(TA), and by an University Research Support Grant from the National Astronomical Observatory of Japan (NAOJ). The Australia Telescope Compact Array is funded by the Commonwealth of Australia for operation as a National Facility managed by CSIRO.
Appendix 1 Flux scale
Since there is no previous 16 cm observation of the CZ1359 field, we tried to verify our flux scale by comparing our result with the survey data of TGSS (150 MHz) and SUMSS (843 MHz). The comparison was performed for a bright compact source SUMSS J140033−473800 (14:00:33.5, −47:38:00) in the CZ1359 field. We carried out the linear fit for the spectrum using data at 1844, 2356, and 2868 MHz with each 512 MHz bandwidth. Here, the lowest band at 1332 MHz was not used for the fit, since it may contain large uncertainties derived from the data at <1.5 GHz (shown in figure 1). We used the images made with the robustness r = 2.0, which was the one used to estimate the upper limit of diffuse emission in this paper. We find that the spectral index is αobs = 0.85, which implies that the source is likely an unresolved Fanaroff–Riley radio galaxy rather than a quasar with a flat spectral index. If this is the case, the slope could extend to lower frequency bands (e.g., Farnes et al. 2014). The extrapolation of the fit gives 129.76 mJy at 843 MHz and 562.88 mJy at 150 MHz, which are in agreement with 130.6 mJy at 843 MHz (SUMSS) and 573 mJy at 150 MHz (TGSS), respectively, on an error level of a few percent (figure 8). Therefore, we conclude that the flux scale of our observation is reasonable and our upper limit of diffuse emission is reliable. Note that we also performed such a comparison for images with different robustness and bandwidth, and obtained an uncertainty of typically ∼10%–20% on the flux scale.
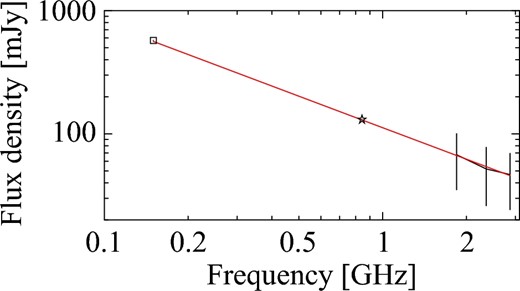
Total intensity spectrum of SUMSS J140033−473800. The black solid line with error bars show the ATCA 512 MHz data with CA06 and r = 2.0. The square and star indicate the data of TGSS and SUMSS, respectively. The red line is the best fit of the ATCA 512 MHz data. (Color online)
Appendix 2 Synchrotron radiation from cosmic-ray electrons
We summarize the derivation of non-thermal properties referred in this paper. A similar derivation can be seen in, for example, Govoni and Feretti (2004).
While p is positive and steep, nce and εce are insensitive to γmax and we choose γmax = 3000. Actually, they change only by a few percent as we vary γmax from 3000 to infinity in the case of p = 3. Meanwhile, they significantly depend on γmin. We choose γmin = 200 as a representative value, because CRes with γ ∼ 300 have the longest cooling timescale and could be a dominant component in a typical cluster environment (Sarazin 1999).
Footnotes
The largest well-imaged structure of 1-d observation is ∼230″ at 6 cm with the 750 m configuration (sub-subsection 1.7.1 of ATCA Users Guide 〈http://www.narrabri.atnf.csiro.au/observing/users_guide/html/atug.html〉). It scales 230″ × 2 × 16/6 ∼ 20΄ at 16 cm with the 367 m configuration.
The ATCA uses dual linear orthogonal feeds to measure two orthogonal linear polarizations simultaneously. The position angle of the polarization splitter is stationary with respect to the altra-azimuthal-mounted antennas and so rotates on the sky.
References
