-
PDF
- Split View
-
Views
-
Cite
Cite
Hiroshi Nakajima, Yoshitomo Maeda, Hiroyuki Uchida, Takaaki Tanaka, Hiroshi Tsunemi, Kiyoshi Hayashida, Takeshi G Tsuru, Tadayasu Dotani, Ryo Nagino, Shota Inoue, Masanobu Ozaki, Hiroshi Tomida, Chikara Natsukari, Shutaro Ueda, Koji Mori, Makoto Yamauchi, Isamu Hatsukade, Yusuke Nishioka, Miho Sakata, Tatsuhiko Beppu, Daigo Honda, Masayoshi Nobukawa, Junko S Hiraga, Takayoshi Kohmura, Hiroshi Murakami, Kumiko K Nobukawa, Aya Bamba, John P Doty, Ryo Iizuka, Toshiki Sato, Sho Kurashima, Nozomi Nakaniwa, Ryota Asai, Manadu Ishida, Hideyuki Mori, Yang Soong, Takashi Okajima, Peter Serlemitsos, Yuzuru Tawara, Ikuyuki Mitsuishi, Kazunori Ishibashi, Keisuke Tamura, Takayuki Hayashi, Akihiro Furuzawa, Satoshi Sugita, Takuya Miyazawa, Hisamitsu Awaki, Eric D Miller, Hiroya Yamaguchi, In-orbit performance of the soft X-ray imaging system aboard Hitomi (ASTRO-H), Publications of the Astronomical Society of Japan, Volume 70, Issue 2, March 2018, 21, https://doi.org/10.1093/pasj/psx116
Close - Share Icon Share
Abstract
We describe the in-orbit performance of the soft X-ray imaging system consisting of the Soft X-ray Telescope and the Soft X-ray Imager aboard Hitomi. Verification and calibration of imaging and spectroscopic performance are carried out, making the best use of the limited data of less than three weeks. Basic performance, including a large field of view of |${38^{\prime }}$| × |${38^{\prime }}$|, is verified with the first-light image of the Perseus cluster of galaxies. Amongst the small number of observed targets, the on-minus-off pulse image for the out-of-time events of the Crab pulsar enables us to measure the half-power diameter of the telescope as ∼|${1 {^{\prime}_{.}} 3}$|. The average energy resolution measured with the onboard calibration source events at 5.89 keV is 179 ± 3 eV in full width at half maximum. Light leak and crosstalk issues affected the effective exposure time and the effective area, respectively, because all the observations were performed before optimizing an observation schedule and the parameters for the dark-level calculation. Screening the data affected by these two issues, we measure the background level to be 5.6 × 10⁻⁶ counts s−1 arcmin−2 cm−2 in the energy band of 5–12 keV, which is seven times lower than that of the Suzaku XIS-BI.
1 Introduction
Extra-solar X-ray astronomy has been advanced in the advent and utilization of state-of-the-art instruments. Key features of the instruments are imaging and spectroscopic capabilities and wide-band coverage. The X-ray imaging capability jumped when the first Wolter-I-type telescope was launched by sounding rocket (Rappaport et al. 1979). Further improvement was achieved with Einstein (Giacconi et al. 1979) and ROSAT (Truemper 1982). Energy resolution increased with the adoption of an X-ray CCD, which was first realized by ASCA (Tanaka et al. 1994), simultaneously extending the energy band up to 10 keV. This achievement was followed by Chandra (Weisskopf et al. 2002), XMM-Newton (Jansen & XMM Science Operations Team 2000), Swift (Burrows et al. 2005), and Suzaku (Mitsuda et al. 2007). Wide-band coverage was at first realized by combining soft X-ray telescopes and hard X-ray detectors like those aboard BeppoSAX (Boella et al. 1997), Suzaku, and ASTROSAT (Singh et al. 2014). NuSTAR (Harrison et al. 2013) broadened the energy range of X-ray telescopes up to ∼80 keV,
which was achieved using mirrors with depth-graded multilayer coating and CdZnTe detectors. In this context, ASTRO-H (Takahashi et al. 2016) increased the energy resolution drastically with wide-band coverage.
ASTRO-H, the Japan-led X-ray observatory, was launched on 2016 February 17 from Tanegashima Space Center. It was successfully put into a planned low Earth orbit (LEO) and named Hitomi (a Japanese word for the pupil of the eye). It is characterized by wide-band imaging spectroscopy from soft X-rays (0.3 keV) to soft gamma-rays (600 keV) and by high-resolution non-dispersive spectroscopy in soft X-rays. The soft X-ray imaging system, one of the four mission instruments, consists of the Soft X-ray Telescope (SXT-I: Serlemitsos et al. in preparation) and the Soft X-ray Imager (SXI: Tanaka et al. 2018).
The detailed specification and the ground calibration of the SXT-I and the SXI are described in other papers (Mori et al. 2013; Iizuka et al. 2014, 2018; Sato et al. 2014, 2016b, 2016c; Maeda et al. 2016; Kurashima et al. 2016; Kikuchi et al. 2016; Inoue et al. 2016; Hayashi et al. 2016; Tanaka et al. 2018). This paper focuses on the in-orbit performance of the soft X-ray imaging system achieved by fully utilizing the data obtained in the unexpectedly short mission life. After describing the soft X-ray imaging system and initial operations in sections 2 and 3, respectively, we summarize our observations in section 4 and note two issues that affect the imaging and spectroscopic performance in section 5. The primary calibration items are highlighted in section 6, followed by a summary in section 7. Errors quoted in this paper are at the 90% confidence level.
2 The soft X-ray imaging system
The basic design of the SXT-I (P. Serlemitsos et al. in preparation) is the same as that of Suzaku XRT (Serlemitsos et al. 2007). Thin Al foils with Au-coated surfaces are nested in a confocal way to form conically approximated Wolter-I-type optics. This type of telescope provides a relatively high effective area per unit mass compared with the accurate Wolter-I-type telescope aboard Chandra (Weisskopf 2012). Improvement of the uniformity of the housing quality and alignment structure and the consistent quality of the flight reflectors lead to remarkably improved quality of image over Suzaku XRT. The on-axis angular resolution of the SXT-I in the 1.5–17.5 keV band was measured to be |${1 {^{\prime}_{.}} 3}$|–|${1 {^{\prime}_{.}} 5}$| in a half-power diameter (HPD) by the on-ground calibration (Iizuka et al. 2018).
The SXI adopts P-channel back-illumination-type CCDs manufactured by Hamamatsu Photonics K.K. (Tanaka et al. 2018). The thin surface dead layer allows high quantum efficiency in soft X-rays and high tolerance against impacts of micrometeoroids. The depletion layer of 200 μm (Tsunemi et al. 2008) is substantially thicker than that of the Suzaku X-ray Imaging Spectrometer (XIS)-BI (42 μm: Koyama et al. 2007), which enhances quantum efficiency for X-rays above 6 keV. Four CCDs (hereafter CCD1, CCD2, CCD3, and CCD4, respectively) are placed in a 2 × 2 array at the focal plane of the SXT-I and form an imaging area with a size of ∼60 mm × 60 mm.
The SXI consists of four components: the sensor (SXI-S), the pixel processing electronics (SXI-PE), the digital electronics (SXI-DE), and the cooler driver (SXI-CD). The SXI-S includes the CCDs and the single-stage Stirling coolers (SXI-S-1ST), as well as analog electronics for driving the CCDs (SXI-S-FE) and for processing the output signals from the CCDs (Video board). The UserFPGA on the mission I/O board in the SXI-PE generates CCD clock patterns and processes digitized frame data from the Video board. The SXI-DE performs further data processing and controls the heaters to keep the CCD temperature constant. It also receives commands from the satellite management unit (SMU) and sends telemetry, including the frame and housekeeping data, to the SMU and the data recorder of the spacecraft. The detailed design and specification of the SXI components are summarized in Tanaka et al. (2018).
Combining the SXT-I and the SXI, we realize an imaging system with a focal length of 5.6 m and a field of view (FoV) of |${38^{\prime }} \times {38^{\prime }}$|. This is the largest FoV among focal plane X-ray detectors that cover up to 10 keV. A large effective area and the FoV yield a large collecting power, grasp = A · Ωeff, where A is the effective area and Ωeff is the effective FoV. The soft X-ray imaging system provides a grasp of 54 cm2 deg2 at 7 keV, the largest among the focal plane X-ray CCD detectors (Nakajima 2017). These characteristics are not only complementary to the narrow-field, high-resolution spectroscopy of the Soft X-ray Spectrometer (SXS: Kelley et al. 2018), but also enable us to observe extended objects such as clusters of galaxies and Galactic supernova remnants with a single pointing.
3 Initial operations
Following the critical operations such as the deployment of the solar paddles and the extension of the extensible optical bench, mission instruments were started up sequentially. The startup procedures of the SXI began 13 days after the launch with the steps summarized in table 1. Function and performance checks were carried out during the procedures as described in the following subsections. The SXI switched to the regular event mode on 2016 March 7 after the initialization of the dark level.
| Date in 2016 . | Operation . |
|---|---|
| (UTC) . | . |
| March 2 | SXI-DE and SXI-PE power on and initialization |
| March 3 | SXI-S-FE power on and initialization |
| Load microcodes for inverse transfer mode | |
| Activate autonomous commands for South Atlantic Anomaly (SAA) | |
| March 4 | Readout noise check with frame images |
| Load microcodes for observation modes | |
| SXI-CD power on | |
| March 5 | SXI-S-1ST power on |
| March 6 | SXI-S-1ST increase voltage |
| March 7 | Initialize dark level and switch to the event mode |
3.1 Readout noise
Frame images were obtained just after the startup of the front-end electronics. Because the CCDs were not yet cooled, significant charges due to dark current were generated in the sensors. Therefore, we transferred the charges in the serial register toward the direction opposite from the readout node to measure the readout noise. The standard deviations of the pulse height (PH) distributions in the frame images were measured for all the segments. The noise levels were distributed over a range of 4.3–5.3 ch (analog-to-digital unit) for all the segments over 70 continuous frames. While the scale between the PH and the incident X-ray energy depends on the gain of each analog-to-digital converter (ADC), 1 ch approximately corresponds to 6 eV. Parameters for event detection and the dark level calculation should be determined according to the readout noise level. The values obtained in orbit agree with those measured in the ground tests. Therefore, we determined that the initial values of all the parameters, such as split thresholds and dark thresholds, should be the same as those adopted in the ground tests.
3.2 CCD temperature
The CCDs and a cold plate are cooled using one of the two SXI-S-1ST. Two heaters are attached to the cold plate, and application software in the SXI-DE controls the sensor temperature by applying an electrical current to the heaters using a proportional-integral-derivative controller (Tanaka et al. 2018). Considering the possible accumulation of contaminants, including water, onto the CCDs and the consequent degradation of quantum efficiency in the soft energy band, we set the operating temperature to −110°C in the initial phase of the mission. Because charge transfer efficiency significantly changes as a function of the CCD temperature (Mori et al. 2013), it is crucial to keep the temperature constant during observations for better spectroscopic performance. The temperatures of all the CCDs were stable within three digits corresponding to 0.24°C peak to peak throughout the mission.
3.3 Charge injection
We found that the charge transfer inefficiency (CTI) of the SXI CCDs is not negligibly small in the ground calibration (Tanaka et al. 2018). Although we conjecture that the initial CTI is due to lattice defects in the wafer or defects in the interface between the silicon substrate and the oxide layer, its cause has not been identified. Therefore, the charge injection (CI) capability was utilized from the beginning on the mission. Although the structures of the injecting gate and drain are different from those of the XIS (Nakajima et al. 2008), we adopted the spaced-row CI method as applied to the XIS (Ozawa et al. 2009; Uchiyama et al. 2009). The interval and the offset of the injected rows are 80 logical pixels and 1 in ACTY coordinate, respectively, as those adopted in the ground tests [for ACT coordinates (ACTX, ACTY), see figure 7 in Tanaka et al. (2018)]. The amount of injected charge is so set that the PHs of the injected pixels are saturated but their leakages to the preceding and trailing rows do not affect the spectroscopic performance.
The PH distribution as a function of ACTY is investigated by measuring the amount of injected and leaked charges. Figure 1 shows an example of the dark frame image of CCD4 Segment CD obtained after the CCD temperature becomes stable. PHs averaged for each row of the image are also shown. Note that the PHs of injected rows (ACTY = 1 + 80 × n, n = 0–7) are saturated and hence they are out of range in the abscissa in the right panel. Only the first trailing rows (ACTY = 2 + 80 × n) exhibit excess of PHs by approximately 20 ch compared with other rows. The second trailing rows (ACTY = 3 + 80 × n) and the preceding rows show a small amount of excess of ≤5 ch. This value is certainly lower than the split threshold of 15 ch that has been adopted since the ground tests. Because an event is composed of 3 × 3 pixels, the PH value of the event may not be valid if part of the 3 × 3 pixels belongs to the injected rows or the first trailing rows. Then we filter out events in the standard screening if their centers fall in regions from the first preceding to the second trailing rows.
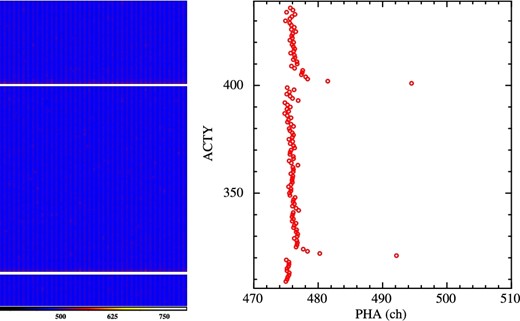
(Left) Part of dark frame image of CCD4 Segment CD in the ACT coordinates obtained during the observation of the Perseus cluster of galaxies. The color scale indicates the PH of each pixel. (Right) PH averaged for each row (ACTY) of the left image. Note that the PHs at the injected rows (ACTY = 321 and 401) are out of the range in the abscissa. (Color online)
4 Observations
Comprehensive checks on functions were followed by the scientific observations and calibrations. Table 2 summarizes the observation logs of all the celestial objects. Other pointings for the purposes of checking the attitude and orbit control subsystem (AOCS) are omitted. All the observations were performed with the clocking mode of “Full Window + No Burst” except for the Crab nebula for which the “Full Window + 0.1-s Burst” mode was chosen for CCD1 and CCD2 to suppress pile-up. Some parameters, such as the event threshold and the area discrimination, were changed especially for the interval when the minus Z axis of the spacecraft, the direction from the mirror to the detector along the optical axis, points to the day Earth (MZDYE) as described in section 5. The effective exposure times in table 2 are those excluding the MZDYE intervals. Note that the pointing direction of the SXT-I gradually shifted during the observation of N 132 D (Danziger & Dennefeld 1976; Hitomi Collaboration 2018a), a supernova remnant in the Large Magellanic Cloud, due to unstable behavior of the AOCS. The observation of IGR J16318−4848 (Courvoisier et al. 2003; Hitomi Collaboration 2018b), a highly obscured high mass X-ray binary, was performed before optimizing the alignment matrices of the star trackers (STT), which resulted in off-axis angles of |${8^{\prime }}$| and |${5^{\prime }}$| during the tracking with STT1 and STT2, respectively. Its effective exposure time is the sum of the two intervals. Although the SXS missed both targets during most of the exposure times, we successfully obtained CCD spectra thanks to the large FoV of the SXI.
| Time* . | Target . | Pointing direction . | Exposure . | Clocking mode . | Event threshold‡ . |
|---|---|---|---|---|---|
| . | . | (RA, Dec) in J2000.0.0 . | (ks) . | for CCD1 and CCD2† . | (ch) . |
| 2016-03-06 22:55:00 | The Perseus cluster | (49|$ {^{\circ}_{.}} $|951, +41|$ {^{\circ}_{.}} $|512) | 40.3 | Full Window + No Burst | 40 |
| 2016-03-08 00:38:00 | N 132 D | (81|$ {^{\circ}_{.}} $|246, −69|$ {^{\circ}_{.}} $|646) | 238.0 | Full Window + No Burst | 100 |
| 2016-03-10 19:37:00 | IGR J16318−4848 | (247|$ {^{\circ}_{.}} $|701, −48|$ {^{\circ}_{.}} $|832) | 142.1 | Full Window + No Burst | 100 |
| 2016-03-16 19:40:00 | RX J1856.5−3754 | (284|$ {^{\circ}_{.}} $|144, −37|$ {^{\circ}_{.}} $|909) | 11.4 | Full Window + No Burst | 40 |
| 40(on-axis)/100(others)§ | |||||
| 2016-03-19 17:00:00 | G21.5−0.9 | (278|$ {^{\circ}_{.}} $|388, −10|$ {^{\circ}_{.}} $|569) | 203.3 | Full Window + No Burst | 100|$^\Vert$| |
| 2016-03-23 13:30:00 | RX J1856.5−3754 | (284|$ {^{\circ}_{.}} $|145, −37|$ {^{\circ}_{.}} $|910) | 23.3 | Full Window + No Burst | 40(on-axis)/100(others)♯ |
| 2016-03-25 11:28:00 | The Crab nebula | (83|$ {^{\circ}_{.}} $|633, +22|$ {^{\circ}_{.}} $|013) | 0.242 | Full Window + 0.1-s Burst | 100|$^\Vert$| |
*Time when the maneuver started to the target in coordinated universal time (UTC).
†Clocking mode for CCD3 and CCD4 is always set to “Full Window + No Burst.”
‡Note that 1 ch approximately corresponds to 6 eV.
§We changed the event threshold of all the segments except for the on-axis one from 40 ch to 100 ch from 2016-03-18 18:45, while the event threshold is set to 2048 ch during MZDYE for all the segments throughout the pointing.
‖During MZDYE, the event threshold is set to 100 ch and the area discrimination (100 × 100 logical pixels) is applied to the on-axis segment, while the event threshold is set to 2048 ch and the area discrimination is off for other segments.
♯During MZDYE, the event threshold is set to 40 ch and the area discrimination is applied to the on-axis segment, while the event threshold is set to 2048 ch and the area discrimination is off for other segments.
| Time* . | Target . | Pointing direction . | Exposure . | Clocking mode . | Event threshold‡ . |
|---|---|---|---|---|---|
| . | . | (RA, Dec) in J2000.0.0 . | (ks) . | for CCD1 and CCD2† . | (ch) . |
| 2016-03-06 22:55:00 | The Perseus cluster | (49|$ {^{\circ}_{.}} $|951, +41|$ {^{\circ}_{.}} $|512) | 40.3 | Full Window + No Burst | 40 |
| 2016-03-08 00:38:00 | N 132 D | (81|$ {^{\circ}_{.}} $|246, −69|$ {^{\circ}_{.}} $|646) | 238.0 | Full Window + No Burst | 100 |
| 2016-03-10 19:37:00 | IGR J16318−4848 | (247|$ {^{\circ}_{.}} $|701, −48|$ {^{\circ}_{.}} $|832) | 142.1 | Full Window + No Burst | 100 |
| 2016-03-16 19:40:00 | RX J1856.5−3754 | (284|$ {^{\circ}_{.}} $|144, −37|$ {^{\circ}_{.}} $|909) | 11.4 | Full Window + No Burst | 40 |
| 40(on-axis)/100(others)§ | |||||
| 2016-03-19 17:00:00 | G21.5−0.9 | (278|$ {^{\circ}_{.}} $|388, −10|$ {^{\circ}_{.}} $|569) | 203.3 | Full Window + No Burst | 100|$^\Vert$| |
| 2016-03-23 13:30:00 | RX J1856.5−3754 | (284|$ {^{\circ}_{.}} $|145, −37|$ {^{\circ}_{.}} $|910) | 23.3 | Full Window + No Burst | 40(on-axis)/100(others)♯ |
| 2016-03-25 11:28:00 | The Crab nebula | (83|$ {^{\circ}_{.}} $|633, +22|$ {^{\circ}_{.}} $|013) | 0.242 | Full Window + 0.1-s Burst | 100|$^\Vert$| |
*Time when the maneuver started to the target in coordinated universal time (UTC).
†Clocking mode for CCD3 and CCD4 is always set to “Full Window + No Burst.”
‡Note that 1 ch approximately corresponds to 6 eV.
§We changed the event threshold of all the segments except for the on-axis one from 40 ch to 100 ch from 2016-03-18 18:45, while the event threshold is set to 2048 ch during MZDYE for all the segments throughout the pointing.
‖During MZDYE, the event threshold is set to 100 ch and the area discrimination (100 × 100 logical pixels) is applied to the on-axis segment, while the event threshold is set to 2048 ch and the area discrimination is off for other segments.
♯During MZDYE, the event threshold is set to 40 ch and the area discrimination is applied to the on-axis segment, while the event threshold is set to 2048 ch and the area discrimination is off for other segments.
All the event data are once processed using a script, version 03.01.005.005, and subsequently reprocessed using the SXI calibration database that reflects the ground calibration. Results shown hereafter are obtained with the cleaned event files unless otherwise noted. The detailed criteria for the cleaning are summarized in the calibration database (Angelini et al. 2018).1 In the spectral fit with XSPEC (Arnaud 1996), we adopt the model phabs for the photoelectric absorption with a solar metal composition from Wilms, Allen, and McCray (2000) and photoionization cross-sections provided by Balucinska-Church and McCammon (1992).
Figure 2 shows the first-light SXI image of the Perseus cluster of galaxies. We confirm that the FoV of the soft X-ray imaging system covers the central region of the Perseus cluster of galaxies with a diameter of approximately 650 kpc. Events originating from two 55Fe onboard calibration sources are seen at the edges of the FoV. The offset of the center of the four CCDs with regard to the center of the SXS FoV is found to be slightly smaller than the design value, making the center of the SXS FoV nearer to the gaps of the CCDs by |${65^{\prime \prime }}$|. We also compare the images obtained with the SXI and the SXS. The size of a CCD logical pixel is 48 μm, which corresponds to |${1 {^{\prime\prime}_{.}} 768}$|. Thanks to the smaller plate scale compared with that of the SXS (|${29 {^{\prime\prime}_{.}} 982}$| pixel−1), the position and the flux of the point source can be precisely measured.
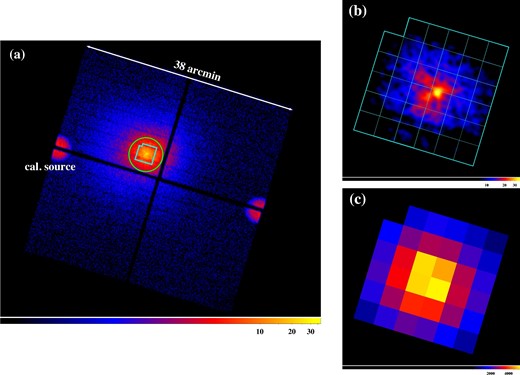
(a) SXI image of the Perseus cluster of galaxies in 0.4–12.0 keV in units of counts per logical pixel smoothed by a Gaussian of σ = 3 pixels. The bright spots at the edge of the FoV are due to the onboard calibration sources. The cyan and green regions illustrate the SXS FoV and the photon extracting region for figure 3, respectively. (b) Same as (a), but the entire FoV region of the SXS is extracted. The regions of the detector pixels are overlaid for comparison with (c). (c) SXS image with the same energy band as (a) and (b). (Color online)
The source and background spectra of the Perseus cluster are shown in figure 3. The source spectrum is extracted from the core region with a radius of |${3^{\prime }}$| as shown in figure 2, while the background spectrum comes from the entire FoV excluding the core region with a radius of |${12^{\prime }}$| and the calibration source regions. The strong emission line of Fe He α (6.7 keV, rest frame), the weak lines of Fe Ly α (7.0 keV), and the mixture of Fe He β and Ni He α (7.8–7.9 keV) can be seen, which demonstrates the spectroscopic performance of the soft X-ray imaging system.
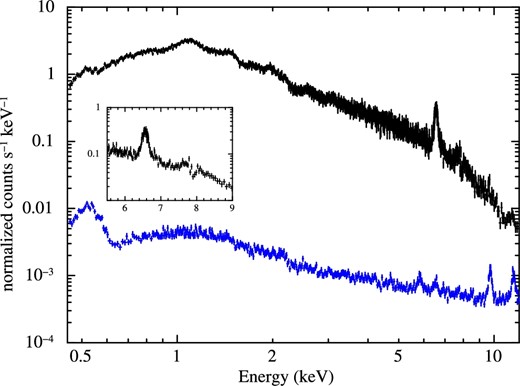
SXI source and background spectra of the Perseus cluster of galaxies in the energy band of 0.45–12.0 keV. The source spectrum (black) is extracted from the circular region with a radius of |${3^{\prime }}$| as shown in figure 2, and the background spectrum (blue) is extracted from the entire FoV excluding a circular region with a radius of |${12^{\prime }}$| and the same center as the source region. The calibration source regions are also excluded. The inset shows a close-up view of the source spectrum near the Fe He α and Fe He β lines. (Color online)
5 Issues found in orbit
Some of the data are affected in terms of the effective exposure time and the effective area by two issues: a light leak and crosstalk. The following subsections elaborate on the problems and the measures taken to ameliorate them.
5.1 Light leak
5.1.1 Light leak during MZDYE
The ground tests in the use of a visible light LED revealed a light leak from pinholes in the optical blocking layer (OBL) on the CCDs (Tanaka et al. 2018). The regions near the physical edges of the CCDs were also found to be sensitive to visible light. Then we thickened the Al layers in the contamination blocking filter (CBF), which was originally implemented to block contaminants on the CCDs, to accommodate the requirements regarding the transmittance of visible and ultraviolet light. The CBF was confirmed to have survived the launch environment with data when the plus Z axis of the spacecraft points to the day Earth. However, it was found that visible light and/or infrared unexpectedly activated the sensor during MZDYE through holes in the base panel of the spacecraft. These incoming lights induced a considerable number of false events at the positions of the pinholes and the physical edges identified in the ground tests.
We define the light leak pixels as those whose median PHs during MZDYE exceed those during non-MZDYE by more than 40 ch. Then approximately 7% of the pixels in the region that corresponds to the SXS FoV are classified as light leak ones. Figure 4 shows an example of the PH history averaged among the light leak pixels in CCD4 Segment AB, which is half the region of the imaging area of CCD4 (for the segment designation, see figure 4 in Tanaka et al. 2018) during the observation of the isolated neutron star RX J1856.5−3754 (Walter et al. 1996). The PH began to increase at the start of MZDYE and became highly time-variable during MZDYE. Because the event threshold was set to 40 ch in this period, a large number of events were produced due to this light leak.

Example history of the PH of the light leak pixels. All the affected pixels in the region of ACTX = 4–316 and ACTY = 7–550 in CCD4 Segment AB are averaged. Intervals, when the minus Z axis points to the day Earth and when to the night Earth, are hatched in yellow and in blue, respectively. (Color online)
To eliminate these false events, we defined a new screening criterion to produce scientifically useful good time intervals. When the minus Z axis of the spacecraft points to the Earth and an elevation angle of the minus Z axis above the day Earth limb is larger than that above the night Earth limb, there is little effect due to the light leak because the boundary between the day Earth and the night Earth is clear. On the other hand, the boundary between the day Earth and the sky is indistinct in terms of the light flux due to the Earth’s atmosphere. In fact, the average PH changes even after MZDYE, as seen in figure 4. Considering these circumstances, we define the screening criterion using the extended housekeeping data as (MZDYE_ELV > MZNTE_ELV) || (MZDYE_ELV > 20), where MZDYE_ELV and MZNTE_ELV are the elevation angles of the minus Z axis of the spacecraft from the day- and night-Earth limbs, respectively, in units of degrees.
5.1.2 Light leak during the Sun illumination of the spacecraft
Even though we can eliminate the light leak effect during MZDYE with the above screening criterion, there is another small effect seen during the Sun illumination of the spacecraft. Figure 5 shows the spectra of the Mn K lines from the onboard 55Fe calibration source detected by CCD4 Segment CD. Note that only the gain difference between two ADCs in the Video board (Nakajima et al. 2013) is corrected, while the charge trail and CTI corrections are not performed. We utilize SUN_ALT, the solar altitude from the Earth limb, in the extended housekeeping data to discriminate between the intervals of Sun illumination of the spacecraft (SUN_ALT > 0) and the eclipse of the spacecraft (SUN_ALT < 0). For further investigation of a possible shift of the line centroid depending on the time after the passage of the SAA (T_SAA_SXI) in units of seconds, we divide the data during the eclipse of the spacecraft into two with a boundary of T_SAA_SXI = 1800 s. The difference in the line centroids between the eclipse and the Sun illumination with T_SAA_SXI > 1800 is 5.8 ± 0.1 ch, which corresponds to approximately 35 eV. We see this effect because the region irradiated with the calibration sources is close to the physical edge of the CCDs that is the most sensitive to the visible light. N 132 D and IGR J16318−4848 were unexpectedly caught at the edge of CCD1 and hence an additional screening with regard to SUN_ALT may be needed after the standard screening.
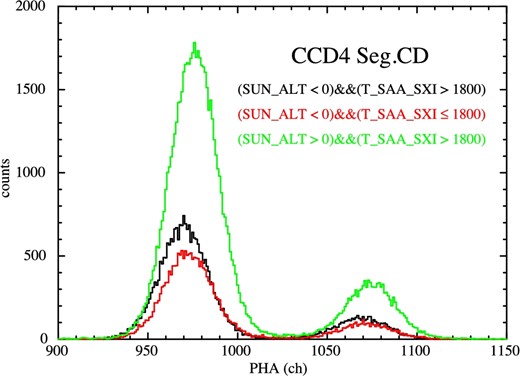
Spectra of the calibration source events obtained with CCD4 Segment CD. Spectrum integrated during the eclipse of the spacecraft (SUN_ALT < 0) and 1800 seconds after the passage of the SAA or later (T_SAA_SXI > 1800) is shown in black. Data during the eclipse but with T_SAA_SXI ≤ 1800 are shown in red, while those during Sun illumination of the spacecraft (SUN_ALT > 0) and T_SAA_SXI > 1800 are shown in green. (Color online)
There is also a small difference in the line centroid between the spectra summed during T_SAA_SXI ≤ 1800 and during T_SAA_SXI > 1800. There may be some charges left, at least near the physical edges of the CCDs, after the passage of the SAA. We stop the sequence of driving and reading out the CCDs during the SAA. Because this operation leads to a considerable amount of charge accumulating in the imaging area, we sweep up the charges just after the passage of the SAA by starting the sequence with the reversed electric field in the substrate. One of the possible reasons for the line shift depending on the time after the passage of the SAA is that the parameters used for sweeping up the charges such as the applied voltages and the duration of the sweeping are not optimized.
5.2 Crosstalk
An extraordinary large signal from a pixel may cause crosstalk with negative polarity to induce an anomalously low PH in the pixel at the same coordinates of the adjacent segment (e.g., Yagi 2012). Such crosstalk produced false events which occupied the telemetry during the initial phase. Figure 6 shows raw frame images from the same parts of adjacent segments obtained at the same time. Charged particles produce a large amount of signal charges along their tracks in the CCDs, and also produce negative signals in the adjacent segment. The PHs of the pixels return to their normal levels in the next frame. Nevertheless, if the negative PHs fall below the lower threshold for the dark level update, anomalously low dark levels are set and kept on the pixels because the original PHs are recognized to be high due to signals by X-rays or charged particles. In this way, the crosstalk produces false events continuously from these pixels. Because the particle events occur randomly in time and position, the crosstalk results in the gradual increase of the event rate. The PHs of the false events are mostly below 100 ch in this case. Also, when the affected pixels are in the 3 × 3 pixels of normal events, the PHs of the events become higher than the true values by similar amounts to the PHs of the false events.
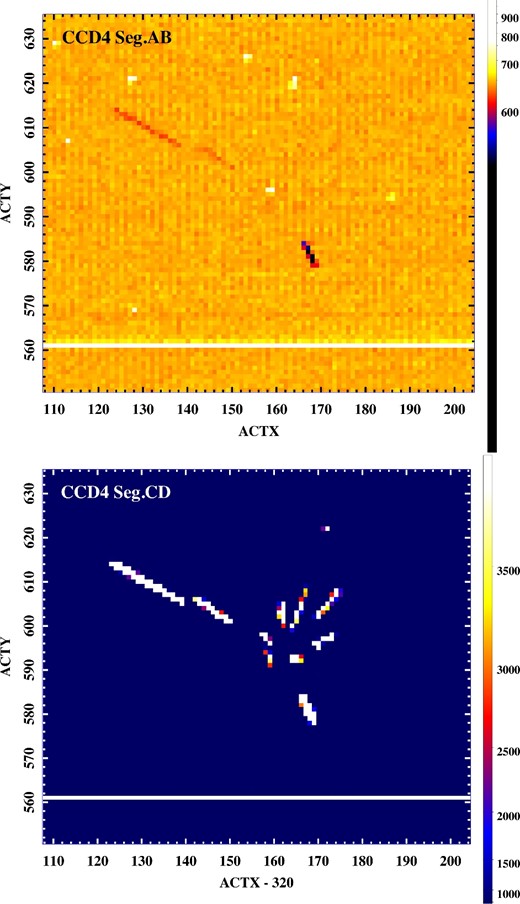
Close-up view of raw frame images obtained with 4 s exposure for the two segments of CCD4 obtained at the same time in orbit. The large number of charges distribute along the tracks of the charged particles in the Segment CD. The pixels in Segment AB, read out at the same time as those in Segment CD with high PHs, exhibit lower PHs compared with those of surrounding pixels. (Color online)
The effect of the crosstalk would not have appeared if we had optimized the threshold for the dark level update so that the negative PHs fell securely within the thresholds. Because the dark level cannot be changed retroactively, we introduce an additional screening for the crosstalk issue in the software sxipipeline. If at least a fraction (R) of the event containing a pixel of interest has a PH greater than, or equal to, a split threshold (|$\mathit {PHA}_{\rm sp}$|) in that pixel, we consider that the pixel is affected by crosstalk, and eliminate it from further analyses. This judgment is applied to all the pixels contained in at least Nmin events. The parameters Nmin, |$\mathit {PHA}_{\rm sp}$|, and R can be adjusted by users. The effect of this additional screening is illustrated with spectra of Mn K lines in figure 7. Because the inappropriate dark levels tend to be slightly lower than the normal values, the PHs of the affected events are slightly higher than those of normal events. This effect induces the high-energy tails that substantially decrease after the screening.
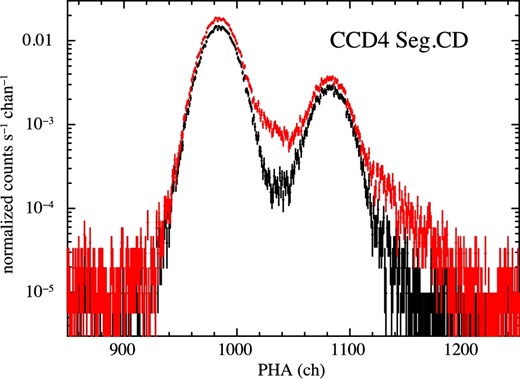
Mn K spectra during the first half of the observation of IGR J16318−4848. Filtering of the affected pixels for crosstalk is applied to the data in black but not for the data in red. The parameters in the filtering are Nmin = 6, |$\mathit {PHA}_{\rm sp} = 15$|, and R = 0.7. (Color online)
Curiously, the polarity of the crosstalk signal is opposite only in the on-axis segment, possibly due to the difference in capacitive and/or inductive coupling along the signal path from the CCDs to the ASICs. Thus the on-axis segment does not suffer from the false events. According to an exposure map summed over the intervals when the spacecraft pointed to the night Earth, the exposure time of the off-axis segments decreases by approximately 17% of that of the on-axis segment.
6 Calibration
6.1 Energy scale and energy response
The energy scale of the SXI is monitored with Mn K α and K β from the calibration sources for all the CCDs. To minimize the effects described in subsection 5.1, we extract the data during the eclipse of the spacecraft and T_SAA_SXI > 1800. The mean PHs show significant fluctuations within the range of ∼2–3 ch, which corresponds to ∼12–18 eV. This can be interpreted as a systematic uncertainty on the SXI energy scale. We also fit the spectra of the calibration sources with a response function determined from the ground calibration (Inoue et al. 2016). Almost all the data require an extra line width even if we extract data only during the eclipse of the spacecraft. Here we define the energy resolution to be the full width at half maximum (FWHM) of the primary Gaussian component in the response function (Inoue et al. 2016). The energy resolution averaged among all the segments is 179 ± 3 eV at 5.89 keV, which is larger than the value determined from the ground calibration test by ∼10 eV (Tanaka et al. 2018). Although the reason for the degradation is not clear, there might be remaining effects of the issues described in section 5. All the spectral analyses shown hereafter are performed using the updated response function.
The line profile in the response function is calibrated using the Mn K spectrum integrated over a long duration. Figure 8 shows a spectrum from one of the 55Fe calibration sources obtained during the observation of the pulsar wind nebula G21.5–0.9 (Matheson & Safi-Harb 2010; Hitomi Collaboration 2018b). The exposure time is 76 ks after the screening with SUN_ALT and T_SAA_SXI. The Mn K α and K β lines are fitted with Gaussian functions using the updated response function. We add a power-law model to represent the non–X-ray background (NXB). The intensities of the Si escape lines and the constant components are reproduced well with the line profile parameters determined from the ground calibration (Inoue et al. 2016), in which we utilized fluorescence lines and monochromatic X-rays.
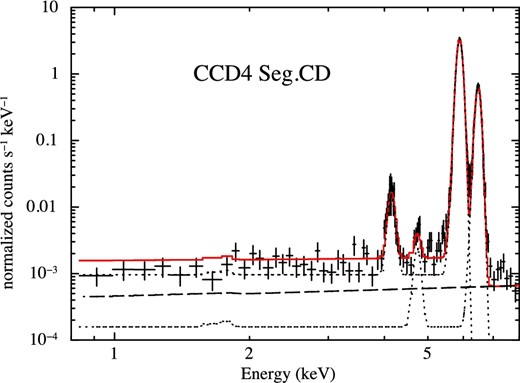
Mn K spectrum of CCD4 Segment CD accumulated during the observation of G21.5–0.9. The events are extracted in the period of the eclipse of the spacecraft and 1800 s after the passage of the SAA or later. The spectral model shown with a dashed line is a power-law model to reproduce the NXB component. (Color online)
6.2 Effective area and quantum efficiency
In-flight calibration of the quantum efficiency and the effective area was carried out with data from the Crab nebula. At the center of the nebula, the Crab pulsar lies with a spin period of ∼34 ms and is viewed as a point-like source. In the X-ray band, the Crab nebula, including its central pulsar, emits synchrotron radiation which is reproduced by an absorbed power-law model. Toor and Steward (1974) suggested that the 2–10 keV flux shows 15% variation. Wilson-Hodge et al. (2011) also reported that the flux in the 2–15 keV band varies by approximately 10% on the long timescale. While the variability limits the reliability of the flux estimation to the level of approximately 10%, the Crab nebula has been used as a standard candle for effective area calibration (Toor & Seward 1974; Kirsch et al. 2005; Weisskopf et al. 2010; Madsen et al. 2015).
Since the Crab nebula is as bright as ∼3 × 10³ counts s−1 SXI−1 at the nominal position, it is important to minimize pile-up. The “Full Window + 0.1-s Burst” mode was then adopted for CCD1 and CCD2. This mode provides the shortest exposure per frame and hence reduces the pile-up probability as much as possible (Tanaka et al. 2018). Its integration time per frame cycle is as short as 0.0606 s. CCD3 and CCD4 were operated with a nominal exposure of 4 s. The data are screened with the standard criteria and further screened for intervals in which the pointing is expected to be stable.
The image of the Crab nebula taken with this combined mode is shown in figure 9. The Crab nebula is imaged at around the optical axis on CCD2. The brightness at the off-axis area in CCD1 and CCD2 is much lower than that in CCD3 and CCD4 due to the short effective exposure of the burst mode. The diffuse structure seen in CCD3 and CCD4 is due to the tail of the point spread function (PSF) together with the dust scattering in the interstellar matter. The fine structure is clearly seen owing to the efficient exposure of “Full Window + No Burst” mode.
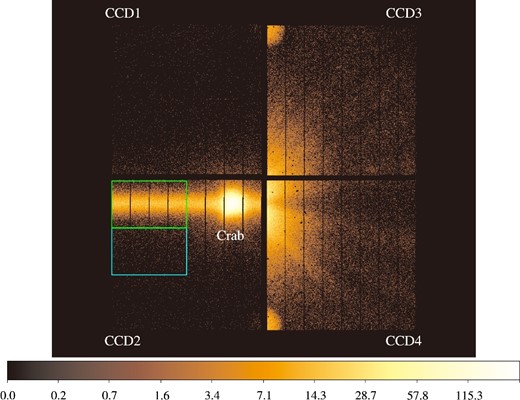
SXI image of the Crab nebula observation in DET coordinates with no energy cut. The source and background events are extracted from the green and cyan regions, respectively. The size of the extracted region is 320 × 200 pixels for both the source and background. The quadrant-like spots at the top (in CCD3) and the bottom (in CCD4) are identified with the Mn K events for energy calibration. (Color online)
With the “Full Window + 0.1-s Burst” mode, it is found that the core of the Crab nebula image is still piled up by 20%. Photons are not only registered during the actual integration interval but also during the vertical transfer. These so called out-of-time (OoT) events are seen like a bar along the vertical transfer direction in figure 9. The OoT events are well known to experience much less pile-up. The magnitude of this effect is scaled with the ratio of readout time and integration time. The pile-up fraction of the OoT events is negligibly small, as it is reduced by two orders of magnitude compared with that of the integrated events. All the following spectral and timing analyses of the Crab data are performed using these OoT events.
The spectrum of the Crab nebula, including the pulsar contribution, is plotted in figure 10. The event threshold was set to 100 ch, which corresponds to 0.6 keV, during the Crab observation to minimize the effect of the crosstalk issue. Then we utilize the events above 0.7 keV for the spectral analysis, avoiding those just above the threshold. We extract the Crab nebula spectra from the green rectangular region (figure 9) that covers half of the OoT events. The count rate of the spectra is 2569 counts s−1. It takes 18.432 ms to transfer charges throughout the extracted region in each frame. The total exposure time summed over all frames is 21.3 s. The binning factor is 2–95 ch per bin, depending on the energy. Each bin contains 36–649 counts below 11.8 keV. Five or more photons are contained above 11.8 keV. The background spectrum is extracted from the adjoining rectangular region in cyan (figure 9). The count rate of the background spectrum is 57 counts s−1, which is about 2.2% of that of the source spectrum, and is found to be dominated by the X-rays from the outskirts of the PSF of the Crab nebula.
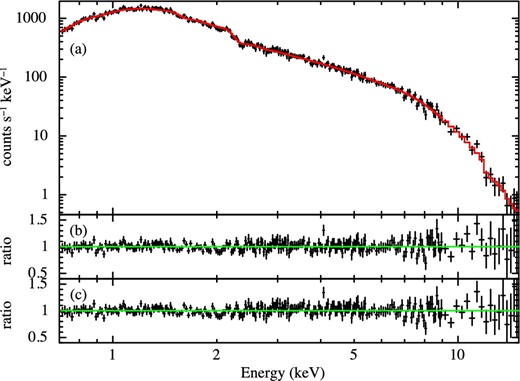
(a) Crab nebula spectrum with the best-fit model (red solid line). The correction factor is applied to the effective area. (b) Residuals of the data from the best-fit model in (a). (c) Same as (b), but the correction factor is not applied to the effective area. (Color online)
We fit the spectrum with a model composed of a power law with photoelectric absorption (phabs with the absorber abundance fixed to solar). The result is summarized in table 3, and is shown in figure 10. In the fit, we adopt two kinds of effective area (so-called ancillary response file: arf). Both are calculated using the standard ftools aharfgen (Angelini et al. 2016) assuming a point source, but with and without the correction (or fudge) factor (figure 11). We do not collapse the two-dimensional PSF to one dimension because the PSF shape exhibits little energy dependence (see figure 2 in Sato et al. 2016b). It is found that the effective area calculated by aharfgen has some discrepancy with that measured on the ground.2 The correction factor is modeled as the ratio of effective areas between the output of aharfgen and that measured on ground. The ground measurements were made at 1.5, 4.5, 8.0, 9.4, 11.0 and 17.5 keV. A spline interpolation was applied between the energies.
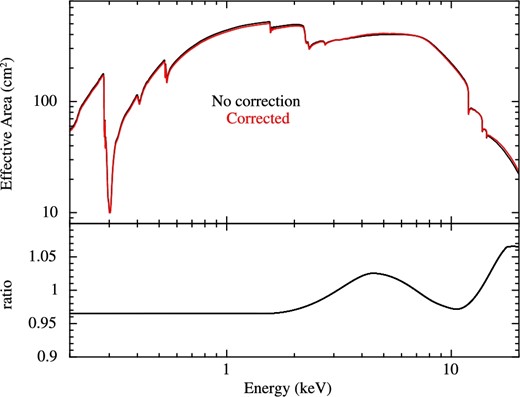
SXI effective area on-axis. The black and red lines correspond to the areas that are calculated without and with the correction factor, respectively. The bottom panel shows their ratio. (Color online)
| Correction factor . | |$N_{\rm H}^{\ast }$| . | Photon index Γ . | Flux† . | Reduced χ2 (d.o.f.) . |
|---|---|---|---|---|
| Applied | 3.9 ± 0.1 | 2.14 ± 0.02 | 2.06 ± 0.02 | 1.024 (245) |
| Not applied | 3.8 ± 0.1 | 2.11 ± 0.02 | 2.06 ± 0.02 | 1.072 (245) |
| Correction factor . | |$N_{\rm H}^{\ast }$| . | Photon index Γ . | Flux† . | Reduced χ2 (d.o.f.) . |
|---|---|---|---|---|
| Applied | 3.9 ± 0.1 | 2.14 ± 0.02 | 2.06 ± 0.02 | 1.024 (245) |
| Not applied | 3.8 ± 0.1 | 2.11 ± 0.02 | 2.06 ± 0.02 | 1.072 (245) |
*Equivalent hydrogen column density in units of 1021 cm−2.
†Unabsorbed energy flux in units of 10−8 erg cm−2 s−1 in the 2–10 keV band.
| Correction factor . | |$N_{\rm H}^{\ast }$| . | Photon index Γ . | Flux† . | Reduced χ2 (d.o.f.) . |
|---|---|---|---|---|
| Applied | 3.9 ± 0.1 | 2.14 ± 0.02 | 2.06 ± 0.02 | 1.024 (245) |
| Not applied | 3.8 ± 0.1 | 2.11 ± 0.02 | 2.06 ± 0.02 | 1.072 (245) |
| Correction factor . | |$N_{\rm H}^{\ast }$| . | Photon index Γ . | Flux† . | Reduced χ2 (d.o.f.) . |
|---|---|---|---|---|
| Applied | 3.9 ± 0.1 | 2.14 ± 0.02 | 2.06 ± 0.02 | 1.024 (245) |
| Not applied | 3.8 ± 0.1 | 2.11 ± 0.02 | 2.06 ± 0.02 | 1.072 (245) |
*Equivalent hydrogen column density in units of 1021 cm−2.
†Unabsorbed energy flux in units of 10−8 erg cm−2 s−1 in the 2–10 keV band.
The best-fit parameters of Γ and flux in table 3 are in agreement with those of Γ = 2.10 ± 0.03 and flux = (2.2 ± 0.2) × 10−8 erg cm−2 s−1 by Toor and Seward (1974). This agreement supports the suggestion by Madsen et al. (2017) that the X-ray variability on yearly timescales of the Crab nebula is not part of a long term trend, but instead results from fluctuations around a steady mean.
The effective area of the SXI is calibrated by combining the ground-based measurements. The measurements of the effective area of the mirror assembly, the transmissivity of the assembly filter (i.e., thermal shield), the transmissivity of the detector filters, and the quantum efficiency of the detector are already reported separately (Tsunemi et al. 2008; Tawara et al. 2011; Kawai et al. 2012; Kohmura et al. 2014; Iizuka et al. 2018). The good agreement of the spectral parameters to the numbers in Toor and Seward (1974) suggests that the effective area of the soft X-ray imaging system in orbit is consistent with that measured on ground.
6.3 Contamination
Recently, contaminants on the light path of X-ray optics are recognized to be issues in terms of the quantum efficiency in the low energy band. Volatile materials desorbed from the various components in the spacecraft may be adsorbed by a cold surface such as the CCDs. According to the extensive investigation through the ground test of Suzaku, the most problematic contaminant is a macromolecular compound often used in plastics (Anabuki 2005). Furthermore, the in-orbit calibration of the XIS showed that the contaminant composition evolved throughout the mission. Thus, continuous monitoring of the contamination thickness is essential to properly calibrating quantum efficiency. Monitoring the contamination on the SXI also gives a criterion to open the gate valve of the SXS in the initial operation.
Hitomi observed RX J1856.5−3754 twice, a week apart, to monitor any possible accumulation of such a contaminant. Although Hitomi aimed at the target direction precisely for both pointings, the signal events were detected only for the SXI because the quantum efficiency of the SXS below 2 keV is too low to detect the emission from the target with the gate valve closed. The emission from the target is too soft for the hard X-ray imaging system (Awaki et al. 2014; Sato et al. 2016a).
The X-ray spectrum of RX J1856.5−3754 is reproduced well with the two-temperature blackbody emission model (Beuermann et al. 2006). Because the spectrum has been stable over years (Sartore et al. 2012) with a small fraction of the pulsation (1.2%) in the 0.15–1.2 keV band (Tiengo & Mereghetti 2007), RX J1856.5−3754 has often been used to calibrate other soft X-ray instruments. Although the excess of the emission over the conventional two-temperature blackbody model around 1 keV was recently reported (Yoneyama et al. 2017), we have not introduced the excess because of the limited photon statistics.
Figure 12 shows the background-subtracted spectra from the two observations. We extract the source spectra from a circular region with a radius of |${90^{\prime \prime }}$| and the background spectra is chosen from the entire region of the on-axis segment excluding a circular source region with a radius of |${5^{\prime }}$|. The difference in the effective area between the source and background regions is corrected, as well as the difference in the area between the regions.

(Top) RX J1856.5−3754 spectrum at the first observation with background subtracted. The red and blue lines correspond to the best-fit models with a constant factor of 1.1 and with 0.9, respectively. (Bottom) Same as the top panel, but for the second observation. (Color online)
We fit the spectra with the model of phabs*{bbodyrad+bbodyrad}*constant, where the constant factor is introduced to absorb the calibration uncertainty of the effective area in the soft energy band. To estimate the systematic errors, we perform the spectral fit by fixing the constant factor to 0.9 and to 1.1, which are conventionally used as the uncertainty range of the absolute effective area and are exemplified in subsection 6.2. The model equivalent hydrogen column density, blackbody temperatures, and radii for each temperature component are adopted from Beuermann, Burwitz, and Rauch (2006). An additional multiplicative model of the column densities due to the contaminants is applied. Possible compositions of the contaminants are neutral H, C, and O. However, we allow only the column density of C (NC) to vary from the statistical point of view.
Table 4 summarizes the best-fit parameters from the two observations. Although NC is consistent with zero or negative in the case of the constant factor of 0.9, it is significantly detected when we set the factor to 1.1. Considering these facts, we conclude that NC is less than 9.4 × 1017 cm−2 and 5.5 × 1017 cm−2 for the first and second observations, respectively, which correspond to the mass column densities of C (ρC = 12 × NC|$/$|NA) of 18.8 μg cm−2 and 10.8 μg cm−2. The prelaunch requirement of the SXI for the limit of any contaminant was ρC < 10 μg cm−2. Follow-up calibrations would have made the results more precise. Another important fact is that NC did not show a significant increase during the interval between the two observations, which ensures the opening safety of the SXS gate valve.
| Parameters . | First observation . | . | Second observation . | ||
|---|---|---|---|---|---|
| Constant factor* (fixed) | 0.9 | 1.1 | 0.9 | 1.1 | |
| N C (1017 cm−2) | 0.8|$^{+1.5}_{-1.4}$| | 7.9|$^{+1.5}_{-1.4}$| | |$-2.6^{+1.0}_{-0.9}$| | 4.5|$^{+1.0}_{-1.0}$| | |
| Reduced χ2 (d.o.f.) | 1.305 (47) | 1.032 (47) | 1.340 (59) | 0.939 (59) | |
*Constant factor is introduced to take account of the calibration uncertainty of the effective area in the soft energy band.
| Parameters . | First observation . | . | Second observation . | ||
|---|---|---|---|---|---|
| Constant factor* (fixed) | 0.9 | 1.1 | 0.9 | 1.1 | |
| N C (1017 cm−2) | 0.8|$^{+1.5}_{-1.4}$| | 7.9|$^{+1.5}_{-1.4}$| | |$-2.6^{+1.0}_{-0.9}$| | 4.5|$^{+1.0}_{-1.0}$| | |
| Reduced χ2 (d.o.f.) | 1.305 (47) | 1.032 (47) | 1.340 (59) | 0.939 (59) | |
*Constant factor is introduced to take account of the calibration uncertainty of the effective area in the soft energy band.
6.4 Point spread function
The PSF of a focusing telescope system is usually calibrated using a point-like bright source. The brightness reduces the uncertainty of the background subtraction at its tail, whereas the point-like emission works so as to resolve its sharp core. Due to the limited numbers of observed targets of Hitomi, a point-like bright source was not observed. Instead, we use an on-pulse image (the pulsar image) of the Crab nebula.
6.4.1 Extraction of the on-pulse component
OoT events give huge benefits in terms of the timing resolution. The row position (DETX) can be used as a time tag of events with a time unit of 57.6 μs, which corresponds to the readout clock per row. However, the focus of the SXT-I is blurred with its PSF. The tagged time is then smoothed by the PSF [|${0 {^{\prime}_{.}} 7}$| or 1.14 mm in half-power widths (HPWs), see below]. The effective time resolution becomes ∼1.3 ms.
Figure 13 shows a folded light curve of the Crab nebula in the total band. We adopt the period of 33.7204626 ms at the epoch of 17472 d (TJD) obtained with the SXS (Maeda et al. 2018). The timing analysis of all the Hitomi instruments is comprehensively summarized in other papers (Leutenegger et al. 2016; K. Koyama et al. in preparation). The pulse is clearly detected in the folded light curve.
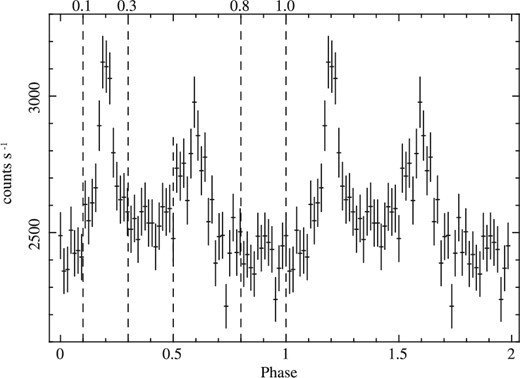
Folded light curve of the OoT events of the Crab nebula. Phase zero is taken arbitrarily.
The pulses have widths of 0.1–0.2 phase, corresponding to 3–6 ms. The emission region of the pulsed component must be smaller than (3–6) × 10−3 times the speed of light [≈(1–2) × 107 cm]. If we assume that the distance to the Crab nebula is 2 kpc, the source of the pulsed component (i.e., the Crab pulsar) is securely regarded as a point-like source.
Dust scattering is known to make a halo structure around the source (Draine 2003). Once the emission from the pulsar is scattered, it experiences a time lag due to a detour of the arrival pass and makes the emission unpulsed. Therefore, the pulsed component is an point-like ideal source that is free from the dust scattering halo. Owing to the large brightness of the Crab pulsar, the pulsed component is used as an in-flight calibration of the PSF.
6.4.2 One-dimensional point spread function
Figure 14 shows the 0.6–15 keV band images of the on-pulse, the off-pulse, and the on-minus-off pulse. The images are extracted from the green region shown in figure 9. In figure 13, we define the phase intervals 0.1–0.3 and 0.5–0.7 as the on-pulse phase. The phase interval 0.8–1.0 is adopted as an off-pulse phase. The effective exposure times of the on- and off-pulse images are 8.6 s and 4.3 s, respectively. The on-minus-off pulse image is made by subtracting the off-pulse image from the on-pulse. The on-minus-off pulse image appears narrower in the DETY direction. This is because the on-minus-off pulse image originates from the pulsar radiation, i.e., the point-like emission.
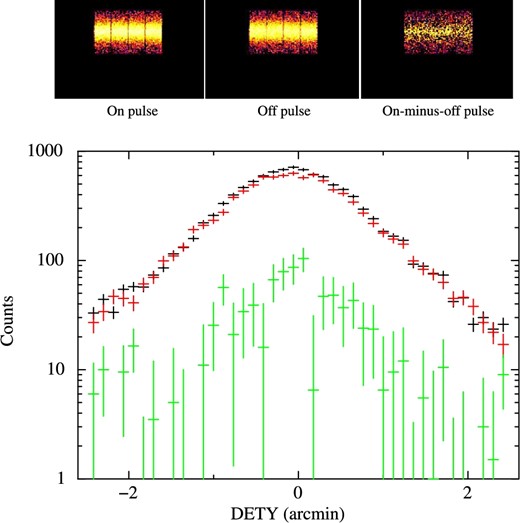
(Top) Out-of-time images of the Crab nebula observation in DET coordinates for the on-pulse (left), the off-pulse (middle), and the on-minus-off pulse (right). (Bottom) Projection along the DETX direction. The black, red, and green data correspond to the projections using the pulse phase of on, off, and on-minus-off, respectively. (Color online)
Since the OoT trail along the direction of DETX remained, we make a histogram of the events as a function of DETY. This histogram corresponds to a one-dimensional PSF, and is shown in figure 15. To compare the ground measurements with the in-flight PSF, we simply collapse the image taken on the ground down to one dimension along the direction of DETX and make a one-dimensional PSF for the ground measurements. The cumulative distribution function from the peak of the one-dimensional PSF is plotted in figure 15 as well as that from the output of ray-tracing. HPWs are calculated using the cumulative distribution function and are listed in table 5. Within the limited statistics of the data, the HPW of the Crab pulsar is consistent with that of the ground measurement at 4.51 keV, and with that of the ray-tracing used in the calculation of the response function of the SXT-I. It can be concluded that the in-flight PSF of the SXT-I is consistent with the on-ground measurements. This indicates that the HPD of the SXT-I is ∼|${1 {^{\prime}_{.}} 3}$| in orbit, which is the number we measured on ground.
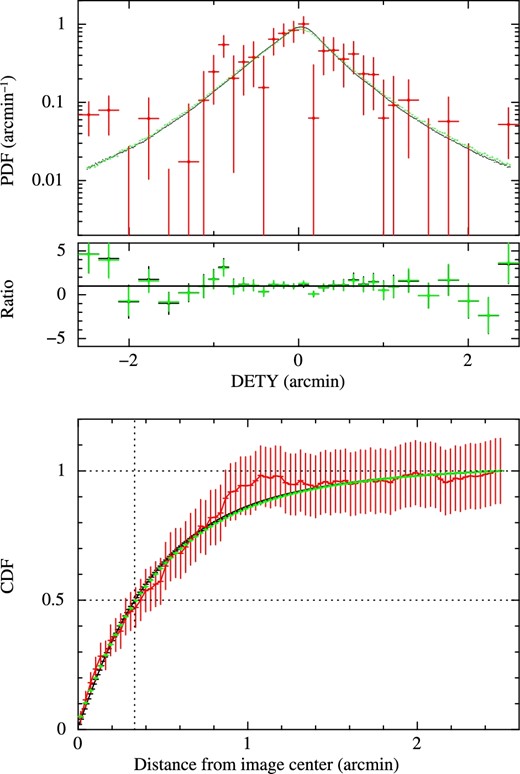
(Top) One-dimensional PSF (or PDF: probability density function) of the Crab nebula’s on-minus-off pulse image (red). The ground-based measurements (black) and the ray-tracing output (green) are overlaid. Ratios with respect to the observed data are also shown. (Bottom) Cumulative distribution function (CDF) from the peak of the one-dimensional PSF with the same color coding as the top panel. The vertical dashed line follows the half width of the half power, i.e., half of the HPW. (Color online)
| Data . | HPW (΄) . | References‡ . |
|---|---|---|
| Crab pulsar* | 0.74 ± 0.12 | This work |
| Ground measurements† | 0.67 ± 0.01 | (1), (2) |
| Ray-tracing | 0.68 ± 0.02 | (3) |
| Data . | HPW (΄) . | References‡ . |
|---|---|---|
| Crab pulsar* | 0.74 ± 0.12 | This work |
| Ground measurements† | 0.67 ± 0.01 | (1), (2) |
| Ray-tracing | 0.68 ± 0.02 | (3) |
| Data . | HPW (΄) . | References‡ . |
|---|---|---|
| Crab pulsar* | 0.74 ± 0.12 | This work |
| Ground measurements† | 0.67 ± 0.01 | (1), (2) |
| Ray-tracing | 0.68 ± 0.02 | (3) |
| Data . | HPW (΄) . | References‡ . |
|---|---|---|
| Crab pulsar* | 0.74 ± 0.12 | This work |
| Ground measurements† | 0.67 ± 0.01 | (1), (2) |
| Ray-tracing | 0.68 ± 0.02 | (3) |
6.5 Non–X-ray background
A low and stable background is essential for precise observations, especially for those of extended targets. Hitomi adopts almost the same LEO as Suzaku, which realized low and reproducible NXB (Tawa et al. 2008). The design of the camera body is another key to suppression of the NXB. Considering the result of a Monte Carlo simulation (Anada et al. 2008), we designed the sensor body so that the thickness of the housing is ≥10 g cm−2.
For the three weeks of the observations, we accumulated the events during the period when the spacecraft pointed to the night Earth, and regard those events as NXB. To securely extract only the NXB events, we define a screening criterion from the extended housekeeping data as (SAA_SXI == 0) && (T_SAA_SXI > 277).
As a result, the total exposure is 118.3 ks for the on-axis segment, including multiple pointings to check the AOCS and excluding the Crab observation, which is not performed with the normal clocking mode of “Full Window + No Burst.” The exposure times for the other segments are different between pixels, depending on whether the pixel was affected by the crosstalk issue. Figure 16 shows the integrated NXB spectrum normalized with respect to the area of a physical pixel. All the good grade events are summed over the whole FoV with the exception of the regions irradiated with the calibration sources and those affected by OoT Mn K events. The region with 360 ≤ DETY ≤ 1450 is regarded to be free from the OoT events.
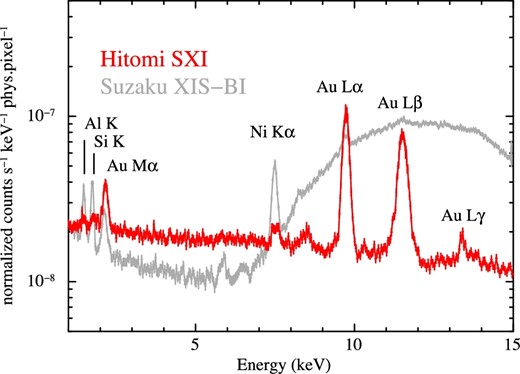
SXI NXB spectrum normalized by physical pixel area. Events from the entire FoV are collected, with the exception of the regions irradiated with the calibration source events and their OoT events. Data of Suzaku XIS-BI that have the same physical pixel area are also shown for comparison. The data of the XIS-BI are adopted from Tawa et al. (2008). (Color online)
Emission lines from Au L α, Au L β, and Au M α and weak lines from Al K, Si K, Ni K α, and Au L γ are seen. Primarily, the emission lines from Au originate from the inner surface of the housing. The surface of the CCD package and the cold plate are also vapor deposited by Au. Ni is under the Au layer of the housing. The OBL on the surface of the CCD and the CBF consist of Al, and hence they are responsible for the Al emission line. The Si line is emitted from the inside of the CCD wafer. The NXB spectrum of XIS-BI has a hump above 6 keV, which limits the sensitivity in the energy band. In contrast, the NXB spectrum of the SXI shows no hump in the energy band up to 15 keV. The Ni K α line at 7.5 keV is weaker than that of the XIS because of a thicker Au layer vapor deposited onto the inner surface of the housing. This allows us to obtain a better estimation of the spectral parameter from celestial objects such as supernova remnants because the centroid of Ni K α overlaps with those of Fe He β and Ni He α.
The NXB intensity in general depends on the cut-off rigidity (COR) as investigated for the XIS (Tawa et al. 2008). Figure 17 a shows an NXB count rate in the energy band of 5–12 keV as a function of COR that is based on the international geomagnetic reference field model version 12 (Thébault et al. 2015). The NXB also depends on the position in the CCD, as shown in figure 17b. If the spatial distributions of the charged particles or hard X-rays are uniform throughout the sensor, including the frame store region, the intensity of the NXB depends on the exposed duration at each position. Taking into account the difference of the pixel size between the imaging area and the frame store region, the intensity of the top region should be 1.7 times larger than that of the bottom region. The measured ratio of ∼1.3 is significantly lower than expected, which may be due to the flux difference between the imaging area and the frame store region, or the difference of the grade branching ratio between the two regions. To derive a proper background spectrum to be subtracted from a source spectrum, the sxinxbgen software takes into account these positional and COR dependencies.
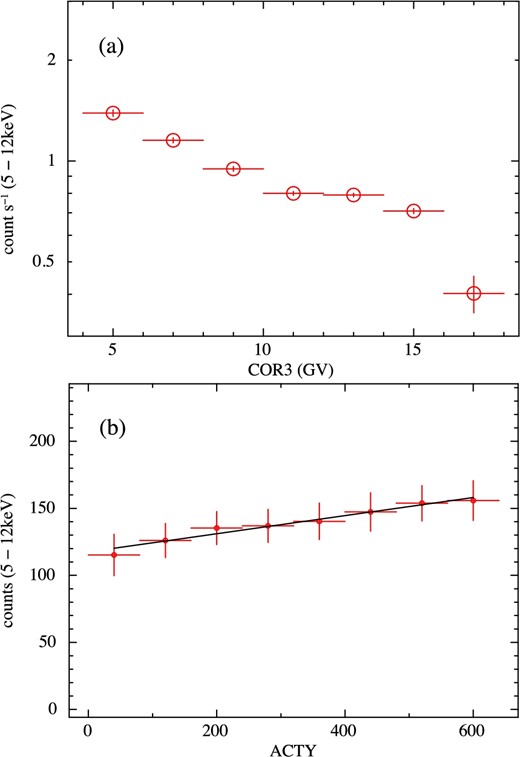
(a) Count rate of the NXB in the energy band from 5 to 12 keV as a function of COR. (b) NXB count in the same energy band as (a) as a function of ACTY. The data for all the segments are summed for both panels. (Color online)
In figure 18, we compare sky background spectra among different X-ray CCD detectors: ASCA SIS0, Chandra ACIS-{I, S3} , XMM-Newton {EPIC-pn, EPIC-MOS} , Suzaku XIS-{FI, BI}, and Hitomi SXI. The SXI background is extracted from the entire FoV during the RX J1856.5−3754 observation, with exceptions of a circular region around the target with a radius of |${150^{\prime \prime }}$|, calibration source regions, and their OoT event regions. All the spectra are normalized by the effective area of the instrument (corresponding telescope + CCD) at its focus and by the solid angle of the FoV. Hence it illustrates the surface brightness of the sky background and provides a measure of sensitivity for extended targets. The cosmic X-ray background (CXB) intensity is set to 9.3 × 10⁻⁷ (E/1 keV)−1.4 counts s−1 keV−1 arcmin−2 cm−2 as a reference. Thanks to the high quantum efficiency of the SXI, the soft X-ray imaging system aboard Hitomi achieves better sensitivity than Suzaku XIS-BI above 6 keV. The sky background intensity is 5.6 × 10⁻⁶ counts s−1 arcmin−2 cm−2 in the energy band of 5–12 keV, which is seven times lower than the intensity of the XIS-BI.
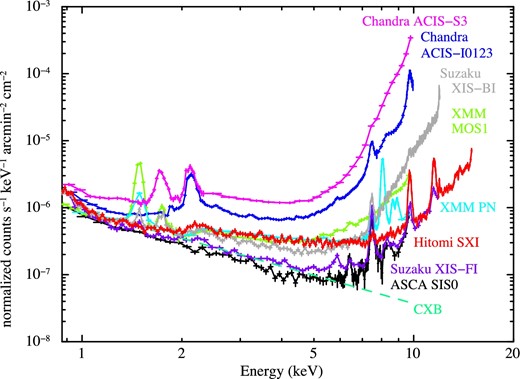
SXI sky background spectrum normalized by the effective area and the solid angle of the FoV. CXB level (a dashed line) and data of other instruments (curves) using X-ray CCDs are also shown for comparison. Datasets of ASCA, Chandra, and XMM-Newton are adopted from Katayama et al. (2004). Suzaku XIS data are adopted from Tawa et al. (2008). (Color online)
7 Summary
In spite of the short lifetime of the mission, the soft X-ray imaging system confirmed its function and performance. The observation of the Perseus cluster of galaxies demonstrated the imaging capability over the large FoV of |${38^{\prime }}$| × |${38^{\prime }}$|. We measured the HPW using the on-minus-off pulse image for the OoT events of the Crab pulsar. It is found that the HPW is consistent with that of the ground measurement and that of the ray-tracing. We thus conclude that the angular resolution is as good as ∼|${1 {^{\prime}_{.}} 3}$| in orbit. The best-fit parameters of the absorbed power-law model for the Crab spectra are consistent with those in the literature, suggesting the correctness of the effective area calibration. The effective exposure time is affected by the light leak issue, primarily when the minus Z axis of the spacecraft points to the day Earth. The crosstalk issue affects part of the effective area. We would not see the issue any longer if we had optimized the threshold for the dark level update before the loss of the spacecraft. After screening the data affected by these two issues, the spectra of the onboard calibration source events prove that the energy resolution at 5.89 keV is 179 ± 3 eV in FWHM. The sky background level is seven times lower than that of Suzaku XIS-BI in the energy band of 5–12 keV.
Acknowledgments
We would like to express our appreciation for the tremendous efforts by Yu Shiodome, Kentaro Someya, Takuro Sato, Ko Ichihara, Kazuki Tomikawa, Naomichi Kikuchi (ISAS/JAXA), Ikuya Sakurai, Yuhki Kurebayashi (Nagoya University), Sari Minami (Nara Women’s University), Takanori Izumiya, Takashi Awaya, Kota Okada (Chuo University), Naohisa Anabuki, Shuhei Katada (Osaka University), Ryosaku Washino (Kyoto University), Eri Isoda (University of Miyazaki), Tahir Yaqoob (University of Maryland Baltimore County), and Lorella Angelini (NASA/GSFC) in the development and calibration of the SXT-I and the SXI. S. Inoue, K. K. Nobukawa, and T. Sato are supported by the Research Fellow of JSPS for Young Scientists. This work is supported by JSPS KAKENHI Grant Numbers JP14079204, JP15H02070, JP15H02090, JP15H03641, JP15J01845, JP15K17610, JP16H00949, JP16H03983, JP16K13787, JP14079204, JP17K14289, JP18740110, JP20365505, JP20549005, JP21659292, JP23000004, JP23340071, JP23540280, JP23740199, JP24684010, JP24740123, JP25105516, JP25109004, JP25870181, JP26109506, JP26670560, JP26800102, and JP26800144. T. Dotani acknowledges support from the Grant-in-Aid for Scientific Research on Innovative Areas “Nuclear Matter in Neutron Stars Investigated by Experiments and Astronomical Observations.”
Footnotes
References
Author notes
The corresponding authors are Hiroshi Nakajima, Yoshitomo Maeda, Hiroyuki Uchida, and Takaaki Tanaka.


