


Abstract
A large fraction of baryons predicted from the standard cosmology is still missing observationally. Although previous numerical simulations have indicated that most of the missing baryons reside in large-scale filaments in the form of the warm–hot intergalactic medium (WHIM), it is generally very difficult to detect signatures from such a diffuse gas. In this work, we focus on the hyperfine transition of neutral hydrogen (HI), called the 21-cm line, as a tool to trace the WHIM. For the purpose, we first construct the map of the 21-cm signals by using the data provided by the state-of-the-art cosmological hydrodynamics simulation project, Illustris, in which detailed processes affecting the dynamical and thermal evolution of the WHIM are implemented. From a comparison of the constructed 21-cm signal map with the expected noise level of the Square Kilometre Array phase 1 mid-frequency instrument (SKA1-mid), we find that the 21-cm signals from the WHIM in the filamentary structures at redshifts z = 0.5–3 are too small to detect with the SKA1-mid. Our results suggest that a sensitivity about 10 times higher than the SKA1-mid is possibly enough to detect the WHIM at z = 0.5–3. However, we also show that the signals of the filamentary structures including the contribution from galaxies are detectable with the SKA1-mid if we assume the angular resolution of Δθ ≥ 10΄ and the observing time of tobs ≥ 100 hr.
1 Introduction
Recent various cosmological observations strongly support that the ΛCDM (Lambda cold dark matter) model is preferred for describing the evolution of the Universe (Planck Collaboration 2016). The present acceleration expansion revealed by observations of type Ia supernovae suggests the existence of dark energy (Perlmutter et al. 1997; Riess et al. 1998). Furthermore, numerical simulations based on the ΛCDM model succeed in explaining observed galaxy clustering in the large-scale structure (Alam et al. 2016). Hence, although it is a simple theoretical model, the ΛCDM model is widely accepted as the standard model of the Universe. However, there are some critical cosmological problems in the ΛCDM model to date. While the cosmic microwave background (CMB) tells us that 95% of the total energy density in the Universe is made of mysterious “dark” components (Planck Collaboration 2016), the true natures of these dark components are totally unknown. Even for ordinary baryonic components, although they are responsible for ∼5% of the total energy density in the Universe from CMB observations, there is a problem in where and in what form baryons exist (Fukugita et al. 1998). The baryon-to-photon ratio obtained from CMB observations is consistent with that predicted by the big bang nucleosynthesis using local measurements of the light elements (Coc et al. 2013). However, only 10% of the predicted amount of baryons are found as stars or gas clouds in galaxies and galaxy clusters (Salucci & Persic 1999; Fukugita & Peebles 2004). Therefore, other baryons are expected to be outside galaxies and are known as the “missing baryons” (for recent reviews, see Shull et al. 2012; Nicastro et al. 2017). The dynamical evolution of the dark matter density fluctuations naturally leads to the formation of large-scale structures, so-called “cosmic webs”. Recent cosmological structure formation simulations have shown that the missing baryons are in the form of a shock-heated warm/hot intergalactic gas called the warm–hot intergalactic medium (WHIM), the temperature of which corresponds to 105–107 K (Cen & Ostriker 1999; Davé et al. 2001; Yoshikawa et al. 2003; Bregman 2007). Therefore, surveys of the WHIM in large-scale filamentary structures provide the key to accessing the missing baryons.
Observations of the metal absorption lines imprinted on high-redshift QSO spectra play important roles in surveying the WHIM. Tripp et al. (2001) have firstly confirmed that the predicted hot diffuse gas actually exists at low redshifts, using high-resolution spectra of QSOs. Subsequent observations including Ly-α surveys revealed that roughly 30% of baryons exists as the WHIM with a temperature of in the order of 105 K (Nicastro et al. 2008; Shull et al. 2012). Although these UV and optical observations are too low-resolution to point out the location and topology of the WHIM, recent X-ray observations can trace filamentary structures of the WHIM. Kull and Böhringer (1999) reported the existence of the inter-cluster filament structure of gas in the central region of the Shapley supercluster via X-ray observations. In Werner et al. (2008), the authors found X-ray emission from the filamentary structure between the galaxy clusters, Abell 222 and Abell 223. The observation suggests that, in this filament region, the gas temperature and density are as high as the densest and hottest WHIM in simulations. More recently, Eckert et al. (2015) have finally found hot gas associated with the filaments surrounding the galaxy cluster Abell 2744 via X-ray observations that had a spatial resolution high enough to trace the filamentary structures. Although such observations are incrementally revealing the existence of the missing baryons, 30%–40% of baryons are still missing (Fukugita & Peebles 2004; Shull et al. 2012; Nicastro et al. 2017). In particular, it is thought that the WHIM with temperature >106 K has not been fully explored yet.
Attempts to detect the baryons which reside in the large-scale filaments have been hitherto limited to approaches using X-ray and UV/optical observations. However, forthcoming radio telescopes have the potential to detect the filaments. For instance, the contribution of the thermal and kinematic Sunyaev–Zel’dovich effect through the WHIM is discussed in Atrio-Barnadela, Mücket, and Génova-Santos (2008), Atrio-Barnadela and Mücket (2006), and Planck Collaboration (2013). Furthermore, if the filamentary structures are magnetized, the large-scale filamentary structures can be traced by the synchrotron radiation (Araya-Melo et al. 2012; Vazza et al. 2014) and the Faraday tomography (Akahori et al. 2014) with a next-generation radio interferometer; the Square Kilometre Array (SKA).
Another promising approach casting light on the baryons that reside in the large-scale filaments is the observation of the hyper-fine structure line of neutral hydrogen, i.e., the HI 21-cm line. It is true that the Universe is mostly ionized at z < 6, but the SKA is expected to have enough potential to detect weak HI 21-cm emission lines from residual neutral hydrogen in the filaments. Takeuchi, Zaroubi, and Sugiyama (2014) have investigated the detectability of such HI 21-cm signals from the filaments by performing an N-body simulation. To evaluate the 21-cm signals from filaments, they have assumed that the thermal and ionization evolution of gas in filaments are determined by background UV radiation and the Hubble expansion. However, as shown in cosmological hydrodynamics simulations, the shock heating during the structure formation and the feedback effects from galaxies, which cannot be taken into account in N-body simulations, play important roles in determining the state of the WHIM in filamentary structures. The shock heating can heat up the gas residing in filamentary regions up to 105–107 K (Davé et al. 2001; Bregman 2007), and outflowing gas and emission from galaxies could also provide an impact on the evolution of gas (Roncarelli et al. 2012; Iapichino et al. 2013). This underestimation of the gas temperature very likely results in overestimation of the neutral fraction of gas in the filaments due to the lack of the collisional ionization process. Furthermore, it can be expected that galaxies in filamentary structures also significantly contribute to 21-cm signals because they can host substantial amounts of neutral hydrogen as overdense clouds. Therefore, the detectability of HI 21-cm signals from the filamentary structures or the WHIM in them is still open to debate.
In this paper, we revisit the detectability of large-scale filamentary structures at high redshifts through the HI 21-cm signals using the SKA. In particular, we discuss the potential of 21-cm observations probing the WHIM in filamentary structures to resolve the missing baryon problem. For this purpose, we use the publicly available data from the Illustris simulation in which detailed baryonic processes are taken into account (Genel et al. 2014; Vogelsberger et al. 2014).1 Since we are curious about 21-cm signals from diffuse hot gas, we use the simulation data with a threshold baryon density contrast δcut, above which the contribution to the signals is neglected. In this work, we basically employ δcut = 200 to estimate the 21-cm signals from the WHIM. In this simulation, the cosmological parameters are adopted as Ωb = 0.0456, Ω0 = 0.273, ΩΛ = 0.727, H0 = 70.4 km s−1 Mpc−1, σ8 = 0.809, and ns = 0.963, and we also use these parameters to calculate the 21-cm signals.
This paper is organized as follows. In section 2, we show how we evaluate the expected HI 21-cm signals from the simulation data. A brief description of the Illustris simulation is also presented in that section. We show our results in section 3. Section 4 is devoted to discussions. Finally, we give a summary of this paper in section 5.
2 Construction of the 21-cm signal map
The measurement of HI 21-cm signals is a powerful tool for understanding the state of baryonic gas. In this section, we briefly review the physics of the HI 21 cm signals and describe how we evaluate the HI 21-cm signals from the Illustris simulation data.
2.1 Differential brightness temperature
2.2 Spin temperature
Background Lyα mean intensity Jα from Haardt and Madau (2012).
| Redshift | Mean intensity |
|---|---|
| [erg cm−2 s−1 Hz−1 sr−1] | |
| 0.5 | 9.59 × 10⁻²¹ |
| 1.0 | 2.89 × 10⁻²⁰ |
| 2.0 | 7.25 × 10⁻²⁰ |
| 3.0 | 6.31 × 10⁻²⁰ |
| Redshift | Mean intensity |
|---|---|
| [erg cm−2 s−1 Hz−1 sr−1] | |
| 0.5 | 9.59 × 10⁻²¹ |
| 1.0 | 2.89 × 10⁻²⁰ |
| 2.0 | 7.25 × 10⁻²⁰ |
| 3.0 | 6.31 × 10⁻²⁰ |
2.3 Data: Illustris simulation
As described above, the differential brightness temperature of 21-cm line can be evaluated from the gas temperature and the number densities of electrons, protons, and neutral hydrogen. In order to obtain the map of the differential brightness temperature, we use the results of a state-of-the-art cosmological hydrodynamics simulation project called Illustris, in which the thermal and dynamical evolution of baryons is solved with the moving-mesh code AREPO (Springel 2010; Genel et al. 2014; Vogelsberger et al. 2014). As already mentioned in section 1, it is essential to consider baryonic processes, such as radiative cooling and shock heating, for evaluating HI 21-cm signal from WHIM. The Illustris simulation appropriately involves these baryonic processes, as well as feedback processes driven by supernovae and active galactic nuclei, to make simulated galaxies reproduce the observed luminosity function at the present day (Vogelsberger et al. 2013; Torrey et al. 2014).
Since the thermal and chemical evolution is solved in the Illustris simulation, the publicly available data set contains all the information required for evaluating the differential brightness temperature, i.e., neutral hydrogen number density, electron number density, proton number density, and gas temperature, except for the Lyα background mean intensity Jα. As described in subsection 2.2, we refer to Haardt and Madau (2012) for Jα values.
We use the data of Illustris simulation-3. The simulation volume is 106.5 Mpc on a side, and 2 × 4553 gaseous cells and DM particles are distributed in the volume. The resultant mass resolutions correspond to 8.1 × 10⁷ M⊙ for gas and 4.8 × 10⁸ M⊙ for DM (Nelson et al. 2015).
2.4 Map of 21-cm signals from the Illustris data
We construct the maps of the brightness temperature by following the method described in section 2 and show the resultant maps in figure 1. The top left-, top right-, bottom left-, and bottom right-hand panels in figure 1 show the maps of the total hydrogen number density (nH), the gas temperature (TK), the neutral fraction (xHI), and the differential brightness temperature (δTb), respectively.
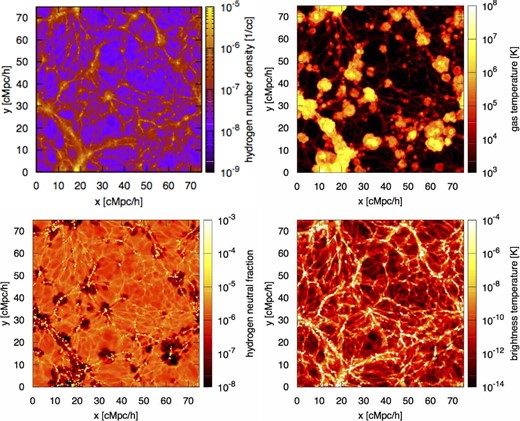
Maps of the hydrogen number density (top left), the gas temperature (top right), the neutral fraction (bottom left), and the differential brightness temperature (bottom right) at the present epoch. The size is 75 Mpc h−1 on a side with a thickness of 1.5 Mpc h−1. (Color online)
In the top left-hand panel, describing the distribution of hydrogen number density, we can identify many filamentary structures. As previous numerical simulations have shown, the gas in the filaments are well heated by shocks up to ∼105–106 K, seen in the top right-hand panel. In the filaments, more overdense regions exist, in which the temperature is higher than the areas around them and reaches >106 K. These regions are close to galaxies, and thus the efficient heating due to strong outflows from galaxies is remarkable.
As shown in the bottom left-hand panel, the neutral hydrogen fraction in the filament structures is very small due to the high collisional ionization rate. The brightness temperature depends on the neutral hydrogen density, namely, the combination of the neutral hydrogen fraction and the gas density. Therefore, in spite of the low neutral hydrogen fraction, the higher gas density makes the resultant brightness temperatures higher in the filamentary structures than those in the lower density regions. Thus we can conclude that the distribution of the 21-cm brightness temperature traces the filament structures well, as seen in the bottom right in figure 1.
We also show the redshift evolution of the brightness temperature maps for z = 0.5, 1.0, 2.0, and 3.0, in figure 2. From figure 2, we can see that the distributions of the brightness temperature trace the filaments nicely, especially at lower redshifts. The gas density and the neutral fraction also rise as the redshift becomes higher. This fact leads to the increase in the signal amplitude, although identifying the filaments on the map becomes difficult due to the weak contrast of the brightness temperature.
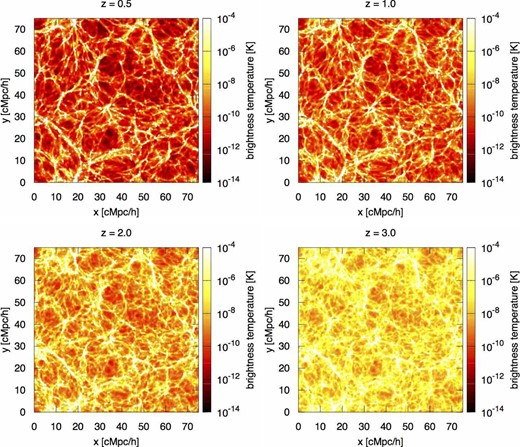
Similar to the bottom right-hand panel in figure 1, but for z = 0.5 (top left), z = 1.0 (top right), z = 2.0 (bottom left), z = 3.0 (bottom right). (Color online)
3 Detectability of HI 21-cm line from the WHIM
As shown above, the measurement of 21-cm signals has the potential to probe filaments. In this section, comparing the 21-cm signal in one telescope beam with the observation noise level, we evaluate the detectability of the signals from the WHIM in filamentary structures with the SKA. Although we are interested in the 21-cm signals from the WHIM in filaments, the Illustris data contains galaxies that are composed of cold gas, residing in the overdense regions as bright 21-cm sources on the 21-cm map constructed in the previous section. Therefore, to evaluate the 21-cm signals only from the WHIM, we exclude the contribution from galaxies to the 21-cm signals. More specifically, we remove from the original data any overdense cells that have a baryon density contrast, compared to the background value, that is larger than the critical density contrast δcut = 200, and remake the maps shown in figure 3. Then, to calculate the signals from the WHIM in filaments, we focus on the filamentary structure that is shown surrounded by the white square in figure 3.
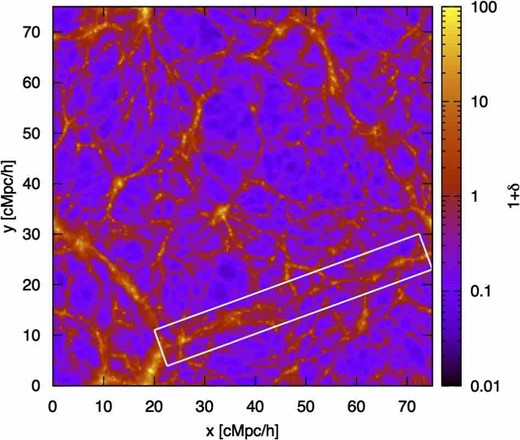
Map of the hydrogen number density. The size is 75 Mpc h−1 on a side with a thickness of 1.5 Mpc h−1. We remove the overdense cells with δ > 200 from the map. The region surrounded by a white square is defined as the filament structure. (Color online)
The observed signal in one beam depends on the angular resolution Δθ and the bandwidth Δν of an interferometer telescope. To take Δθ and Δν for one beam into account, we follow Takeuchi, Zaroubi, and Sugiyama (2014) and consider an observation cylinder aligned along the line of sight shown in figure 4 We evaluate the observed signal from the filamentary structure averaged over the observation cylinder. In this configuration, the width r and length R of one cylinder correspond to Δθ and Δν, respectively. Therefore, the signal also depends on how the observation cylinder intersects the filament structure. We introduce the parameter ϕ to describe the angle between the axes of the filament structure and the observation cylinder in figure 4. When ϕ = 0, the axis of the cylinder is completely parallel to the long axis of the filament. Laying the cylinder on a 21-cm map, we calculate the amplitude of the signal for each ϕ between −90° and 90°.
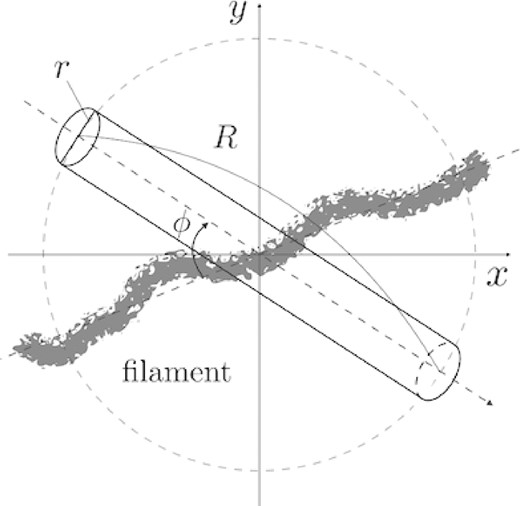
Relation between the observation cylinder along the line of sight and the filament structure that we select. R and r respectively represent the length and the width of the cylinder corresponding to the bandwidth and the angular resolution of an interferometer telescope. Also, ϕ represents the angle between the axes of the cylinder and the filament.
The redshift evolution of the 21-cm signal is shown as blue squares in figure 5. Here we set Δν = 3 MHz and show the expected signals for Δθ = 3΄, 10΄, 20΄, and 30΄ in the top left-, top right-, bottom left- and bottom right-hand panels, respectively. Since the signal amplitude depends on Δθ, the blue squares in the figure show the averaged values and the blue bars represent the maximum and minimum values between ϕ = −90° and 90°. The signals reach the maximum when ϕ = 0. Figure 5 also shows that the amplitude of the signals increases as the observation redshift increases. As mentioned above, the density contrast is small in the filamentary structures at high redshifts, because the filamentary structures do not evolve well yet. However, the baryon density itself is high at high redshifts and we find that the neutral fraction also increases. Therefore, the 21-cm signal increases with increasing the observation redshift.
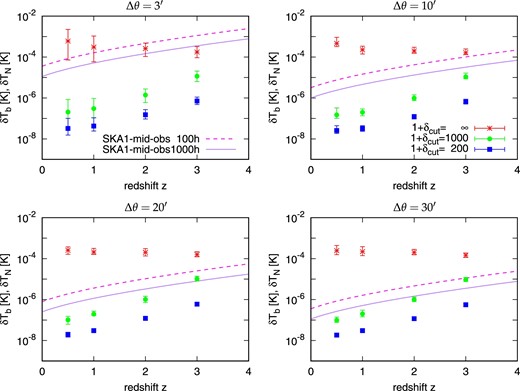
Redshift evolution of the 21-cm signal and the noise of the future interferometer telescope, SKA1-mid. The solid and dashed lines are the noise for the total observing times tobs = 1000 hr and tobs = 100 hr, respectively. The red asterisks represents the signals including galaxies, the CGM, and the WHIM in the filament. The green filled circles and the blue filled squares indicate the signals that were calculated without the overdense regions and which have density contrasts larger than δcut > 1000 (the CGM and the WHIM) and >200 (only the WHIM), respectively. The bars represent the range of the signal, between the maximum and minimum values. Here, we set the bandwidth Δν = 3 MHz and use Δθ = 3΄ (top left), Δθ = 10΄ (top right), Δθ = 20΄ (bottom left), and Δθ = 30΄ (bottom right) as the angular resolution. (Color online)
Note that, since figure 5 represents the signal in one beam computed at the center of the filament in the white square in figure 3, the signal amplitude might be different at other locations in the same or different filaments. Therefore, we also evaluate the signals at several locations in the same and other filaments, and consequently find that the results are similar to figure 5. The signals in one beam from the WHIM in filaments reaches in the order of 10−8 K. For comparison, we find that the signals in one beam including a void region are less than 10−8 K and, at most, in the order of 10−9 K. The signals from the filaments are enhanced compared with those in the voids.
Currently, the SKA1-mid is designed to be Aeff = 48900 m2, Δν = 3 MHz, and Trec = 30 K. We calculate the noise signals from equation (14) for different angular resolutions and observing time and plot them in figure 5. The solid lines represent the noise for the observing time of tobs = 1000 hr and the dashed lines for tobs = 10 hr. As shown in equation (14), the noise increases as Δθ becomes small. From comparison between the noise levels and the expected 21-cm signals from the WHIM, it turns out that the noise dominates the signals from the WHIM even for the case with the large resolution angle, Δθ = 20΄. Although probing the WHIM in filament structures is essential to resolve the missing baryon problem, we conclude that the 21-cm signal from the WHIM alone is too weak for the current SKA1-mid design to detect. Figure 5 tells that we need a sensitivity 10 times better than the SKA1-mid even for (Δθ > 20΄). Therefore, the full array SKA (SKA2) with the effective collecting area of Aeff ∼ 106 m2 possibly enables us to detect the WHIM in the future.
4 Discussion
4.1 Contribution of galaxies and IGM to the 21-cm signal
In section 3, we show that the SKA1-mid is not capable of probing the WHIM in the filamentary structures at z < 3, removing the signal contributions from galaxies in order to evaluate the detectability of the signals only from the WHIM. However, the removal of the galaxies from the 21-cm maps is not straightforward. Besides, it is expected that galaxies in filamentary structures can provide a significant contribution to the 21-cm signals from the filamentary structures, because galaxies hold a large amount of neutral hydrogen. In this section, we evaluate the contribution of galaxies to the 21-cm signals from the filament and discuss the potential of 21-cm observations to probe high-redshift filamentary structures, taking into account the contribution of the galaxies in the filaments.
First, to quantify the contribution from galaxies in the Illustris simulation data, we plot xHI as a function of the number density of the hydrogen nucleus in figure 6. The color in the figure indicates the gas temperature. In the simulation, galaxies generally locate in overdense regions, e.g., nH > 10−4 cm−3. In such high-density regions, the neutral fractions can be high owing to the self-shielding effect. As a result, these high-density regions provide a significant contribution to the 21-cm signals. Therefore, to investigate the contribution from these high-density regions, i.e., from galaxies, to the 21-cm signals, we calculate the signals including galaxies by setting δcut = ∞, and plot the results as the red asterisks in figure 5. For comparison, the green filled circles are for the case without δ > 1000 corresponding to 10 − 2 cm − 3 in figure 6. In other words, the green filled circles represent the contribution from the WHIM and circumgalactic medium (CGM).
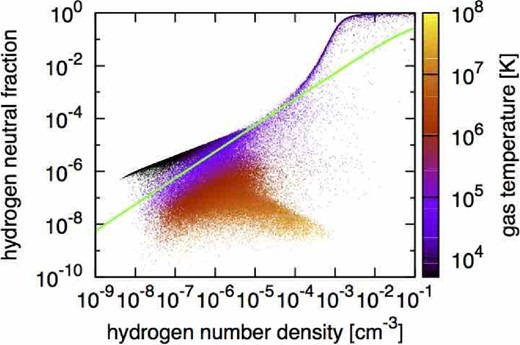
Neutral hydrogen fraction as a function of hydrogen number density at the present epoch. The colored dots represent the gas cells in the Illustris simulation, with the color indicating the gas temperature. The light-green solid line satisfies the ionization equilibrium with the fixed gas temperature of 3 × 10⁴ K. (Color online)
In the case with the small angular resolution of Δθ = 3΄, the noise is comparable with the 21-cm signals from the filamentary structure including galaxies at lower redshifts and it dominates the 21-cm signals at high redshifts. Therefore, we conclude that it is difficult to probe the filamentary structures by utilizing the SKA1-mid with Δθ = 3΄. However, the observation with Δθ = 10΄ and tobs = 1000 hr provides more than 2σ detection of the 21-cm signal even at z = 3. At lower redshifts, z < 3, the 21-cm signals completely dominate the noise levels for both tobs = 100 and 1000 hr. Although the observation with Δθ = 20΄ can easily detect the signals from the filaments up to the redshift z = 3, this resolution is not good enough to map the detailed filamentary structures. We should note that even recent galaxy surveys with SDSS (the Sloan Digital Sky Survey; e.g., Mao et al. 2017) do not unveil large-scale structures at z ≳ 1 yet. Hence, the 21-cm survey with the SKA1-mid will help us advance our understanding of the evolution of large-scale structures even though we cannot detect the signals from the WHIM.
However, galaxies host stars which produce substantial ionizing photons. In general, the neutral fraction in a galaxy is determined by the balance among the recombination, photo-ionization, and other baryon physical processes. Therefore, the appropriate evaluation of the neutral fraction in a galaxy may require higher resolution than provided by the Illustris. Our result of the 21-cm signal based on the Illustris data has uncertainty in the contribution from galaxies. Besides, from the viewpoint of solving the missing baryon problem, it is important to evaluate the 21-cm signal from the diffuse IGM components in the filamentary structures without the contribution of galaxies.
4.2 Impact of hydrodynamic processes on the 21-cm signal
The detectability of the 21-cm signals from the filament structures has also been evaluated in Takeuchi, Zaroubi, and Sugiyama (2014). In that work, the signals are evaluated from an N-body simulation with a simple thermal evolution depending on the gas number density, while our signals are based on the Illustris data in which the coupled equations of gravity and hydrodynamics are solved with the various feedback effects. This difference brings the different distributions of the neutral hydrogen fraction, and the gap consequently arises in the predicted 21-cm signals. In this subsection, we briefly demonstrate how much the hydrodynamical and feedback effects modify the neutral hydrogen fraction.
Figure 6 shows obviously that the neutral hydrogen fractions in the Illustris simulation are widely spread rather than following the light-green line. This rich distribution produces the difference between the results with and those without the hydrodynamical and feedback effects.
At high-density regions of nH > 10−4 cm−3, the neutral fractions in the Illustris are higher owing to the self-shielding effect implemented. At 10−7 cm−3 < nH < 10−5 cm−3, corresponding to the filament regions we focus on, the neutral hydrogen fractions in the Illustris are widely spread around the light-green line in figure 6. The gas in the filaments is heated by shock and feedback effects, and high collisional ionization rates are expected there, as shown by previous studies (Cen & Ostriker 1999; Davé et al. 2001; Yoshikawa et al. 2003; Bregman 2007). Therefore, the gas in such regions is distributed below the light-green line. On the other hand, the gas in the outer region of the filament is not heated effectively. As a result, the gas at this region is cooled well by the Hubble expansion and the neutral fraction increases, compared with the light-green line.
Figure 7 shows the redshift evolution of the 21-cm signals expected from the simple model described above, i.e., calculated from the light-green line in figure 6, as thick orange and light-blue bars. For comparison, we plot the signals from the Illustris data as thin red and blue bars. The simple model does not include contribution from galaxies, i.e., cold neutral components. Therefore, the signal amplitude for the simple model is lower than that for the Illustris simulation in which the galaxy contribution strongly enhances the signal, as discussed above. When we focus on the signals from the WHIM, which are obtained by not including the overdense region with δcut > 200, the difference between the simple model and the Illustris data becomes small. This is because, although figure 6 shows that the distribution of the neutral fraction in the filament region is widely spread in the Illustris data, this distribution is smoothed by the spatial resolution of the observation and the signal amplitudes are almost the same in both cases. However, at z = 3, the signal in the Illustris is stronger than that in the simple model. At such high redshifts, the typical density and cooling rate are higher. Therefore, the typical temperature of the filamentary gas in the Illustris is lower than 3 × 10⁴ K assumed in the simple model, and the resultant high recombination rate increases the neutral hydrogen in the Illustris. In addition, large-scale structure formation at higher redshift is still in the early evolutionary phase, and the galaxy feedbacks, including the gas heating, are not remarkable. As a result, at high redshifts, the 21-cm signal in the Illustris becomes stronger than that in the simple model.
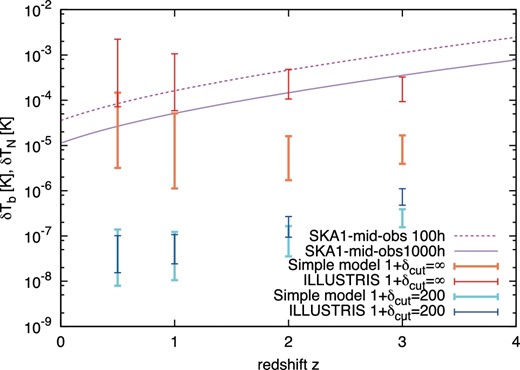
Redshift evolution of the 21-cm signals in the simple model described in the text. The thin orange bar is obtained without the density threshold for overdense regions, while the thin light-blue bar represents the case without the overdense regions and with >δcut = 200. The thin red and blue bars are for the Illustris data with δcut = ∞ and 200, respectively. The solid and dashed lines are the noise for the total observing times tobs = 1000 hr and tobs = 100 hr, respectively. Here, we set the bandwidth Δν = 3 MHz and use Δθ = 3΄. (Color online)
5 Conclusions
The measurement of 21-cm lines due to the hyperfine transition of neutral hydrogen is a powerful tool to probe the overdense regions in the IGM. Since they could allow us to survey the regions which cannot be observed by X-ray or UV/optical telescopes, it is expected that the observations of 21-cm lines may resolve the so-called missing baryon problem. In this paper, focusing the large-scale filamentary structures, we have investigated the detectability of 21-cm signals from the structures by the future radio interferometer telescope, SKA.
First, we have generated 21-cm signal maps from a state-of-the-art cosmological hydrodynamics simulation, Illustris. Using these maps, we have evaluated 21-cm signals from the WHIM in a filament. To take into account the contributions only from the WHIM, we remove the cells whose baryon density contrast exceeds δ > 200 from the maps. Our evaluations have shown that the signals for one beam from the WHIM in the filaments are in the order of 10−8 K. On the other hand, we have also found that the signal in the void regions is roughly a few 10−9 K. The WHIM can enhance 21-cm signals in the filaments. From the comparison with the expected noise levels for the current design of SKA1-mid, we have investigated the detectability of the 21-cm signals from the WHIM at different redshifts. As a result, it is found that the signals from the WHIM are too weak even for the SKA1-mid to detect. Our result suggests that a sensitivity that is 10 times better than the SKA1-mid, which is expected for the full array SKA2, is required for probing the WHIM.
Since, in the evolution of the WHIM, the hydrodynamic and feedback effects are important, we have investigated the impact of these effects on the signals from the WHIM, comparing the Illustris simulation data with a simple gas model in which the hydrodynamical and feedback effects are neglected. The Illustris data show that the values of the neutral hydrogen fraction in the filament structures are widely spread. However, this distribution is smoothed away as a result of the resolution size of the observation. Therefore, the hydrodynamical and feedback effects hardly affect the expected amplitude of the 21-cm signals from the WHIM.
It is know that the Illustris simulation adopted a strong feedback model (Schaal et al. 2016). This implies that the effects of the feedback on the signal are expected to be weaker in simulations with other feedback models, and thus the effects are likely smoothed away as a result of the resolution which can detect the signal from the filaments even if we use other simulation data.
Although it seems to be difficult to detect the signals from the WHIM, we have explored the possibility that SKA1-mid probes high redshift filamentary structures though 21-cm signals from galaxies in a filament. We have found that galaxies can host a large amount of cold neutral hydrogen due to the self-shielding effect and enhance the signals from the filament. Although the detectability depends on the angular resolution of the observation, we have shown that SKA1-mid can detect the signals from the filamentary structure with the total observing time 100–1000 hr.
In our analysis we have not taken into account the so-called “missing baselines”; an interferometer observation cannot sample signals whose scales are larger than the scale corresponding to its minimum base line. To evaluate the impact of the missing baselines on our estimated signals, we evaluate the signal components whose scales are larger than the scale corresponding to the minimum baseline of the SKA-mid. We have found that their relative contribution to the signals from the filament depends on the angular resolution and the redshift. While the contribution is 20%–30% between z = 0.5 and 3 with 10΄ resolution, it reaches 50% at z = 0.5 and completely dominates at z = 3 for the 30΄ resolution case. Therefore, it is important to take into account the missing baselines to evaluate the signals at high redshifts with large angular resolutions. However, it requires a more complete configuration design of SKA-mid and is beyond the scope of this paper.
While we have concluded that detecting the 21-cm signals from the WHIM is challenging, it is promising that SKA1-mid can probe the filamentary structures at high redshifts that we have not accessed through current galaxy surveys. The final phase of SKA, SKA2, has much better sensitivity than SKA1-mid. Therefore, it is expected that SKA2 will be able to survey the detailed structures of the filaments with a better resolution. Future 21-cm observations can provide further information on the structure formation history and important hints to address the missing baryon problem.
Acknowledgments
We are grateful to N. Sugiyama for valuable comments on our results. This work was in part supported by a grant from NAOJ (K.H.), Japan Society for the Promotion of Science (JSPS) KAKENHI Grant No. 26-2667 (S.A.), No. 15K17646 (H.T.) and MEXT’s Program for Leading Graduate Schools “Ph.D. Professionals, Gateway to Success in Frontier Asia” (H.T.).
In particular, the thermal velocity and the peculiar velocity become important in overdense regions. We find that the velocity effects could suppress the signal amplitude almost by half. However, this suppression of the signals does not modify our conclusion on the detectability of the filaments.
References
