


Abstract
The Schmidt law (SF law) in the Milky Way was investigated using 3D distribution maps of H ii regions and H i and molecular (H2) gases with spatial resolutions of ∼1 kpc in the Galactic plane and a few tens of pc in the vertical direction. H ii regions were shown to be distributed in a star-forming (SF) disk with nearly constant vertical full thickness 92 pc in spatial coincidence with the molecular gas disk. The vertically averaged volume star formation rate (SFR) ρSFR in the SF disk is related to the surface SFR ΣSFR by ρSFR/[M⊙ yr−1 kpc−3] = 9.26 × ΣSFR/[M⊙ yr−1 kpc−2]. The SF law fitted by a single power law of gas density in the form of |$\Sigma _{\rm SFR}\propto \rho _{\rm SFR}\propto \rho _{\rm gas}^\alpha$| and |$\propto \Sigma _{\rm gas}^\beta$| showed indices of α =0.78 ± 0.05 for |$\rho _{\rm H_2}$| and 2.15 ± 0.08 for ρtotal, and β = 1.14 ± 0.23 for Σtotal, where ρ and Σ denote volume and surface densities, respectively. The star formation rate is shown to be directly related to the molecular gas, but indirectly to H i and total gas densities. The dependence of the SF law on the gaseous phase is explained by the phase transition theory between H i and H2.
1 Introduction
The Schmidt (Schmidt–Kennicutt) law (hereafter star formation or SF law) linking the star formation rate (SFR) with surface density interstellar gas by a power law has been established as the universal scaling relation for many galaxies (Schmidt 1959; Kennicutt 1998a, 1998b; Komugi et al. 2006; Lada et al. 2012; Kennicutt & Evans 2012; and the large number of papers cited therein). In the Milky Way, however, the SF relation has been obtained for individual star-forming regions, clouds, and/or restricted regions and arms (Luna et al. 2006; Fuchs et al. 2009; Heiderman et al. 2010; Willis et al. 2015; Heyer et al. 2016; and the references therein), but the law in the entire Galaxy, comparable to that for galaxies, seems not to have been obtained.
Star formation in the Galactic disk is regulated by sequential transition of interstellar gas from H i to molecules followed by contraction of clouds to form stars. The current SF law for the surface density of gas, therefore, includes the effect of phase transition from H i to molecules, which are not related linearly (Elmegreen 1993; Sofue & Nakanishi 2016).
This paper aims to derive the global SF law in the entire Galaxy, both for volume and surface densities, and clarifies effects dependent on the gas phases of H i and H2. We use the catalogue of H ii regions (Hou & Han 2014) and the 3D maps of H i and H2 gases (Nakanishi & Sofue 2003, 2006, 2016), which were constructed from the Leiden–Argentine–Bonn All Sky H i survey (Kalberla et al. 2005) and the Galactic disk CO line survey (Dame et al. 2001). Surface and volume SFR are denoted by ΣSFR and ρSFR, respectively, and “SFR” in the text and figures means ΣSFR, unless otherwise noted.
2 Distributions of H ii regions and interstellar gas
2.1 Star-forming disk
Figure 1 shows the distribution of H ii regions made from the catalogue by Hou and Han (2014). The distances are scaled to a galacto-centric distance of the Sun at 8.0 kpc instead of their 8.5 kpc. The H ii regions are superposed on the map of surface densities of H i (red) and H2 (green) gases projected on the galactic (X, Y) plane. Also shown are the projection of the H ii regions on the (X, Z) plane superposed on the cross section of the gaseous disk (Nakanishi & Sofue 2003, 2006, 2016).

Both the H ii and gas distributions were obtained for similar rotation curves, which are almost the same inside the solar circle and are similarly flat in the mapped region of the H ii regions. Thus, the kinematical distances of H ii regions and the gas coincide within errors of a few hundred pc. This accuracy is enough for the present analysis at a typical resolution of ∼±0.5 kpc.
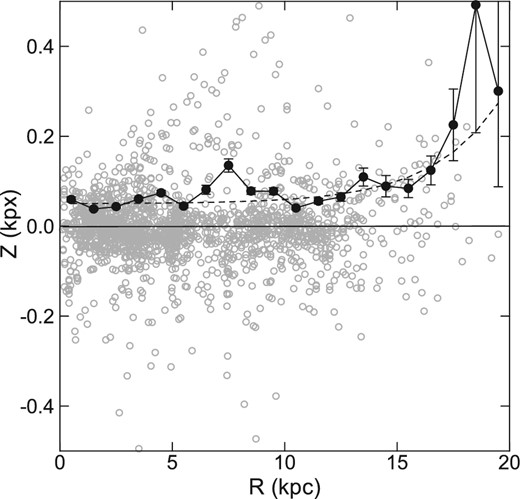
Distribution of H ii regions in (R, Z) plane (gray dots). Black circles are mean absolute values of Z averaged in 1 kpc intervals of radius. The dashed line is an approximate fit to the mean height.
In order to determine h more precisely, we plot in figure 3 the vertical distribution of the number of H ii regions at 1 ≤ R ≤ 10 kpc. The distribution can be fitted by a Gaussian distribution of e-folding scale height of h = 46 pc, and hence full thickness of 2h = 92 pc. This matches well with the molecular gas full thickness of 90 to 100 pc inside the solar circle (Nakanishi & Sofue 2006; Heyer & Dame 2015).
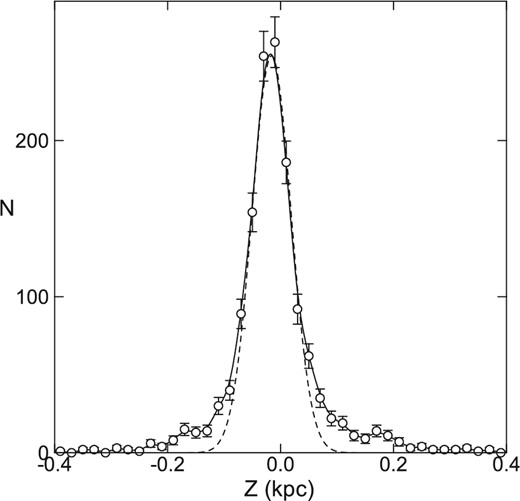
Number of H ii regions N per Z interval of 0.02 kpc in 1 ≤ R ≤ 10 kpc (open circles with error bars by |$\pm \sqrt{N}$|). The dashed curve is an approximate fit to the plot by a Gaussian function of e-folding scale thickness h = 0.046 kpc.
2.2 Definition of SFR
2.3 Correction of incompleteness
2.4 Distributions of SFR, H2, H i, and total gas densities
We constructed a map of the surface distribution of the SFR in the entire Galaxy as shown in figure 4, which shows the distribution of SFR as defined by equation (4) for both the raw and corrected values for the detection probability. The map was obtained by Gaussian smoothing of the SFR calculated for individual H ii regions in figure 1 at 0.2 × 0.2 kpc grids with a Gaussian beam of FWHM 1 kpc (±0.5 kpc). It is shown that the corrected SFR is more smoothly distributed over the Galactic disk.
The distribution of SFR may be compared with the distribution maps of neutral gases in the Galaxy as shown in figures 5 and 6 individually for H2, H i, and total gases. The spatial resolution in these maps is 0.5 to 1 kpc in the galactic plane, depending on the distance and direction from the Sun for their kinematical distances. The vertical resolution of the original 3D cubes of H i and H2 maps is about 20 to 50 pc, while here we discuss the volume densities near the galactic plane, and the surface densities projected on the galactic plane.
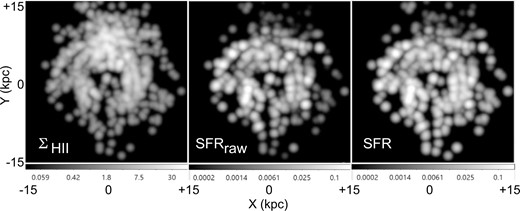
Left: Distribution of surface number density of H ii regions |$\Sigma _{\rm H\,{\small ii}}$| (same as figure 1, but Gaussian smoothed) by logarithmic scaling in units of number per kpc−3 as indicated by the bar. Middle: Raw SFR (|$\Sigma _{\rm H\,{\small ii}}\times$|luminosity) by logarithmic intensity scaling in units of M⊙ yr−1 kpc−3. Right: SFR, same as middle but corrected for detection probability.
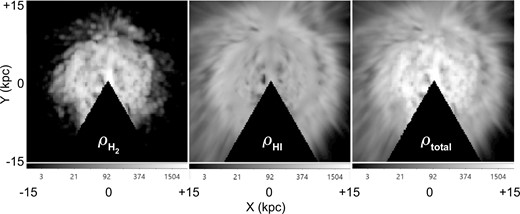
Distributions of volume densities ρ of H2, H i, and total gas density. The intensity scale is logarithmic in units of 0.01 H cm−3.
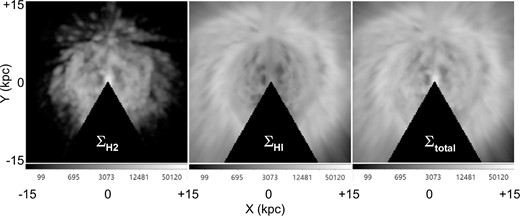
Distributions of integrated column (surface) densities Σ of H2, H i, and total gas density. The intensity scale is logarithmic in units of 0.001M⊙ pc−2.
As shown later by Schmidt plots, the clearest correlation is seen between the SFR and the volume and surface densities of the molecular gas. On the other hand, there appears little correlation between the SFR and H i densities.
3 Star formation law
3.1 SF power-law index
Given the distribution maps of SFR and volume and surface densities of H2, H i, and total gases in the entire Galaxy, we now analyze the SF relation. The upper panels of figure 7 show logarithmic plots of SFR against volume densities |$\rho _{\rm H_2}$|, |$\rho _{\rm H\,{\small i}}$|, and ρtot. Similar plots were obtained for the surface mass densities of gas, as shown in the lower panels of figure 7. Figure 8 shows the same SF laws, but logarithmic values of SFR are averaged in 0.2 dex bins of the gas densities.
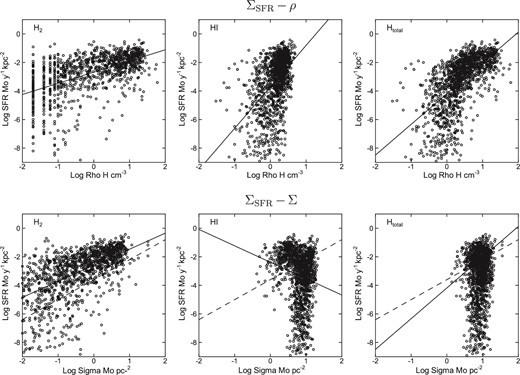
Upper panels: SF law for volume gas densities |$\rho _{\rm H_2}$|, |$\rho _{\rm H\,{\small i}}$|, and ρtot. Lower panels: SF law for surface (column) gas densities |$\Sigma _{\rm H_2}$|, |$\Sigma _{\rm H\,{\small i}}$|, and |$\Sigma _{\rm H_{total}}$|. Solid lines show the least-squares fit result, and the dashed line shows the Kennicutt (1998a, 1998b) law.

The ΣSFR–|$\rho _{\rm H_2}$| and ΣSFR–ρtot plots exhibit the well-known Schmidt law. However, the ΣSFR–|$\rho _{\rm H\,{\small i}}$| plot does not show any clear SF law, but they are spread around a constant H i density of |$\rho _{\rm H\,{\small i}}\sim 1$|–2.
The SF law for volume total density has dual slopes, one for the major part at higher density of |$\rho _{\rm H_2} \gtrsim 2\:$|H cm−3, and the other an almost vertical distribution around |$\rho _{\rm H\,{\small i}}\sim 2\:$|H cm−3. The same behavior is observed in the ΣSFR–|$\Sigma _{\rm H\,{\small i}}$| and ΣSFR–Σtot plots at ∼2 M⊙ pc|$^{^2}$|. These facts indicate that there is a critical density, only above which the star formation is settled.
However, no clear power-law relation was found with the H i volume density. Also, no clear correlation was found in the ΣSFR–|$\Sigma _{\rm H\,{\small i}}$| and ΣSFR–Σtot plots. The former lack of correlation is due to the saturation of H i volume density in the galactic disk. The latter lack with H i and total surface densities is due to the thick H i disk that contributes to most of the column across the gas disk.
SF law index and coefficient for ΣSFR and ρSFR.
| Gas phase | α | A for ΣSFR | A for ρSFR |
|---|---|---|---|
| ρ H2 | 0.78 ± 0.05 | − 2.68 ± 0.05 | − 1.71 ± 0.05 |
| ρ H i | 2.91 ± 0.14 | − 3.71 ± 0.05 | − 2.74 ± 0.05 |
| ρ total | 2.15 ± 0.08 | − 4.18 ± 0.06 | − 3.21 ± 0.06 |
| β | B | ||
| Σ H2 | 1.12 ± 0.05 | − 2.60 ± 0.05 | |
| Σ H i | − 1.15 ± 0.16 | − 2.38 ± 0.13 | |
| Σ total | 1.14 ± 0.23 | − 4.34 ± 0.22 |
Meaningful fits were obtained for ΣSFR–|$\rho _{\rm H_2}$|, ΣSFR–ρtot, and ΣSFR–|$\Sigma _{\rm H_2}$|, as shown by the straight lines in figures 7 and 8. The fitted values are listed in table 1, together with other automatic outputs for |$\rho _{\rm H\,{\small i}}$|, |$\Sigma _{\rm H\,{\small i}}$|, and Σtot.
4 Summary and Discussion
4.1 Summary
The Schmidt–Kennicutt law in the entire Milky Way was investigated using 3D distributions of H ii regions and H i and H2 gases at spatial resolutions of ∼1 kpc in the Galactic plane and a few tens of pc in the vertical direction. The vertical scale thickness of the distribution of H ii regions was shown to be nearly constant with a Gaussian-fitted full thickness of 92 pc, coinciding with that of the molecular gas disk. The vertically averaged volume star formation rate ρSFR is thus shown to be related to the surface SFR ΣSFR by ρSFR/[M⊙ yr−1 kpc−3] = 9.26 × ΣSFR/[M⊙ yr−1 kpc−2]. The SF law fitted by a single power law of gas density in the form of |$\Sigma _{\rm SFR}\propto \rho _{\rm SFR}\propto \rho _{\rm gas}^\alpha$| and |$\propto \Sigma _{\rm gas}^\beta$| showed indices of α = 0.78 ± 0.05 for |$\rho _{\rm H_2}$| and 2.15 ± 0.08 for ρtotal, and β = 1.14 ± 0.23 for Σtotal, where ρ and Σ denote volume and surface densities, respectively.
4.2 Direct SF relation to H2
The tightest correlation was found for the SFR–H2 plot among all the other plots in figure 7. The power-law index of |$\alpha _{\rm H_2}\sim 0.78$| is about half of the index for the total gas, αtotal ∼ 2.15. This implies that the star formation is directly related to molecular gas through spontaneous condensation of molecular clouds. This is consistent with the fact that the scale thickness of the disk of H ii regions (the SF disk) is almost exactly equal to that of the molecular gas disk.
4.3 Indirect relation to H i
The 3D H2 and H i maps of the Galaxy (Nakanishi & Sofue 2003, 2006, 2016) exhibit significant differences in their distributions. H2 is tightly concentrated on the galactic plane, making a thin and dense molecular disk. Also, it is distributed mostly inside the molecular front at R ∼ 8 kpc, while H i is widely distributed in the entire disk surrounding the molecular disk with thickness several times that of the H2 disk. On the other hand, the outer gas disk R ≳ 8 kpc is dominated by H i with little molecular gas, predicting little star formation. These conditions make the correlation between SFR and surface (column) densities of H i and total gases less tight compared to that for the volume densities.
4.4 Steeper and/or dual power-law behavior for total gas
4.5 Comparison with extragalactic values
The Galactic SF law may be compared with that derived for external galaxies, where surface densities are used. The Galactic value, βtotal ∼ 1.14, is close to the often quoted value for galaxies, βtotal, galaxies ≃ 1.4 (Kennicutt 1998a, 1998b). The index |$\alpha _{\rm H_2}\sim 0.78$| for molecular volume density is close to that obtained for resolved regions in extragalactic molecular disks of β ∼ 1.0 (Bigiel et al. 2008). However, it is significantly smaller than that in dense gas disks of galaxies with ∼1–2 (Komugi et al. 2005, 2006).
4.6 Comparison with SF law for individual SF regions
The present spatial resolution may be too crude to discuss tighter correlations more directly related to star formation from individual molecular clouds. The observed number of H ii regions is also not large enough for such a purpose. In fact, the present result for molecular gas is much smaller than the index of ∼2 obtained for individual galactic SF regions and molecular clouds by Willis et al. (2015) and similar values by Heiderman et al. (2010).
References
