


Abstract
We report the results of Suzaku observations of the young supernova remnant, Vela Jr. (RX J0852.0−4622), which is known to emit synchrotron X-rays, as well as TeV gamma-rays. Utilizing 39 Suzaku mapping observation data from Vela Jr., a significant hard X-ray emission is detected with the hard X-ray detector (HXD) from the northwest TeV-emitting region. The X-ray spectrum is reproduced well by a single power-law model with a photon index of |$3.15^{+1.18}_{-1.14}$| in the 12–22 keV band. Compiling this hard X-ray spectrum with the soft X-ray spectrum simultaneously observed with the X-ray imaging spectrometer (XIS) onboard Suzaku, we find that the wide-band X-ray spectrum in the 2–22 keV band is reproduced with a single power-law or concave broken power-law model, which are statistically consistent with each other. Whichever of the two models, single or broken power-law, is appropriate, clearly the spectrum has no roll-off structure. Applying this result to the method introduced in Yamazaki et al. (2014, Res. Astron. Astrophys., 14, 165), we find that a one-zone synchrotron model with electron spectrum having a power-law plus exponential cut-off may not be applicable to Vela Jr.
1 Introduction
Several supernova remnants (SNRs) are known as sites of acceleration of cosmic-ray particles with the energy of up to TeV. The first observational evidence is discovered by Koyama et al. (1995) in the X-ray band. They found X-rays from shell regions of SN 1006 with ASCA, and revealed that the X-rays are produced via synchrotron radiation by TeV electrons.
We have not yet succeeded observationally in determining the maximum energy and acceleration efficiency of protons or even electrons, which are the key to understanding the acceleration site of Galactic cosmic rays. In the context of diffusive shock acceleration, particles with a higher energy require a longer acceleration time, while they have a shorter cooling and escape time (e.g., Drury 2011; Lagage & Cesarsky 1983). These timescales are functions of a diffusion coefficient of accelerated particles around the shock (Bell 1987; Ohira et al. 2010). Curvature in a X-ray synchrotron spectrum depends on the energy spectrum of highest-energy electrons there. Measuring the spectral shape (i.e., slope or photon index, roll-off frequency and spectral curvature) expected to be observed in the X-ray synchrotron emission is crucial to understand the environment and mechanism of cosmic ray acceleration (Yamazaki et al. 2014, 2015).
So far, wide-band X-ray spectra have been extensively studied in several SNRs; e.g., RX J1713.7−3946 (Takahashi et al. 2008; Tanaka et al. 2008), SN 1006 (Bamba et al. 2008), Cassiopeia A (Maeda et al. 2009), and G1.9+0.3 (Zoglauer et al. 2015). Roll-off frequencies are reported from a number of SNRs. Bamba, Yamazaki, and Hiraga (2005a) reported roll-off energies distributing 0.07–11.6 keV, from Cas A, Kepler SNR, Tycho SNR, and RCW 86. Utilizing hard X-ray spectra obtained with NuSTAR, the roll-off energies of >2 keV and 1.27 ± 0.07 keV were observed from Tycho SNR (Lopez et al. 2015) and G1.9+0.3 (Zoglauer et al. 2015), respectively. TeV gamma-rays have also been observed from a number of SNRs, and are thought to be produced via inverse Compton scattering of TeV electrons or via π0 decay process of high-energy protons (e.g., Aharonian et al. 2004).
The young SNR Vela Jr. (RX J0852−4622) was discovered by ROSAT in 1998 (Aschenbach 1998). It is a TeV-emitting SNR, and has a diameter of 2°. It overlaps with the southeast portion of the much larger and known Vela SNR, and is situated near the pulsar and pulsar wind nebulae (PWN) of Vela SNR. Vela Jr. has a synchrotron X-ray shell (Slane et al. 2001; Bamba et al. 2005b), which is observed also in radio (Combi et al. 1999) and gamma-rays (Aharonian et al. 2005). Fukui (2013) reported a spatial correlation between the radio emission from molecular clouds around Vela Jr. and TeV gamma-rays. Magnetic field strength at the shock surface of Vela Jr. has been estimated by some authors. While Bamba et al. (2005b) estimated the field strength, B ∼ 5 × 10² μG from the thickness of X-ray thin shell taken by Chandra, Kishishita, Hiraga, and Uchiyama (2013) derived B ∼ 5–20 μG, by comparing the brightness distribution profile at the shell in 2–10 keV with the expected radial profile by Petruk et al. (2011). Lee et al. (2013) constructed a 1D, spherically symmetric model of non-linear diffusive shock acceleration, and obtained B ∼ 4.8 μG from observation results, assuming synchrotron X-rays and cosmic microwave background photons upscattered to TeV gamma-rays. The observed spectral slope is so steep that we naturally expect that the synchrotron roll-off energy is below 1 keV, and the spectrum becomes much softer for higher energy bands. However, the synchrotron emission above 10 keV has not been observed for Vela Jr., and thus the spectral shape has not yet been determined. In order to determine the photon index and to examine the expected roll-off structure, wideband X-ray observation covering above 10 keV is important. The X-ray astronomy satellite Suzaku (Mitsuda et al. 2007) covers the energy range of 0.2–600 keV with four units of X-ray Imaging Spectrometers (XISs: Koyama et al. 2007) and the Hard X-ray Detector (HXD: Takahashi et al. 2007). Since both instruments have very low-background capabilities (Tawa et al. 2008; Fukazawa et al. 2009), which enable us to perform high-sensitivity surveys of X-rays, Suzaku is most suitable for diffuse objects. We report the first result of spectral analysis of wideband observation of Vela Jr. with Suzaku. We describe Suzaku observations and data reduction of Vela Jr. in section 2, summarize results of analysis in section 3, and present a discussion in section 4.
2 Observation and data reduction
We performed 40 mapping observations of Vela Jr. and its close vicinity in 2005 December, 2007 July, and 2008 July. Table 1 shows the observation details. Hereafter, we refer to each observation position in an abbreviated style by clipping each object name. For example, we call Vela JR P1 as P1, and RXJ_0852−4622_NW as NW.
Basic parameters of the Suzaku observations.*
| Name | ObsID | Date (YYYY-MM-DD) | RA (°) | Dec (°) | Exposure (ks) |
|---|---|---|---|---|---|
| VELA JR P1 | 502023010 | 2007-07-04 | 131.98 | −45.806 | 10.7 |
| VELA JR P2 | 502024010 | 2007-07-04 | 132.17 | −45.775 | 8.26 |
| VELA JR P3 | 502025010 | 2007-07-04 | 132.12 | −45.604 | 6.70 |
| VELA JR P4 | 502026010 | 2007-07-05 | 132.52 | −45.545 | 10.3 |
| VELA JR P5 | 502027010 | 2007-07-05 | 132.91 | −45.488 | 10.7 |
| VELA JR P6 | 502028010 | 2007-07-05 | 133.33 | −45.485 | 7.15 |
| VELA JR P7 | 502029010 | 2007-07-05 | 133.78 | −45.583 | 11.8 |
| VELA JR P8 | 502030010 | 2007-07-06 | 133.86 | −45.861 | 13.2 |
| VELA JR P9 | 502031010 | 2007-07-06 | 133.42 | −45.763 | 8.64 |
| VELA JR P10 | 502032010 | 2007-07-06 | 133.00 | −45.766 | 10.2 |
| VELA JR P11 | 502033010 | 2007-07-07 | 132.60 | −45.826 | 11.3 |
| VELA JR P12 | 502034010 | 2007-07-08 | 132.25 | −46.051 | 9.75 |
| VELA JR P13 | 502035010 | 2007-07-09 | 131.85 | −46.106 | 9.41 |
| VELA JR P14 | 502036010 | 2007-07-09 | 131.93 | −46.386 | 10.7 |
| VELA JR P15 | 502037010 | 2007-07-10 | 132.33 | −46.329 | 8.88 |
| VELA JR P16 | 502038010 | 2007-07-10 | 132.68 | −46.105 | 15.1 |
| VELA JR P17 | 502039010 | 2007-07-10 | 133.09 | −46.046 | 7.83 |
| VELA JR P18 | 502040010 | 2007-07-10 | 133.51 | −46.042 | 12.8 |
| VELA JR P19 | 503031010 | 2008-07-03 | 133.98 | −46.148 | 17.7 |
| VELA JR P20 | 503032010 | 2008-07-04 | 133.62 | −46.327 | 13.4 |
| VELA JR P21 | 503033010 | 2008-07-04 | 133.20 | −46.330 | 11.8 |
| VELA JR P22 | 503034010 | 2008-07-05 | 132.44 | −46.613 | 14.7 |
| VELA JR P23 | 503035010 | 2008-07-05 | 132.79 | −46.395 | 10.7 |
| VELA JR P24 | 503036010 | 2008-07-05 | 132.03 | −46.673 | 12.4 |
| VELA JR P25 | 503037010 | 2008-07-06 | 132.52 | −46.892 | 11.4 |
| VELA JR P26 | 503038010 | 2008-07-06 | 132.88 | −46.669 | 10.7 |
| VELA JR P27 | 503039010 | 2008-07-06 | 133.28 | −46.606 | 11.0 |
| VELA JR P28 | 503040010 | 2008-07-07 | 133.71 | −46.604 | 10.9 |
| VELA JR P29 | 503041010 | 2008-07-07 | 134.07 | −46.430 | 8.04 |
| VELA JR P30 | 503042010 | 2008-07-07 | 134.17 | −46.704 | 10.1 |
| VELA JR P31 | 503043010 | 2008-07-08 | 133.80 | −46.885 | 10.6 |
| VELA JR P32 | 503044010 | 2008-07-08 | 133.37 | −46.887 | 7.64 |
| VELA JR P33 | 503045010 | 2008-07-08 | 133.47 | −47.162 | 11.0 |
| VELA JR P34 | 503046010 | 2008-07-09 | 132.11 | −46.950 | 10.6 |
| VELA JR P35 | 503047010 | 2008-07-09 | 132.97 | −46.947 | 8.65 |
| VELA JR P36 | 503048010 | 2008-07-09 | 133.06 | −47.224 | 9.36 |
| VELA JR P37 | 503049010 | 2008-07-09 | 132.61 | −47.170 | 12.3 |
| VELA JR P38 | 503050010 | 2008-07-10 | 132.20 | −47.231 | 10.4 |
| RXJ_0852−4622_NW | 500010010 | 2005-12-19 | 132.29 | −45.616 | 161 (XIS)/215 (PIN) |
| RXJ_0852−4622_NW_offset | 500010020 | 2005-12-23 | 135.13 | −47.910 | 54.5 |
*The exposures are the ones after processing and of the XIS, unless otherwise noted.
One of the two types of instruments of Suzaku is a set of the XISs, each of which is installed on the focal plane of an individual set of the X-ray telescopes (XRTs: Serlemitsos et al. 2007.) The XIS covers a field of view (FOV) of 17|${^{\prime}_{.}}$|8 × 17|${^{\prime}_{.}}$|8 with the angular resolution of 2′ in half power diameter in the energy range of 0.2–12 keV. The XIS 0, 2, and 3 are front-side illuminated (FI) CCDs, whereas XIS 1 is a back-side illuminated (BI) CCD. FI CCDs are more sensitive in the energy band above 5 keV because the depletion layers are thicker than those of a BI CCD. We use only XIS 0, 1, and 3 data because XIS 2 has not been operational since 2007. Spaced-row charge injections (Nakajima et al. 2008; Uchiyama et al. 2009) were carried out in all the observations except NW and NW_offset. We use the software package Heasoft 6.12 with CALDB 2009-08-04 for the analysis and xspec v12.7.1 for the spectral analysis.1 Each observation data is reprocessed by aepipeline 1.0.1. We extract events based on the following criteria: elevation angle from night Earth >5°, elevation angle from day Earth >20°. We remove calibration source regions at the corner of the FOV.
The HXD is a well-type phoswitch counter, whose main detection-part consists of silicon detectors and GSO crystal scintillators. The silicon PIN type semiconductor detector covers the hard X-ray band of 10–70 keV, and has a FOV of 34′ × 34′. The GSO crystal scintillators cover the band of 40–600 keV. We do not present the result of the GSO because no significant detection is made. Since the well-type active shield provides low-background environment for the PIN detector, it is one of the ideal detectors to observe low-surface-brightness objects like SNRs. We extract events which have an elevation angle of >5° and geomagnetic cut-off rigidity of >6 GV.
3 Spectral analysis
3.1 XIS
We begin with the analysis of the XIS data. Figure 1 shows the mosaiced XIS image of Vela Jr. in 2–5 keV, which is created with ximage, combining the exposure and vignetting-effect corrected image of each observation. Shell structures of Vela Jr. are clearly visible. We focus on the NW shell which is detected in TeV gamma-rays (Katagiri et al. 2005) and reportedly shows bright synchrotron X-ray filaments (Bamba et al. 2005b). In order to match the data with those of the HXD-PIN, we selected the region inside the FOV of the PIN NW observation which is a square sky region with apexes of (133.37, −45.69), (132.17, −46.45), (131.09, −45.61), and (132.29, −44.86) in equatorial coordinates. Consequently, the entire regions of NW, P1, P2, P3, P4, P11, and P12, and parts of P5, P6, P9, P10, P13, P14, P15, P16, and P17 are included. The spectra are summed with mathpha in units of counts without exposure weighting. The errors are propagated as Poisson errors. Response files are created with marfrmf from redistribution matrix files (rmfs) made by xisrmfgen and ancillary response files (arfs) made by xissimarfgen (Ishisaki et al. 2007), based on the XIS 2–5 keV image file within the FOV of the PIN NW observation. We add all the XIS responses of each observation with the weight of each exposure time.

Mosaiced XIS image of Vela Jr. in the 2–5 keV band. The exposure is corrected, but the CXB is not subtracted. The regions of the calibration sources are removed. The green and magenta boxes show the FOVs of the XIS of all the observations and of the PIN during the NW observation, respectively. The coordinates are in the J2000 equatorial system.
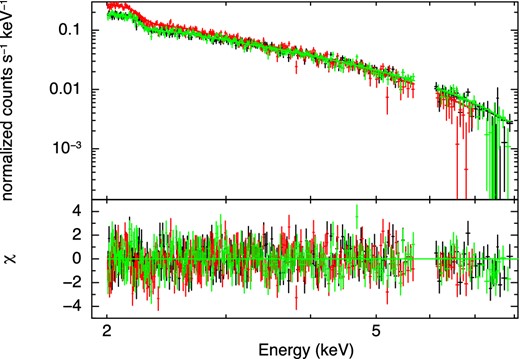
Since the object extends toward the outside of the XIS FOV, we should evaluate background spectra carefully. We here employed the XIS spectra from the observation RXJ_0852−4622_NW_offset (table 1: NW_offset) as the background spectra. However, we must consider the difference in Non X-ray Background (NXB) by the difference of the observation days. The NW_offset spectra were obtained in the winter of 2005, while the source spectra are the sum of observations in the winter of 2005 and the summer of 2007. In order to evaluate the possible temporal variation of NXB, we made the background spectra (A) by replacing the NXB component. The NXB component of each occasion is reproduced by xisnxbgen which makes use of the NXB database of the night-Earth observations of Tawa et al. (2008) extracting the data from 4 months before to 16 months after an observation. In addition, to examine possible contaminate sources in the NXB_offset FOV, we compare the background spectra with the NXB plus the Cosmic X-ray Background (CXB) as estimated by Kushino et al. (2002) (B). Above backgrounds are summarized in figure 2 and we confirmed the background spectra are consistently reproduced within the errors. Then, we safely adopt the NW_offset background, also ignoring the energy range of 5.9 ± 0.2 keV to eliminate scattered 55Fe line from the decaying calibration source during the observations.
Background spectrum of the XIS 0 in 2.0–8.0 keV band. The black, red, and green lines denote the NW_offset, the NXB-replaced background (A), and the simulated NXB plus modeled CXB (Kushino et al. 2002) background (B), respectively.
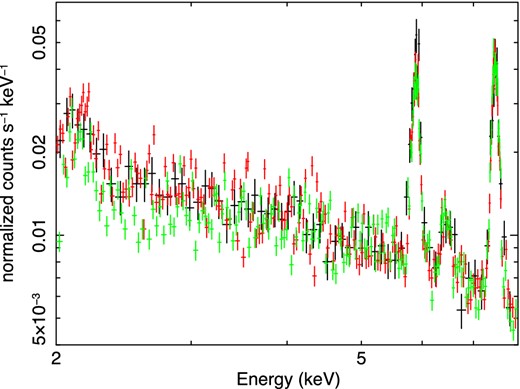
We evaluate background-subtracted XIS spectra by fitting with a power-law function with the Galactic absorption: phabs*powerlaw. The absorption column density is fixed at 6.7 × 1021 cm−2, which is the best-fitting value derived by Hiraga et al. (2009), with the metal abundance adopted from Anders and Grevesse (1989). We ignore the energy range of below 2 keV to avoid thermal contamination from Vela SNR (Hiraga et al. 2009). Figure 3 shows the XIS spectra, and table 2 shows the best-fitting parameters.
Upper panel: XIS spectra fitted with a single power-law model in the 2.0–8.0 keV band. Lower panel: χ-residuals between the data and the best-fitting model. The black, red, and green lines denote the XIS 0, 1, and 3 data, respectively. (Color online)
Best-fitting parameters for a power-law model for the XIS spectra and the PIN spectrum.*
| Parameter | XIS† | HXD-PIN‡ |
|---|---|---|
| Photon index | 2.93 ± 0.02 | |$3.15^{+1.18}_{-1.14}$| |
| Flux | 4.43 ± 0.03 × 10⁻¹¹§ | 8.26 ± 1.44 × 10⁻¹²‖ |
| [erg cm−2 s−1] | ||
| χ2/d.o.f. | 732.16/658 | 0.87/4 |
| Parameter | XIS† | HXD-PIN‡ |
|---|---|---|
| Photon index | 2.93 ± 0.02 | |$3.15^{+1.18}_{-1.14}$| |
| Flux | 4.43 ± 0.03 × 10⁻¹¹§ | 8.26 ± 1.44 × 10⁻¹²‖ |
| [erg cm−2 s−1] | ||
| χ2/d.o.f. | 732.16/658 | 0.87/4 |
*Errors are for a single parameter of interest in 90% confidence.
†The absorbing column density is set to be 6.7 × 1021 cm−2, referring to Hiraga et al. (2009).
‡The model contains the fixed GRXE component and the normalization is corrected (see text).
§The flux at the range of 2–10 keV.
‖The flux at the range of 12–22 keV.
3.2 HXD-PIN
To identify pointings which show significant hard X-ray signals with HXD-PIN, we compare the background-subtracted count-rates of each observation with the systematic error of the corresponding simulated background spectrum. We employ a modeled CXB from Bold and Leiter (1987) and simulated NXB spectrum with hxdpinxbpi, the latter of which is calculated on the basis of an observed NXB spectrum during Earth occultation. The expected uncertainty of the NXB model is reported as 3% in 10–60 keV by Fukazawa et al. (2009). The PIN detection significance is determined with the NXB reproducibility. Since hard X-ray sources RCW 38 and IGR J09026−4812 contaminate the NW_offset observation, those offset observations are not used to estimate the NXB and CXB backgrounds for this HXD-PIN analysis. We ignore the energy band below 12 keV to avoid thermal noise. Consequently, we obtain six observations that exceed 1σ significance level of NXB uncertainty in the 10–60 keV band: P1, P2, P3, P5, P13, and NW, all of which are located in the northwest of Vela Jr.
To confirm the detections, we re-evaluate the uncertainty of the NXB model for each observation by comparing the count rate of the CXB-subtracted signal with that of each simulated NXB in the 10–60 keV band. For the NXB, we derive the count rate during Earth occultations during each observation. All but the NW contained some periods of Earth occultations. For the NW observation, we used the Earth occultation data obtained in the observations conducted immediately before and 26 hours after the NW observation: E0102−72 (ObsID 100044010) and NGC 4388 (ObsID 800017010). Comparing those with the count rate of the model, we estimate the systematic uncertainties of the NXB model to be ∼7%, 6%, 0.2%, 0.5%, 9%, and 1% for positions P1, P2, P3, P5, P13, and NW, respectively, in 10–60 keV. P1, P2, and P13 have larger uncertainty than the nominal value reported in Fukazawa et al. (2009) because the exposures of Earth occultation were short. A significant emission to 21.9 keV from the position NW is detected at a 3σ confidence level, whereas those from the other observations are detected at only 0.5–1.5σ levels.
In order to examine the PIN spectrum of diffuse objects, we need to calculate the effective areas for which the angular response is convolved (“arf” in the xspec), based on the source brightness distribution within the FOV. We assume that the spatial distribution in the hard X-ray band with PIN is the same as the CXB-subtracted XIS 2–5 keV images (subsection 3.1). The proper response of the PIN detectors has a pyramidal shape. However, for simplicity, we divide the spatial distribution within the PIN FOV by 9 × 9 grids and make 81 arfs in total with hxdarfgen, assuming that a point source centered in each section is responsible for the entire flux from the section in making an arf in each section. Then we sum up these arfs with addarf with weights calculated from the XIS image. Practically, this procedure is to approximate the original pyramidal angular response by 9 × 9 prisms. We calculate the ratio of the geometric integrations of the 81 prisms to the pyramid to be 0.8. Thus, the flux based on this arf should come out at the value 1/0.8 = 1.25 times larger than the real one.
We validate this ratio of the normalizations with another pair of data sets: (A) the effective area derived with this method for the 9 × 9 section with a uniform weight, (B) that calculated from the numerically simulated flat-sky response file, which is delivered by the HXD team. We confirm that the ratio of the former (A) to the latter (B) is ∼0.8 and so is consistent with the value calculated above.
Now that the method is validated, we make the arf for our HXD-PIN spectrum with this method, assuming the HXD-PIN spatial distribution of Vela Jr. to be the same as the CXB-subtracted brightness distribution observed with the XIS. We find that 39 out of the 81 sections inside Vela Jr. show no significant XIS signal and hence give them the weight of zero in calculating the arf for the HXD-PIN spectrum. Figure 4 displays the employed sections, and table 3 lists the weights. All the flux values presented hereafter are corrected for the above-mentioned factor.
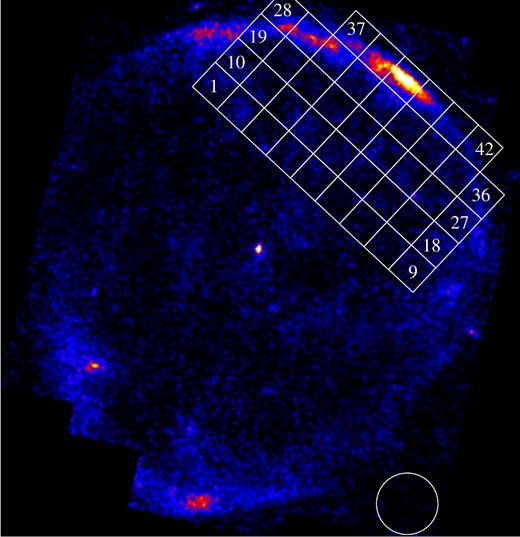
42 white boxes used to estimate the arf, in which the significant X-ray emission was detected with the XIS (see text). A white circle is the region for estimating the background. The image is the same as figure 1. (Color online)
Weights for making arfs of the PIN.*
| Pointing ID | Weight | Pointing ID | Weight |
|---|---|---|---|
| 1 | 0.018 | 22 | 0.012 |
| 2 | 0.020 | 23 | 0.013 |
| 3 | 0.012 | 24 | 0.017 |
| 4 | 0.014 | 25 | 0.016 |
| 5 | 0.013 | 26 | 0.016 |
| 6 | 0.009 | 27 | 0.021 |
| 7 | 0.009 | 28 | 0.033 |
| 8 | 0.009 | 29 | 0.068 |
| 9 | 0.015 | 30 | 0.053 |
| 10 | 0.019 | 31 | 0.028 |
| 11 | 0.013 | 32 | 0.032 |
| 12 | 0.014 | 33 | 0.016 |
| 13 | 0.017 | 34 | 0.016 |
| 14 | 0.015 | 35 | 0.018 |
| 15 | 0.013 | 36 | 0.021 |
| 16 | 0.013 | 37 | 0.034 |
| 17 | 0.009 | 38 | 0.076 |
| 18 | 0.022 | 39 | 0.119 |
| 19 | 0.034 | 40 | 0.051 |
| 20 | 0.013 | 41 | 0.022 |
| 21 | 0.010 | 42 | 0.008 |
*The pointing IDs are shown in figure 4.
Using the arf for Vela Jr. NW with the officially delivered responses for the flat sky and a point source, we examine the observed hard X-ray spectrum in detail. First, we evaluate possible contamination of the galactic ridge X-ray emission (GRXE: Krivonos et al. 2007), given the fact that Vela Jr. is on the Galactic plane. We use the NXB-subtracted XIS spectrum of the offset observation as the background template for the HXD data of Vela Jr. We fit it with, in addition to the fixed CXB model (Kushino et al. 2002), the GRXE model, for which we employ a photo-absorbed two-temperature thermal plasma emission model. The assumed absorption column density NH is 4.0 × 1022 cm−2 and two temperatures kT1 and kT2 of thermal plasma model (apec in xspec) are 1.66 keV and 15.1 keV (table 4 of Yuasa et al. 2012). Considering the effective solid angle of PIN and XIS, we then estimate the GRXE component flux for the PIN spectrum (12–22 keV) and XIS spectrum (2–10 keV) to be 2.00 × 10⁻¹³ and 7.01 × 10⁻¹³ erg cm−2 s−1, respectively. This estimated GRXE model is included in all the following model-fittings of the HXD-PIN spectrum. Note that the flux of GRXE in the XIS range is 2% of that from NW. Therefore, the effect of the GRXE on the XIS spectrum is negligible.
Best-fitting parameters for the XIS and PIN spectra.
| Parameters | (i) Single | (ii) Cutoff | (iii) Broken | (iv) 10-keV broken |
|---|---|---|---|---|
| power-law | power-law | power-law | power-law | |
| Photon index (all or soft) | 2.92 ± 0.01 | 2.90 ± 0.01 | 2.93 ± 0.01 | 2.93 ± 0.01 |
| Photon index (hard) | – | – | 2.66 ± 0.03 | |$2.56_{-0.34}^{+0.42}$| |
| Roll-off energy [keV] | – | >131 | – | – |
| Breaking energy [keV] | – | – | 7.90 ± 0.18 | 10.0 (fixed) |
| Flux10keV [× 10−5 Jy] | 5.05 ± 0.03 | 4.92 ± 0.03 | 5.30 ± 0.03 | 4.99 ± 0.03 |
| χ2/ d.o.f. | 736.51/664 | 735.69/663 | 733.59/662 | 733.85/663 |
*The absorbing column density is set to be 6.7 × 1021 cm−2, referring to Hiraga et al. (2009). Cross-normalization factor of HXD-PIN is fixed at 1.13, which is the value for a point source. Errors are for a single parameter of interest in 90% confidence.
Secondly, we check the possible contamination from nearby hard X-ray sources. According to the INTEGRAL catalog,2 there was no contaminating point-source in the 18.3–59.9 keV range in the FOV of the HXD-PIN. The brightest diffuse source in the PIN FOV is Vela PWN below 10 keV (Katsuda et al. 2011). Mori et al. (2014) studied the spectrum of Vela PWN with the XIS observation of VELA PWN E7 (ObsID 506050010), and reported that the surface brightness is ∼0.3 times the CXB level and that the photon index is ∼3.3. This flux corresponds to 5% of that of the NW in the 2–10 keV band, and hence our XIS spectrum is not significantly affected with the Vela PWN component within statistics. Extrapolating this spectrum to the energy band of the HXD-PIN, we find that the flux of Vela PWN is ≤2% of that of the NW in the 12–22 keV energy range, and therefore the contribution from the Vela PWN component is negligible for the PIN data. Therefore, we conclude that the detected signals are fully originated from Vela Jr. NW.
Finally we fit the background-subtracted HXD-PIN spectrum up to 22 keV with a single power-law model. Figure 5 shows the spectrum with the best-fitting model. The systematic error of the NXB model of 1%, which is derived based on the Earth occultation data, is included in errors of the source spectrum. The spectrum is well reproduced by a single power-law model with χ2/d.o.f. ∼ 0.22. The best-fitting photon index is |$3.15^{+1.18}_{-1.1{\bf 4}}$|, and the flux is (8.26 ± 1.44) × 10−12 erg cm−2 s−1 in 12–22 keV, as listed in table 2. Here the errors due to the model-fitting error of the GRXE are 0.006% for the photon index and 0.02% for normalization.
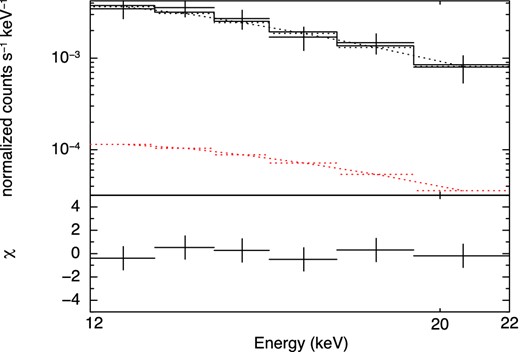
The black points in the upper panel show the HXD-PIN spectrum fitted with a single power-law model in 12.0–22.0 keV band. The error bars include the systematic error of the NXB model. The red dotted line shows the contribution from the modeled GRXE. The lower panel shows the χ residuals between the data and best-fitting model. (Color online)
3.3 Wide-band spectrum
In subsections 3.1 and 3.2, we have derived the spectral parameters independently with the XIS and PIN. We then fit the XIS and PIN spectra simultaneously to give further constraints, making use of the best available statistics.
First, we apply a single power-law model, referred to as model (i) in table 4, linking the photon index for the XIS and PIN spectra. M. Ishida (2007)3 reported that the normalization factors differed between the XIS and PIN spectra for the point-like source Crab, which has a power-law spectrum, and that their ratio of the PIN to the XIS (henceforth referred to as the cross-normalization) was 1.13. Thus, we link the power-law normalizations of the XIS and PIN spectra with the ratio of 1/1.13 in the model-fitting. Figure 6 shows the spectra and the best-fitting model, and table 4 lists the best-fitting parameters.
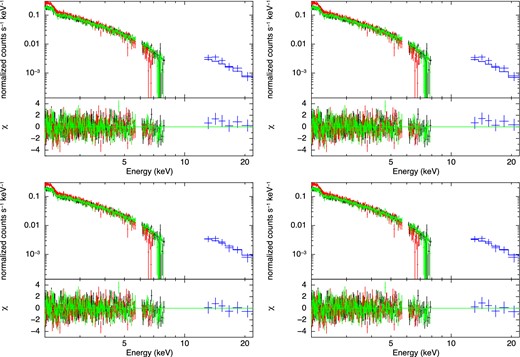
Top left: the upper panel shows the wide band spectrum fitted with (i) a single power-law model in 2.0–22.0 keV band. The systematic error of NXB model is included. The cross-normalization is fixed at 1.13, which is the value for a point source. The lower panel shows the residuals between the data and model. Top right: same as the upper left except using (ii) a cutoff power-law model. Bottom left: Same as the upper left except using (iii) a broken power-law. Bottom right: Same as the upper left except using (iv) a 10-keV broken power-law. (Color online)
The X-ray spectra of several SNRs have roll-off structures (e.g., Takahashi et al. 2008; Tanaka et al. 2008; Bamba et al. 2008; Zoglauer et al. 2015). Although the above result on a single power-law model does not require any spectral bending in the 2–22 keV band, we further try to examine a possible spectral curvature with various models listed in table 4, setting the cross-normalization to 1.13 (see the previous subsection). Table 4 shows the best-fitting parameters of each model. Four panels in figure 6 show the spectrum overlaid with the best-fitting model spectra for four different models. The parameters with the cutoff power-law (cutoffpl in xspec) which is a power-law model with high energy exponential roll-off (ii) are consistent with the results with the single power-law model (i), because the lower limit of roll-off energy of 131 keV is out of the range. Fitting with the broken power-law model (iii; bknpower in xspec) implies the breaking energy of 7.90 ± 0.18 keV with a change of spectral index of −0.3, although it is still consistent with the results of individual fittings with the XIS and PIN, and with the wide-band fittings with the models (i) and (ii), within errors.
4 Discussion and summary
In section 3, we have shown the results of spectral analysis of Vela Jr. with Suzaku. X-rays with the energy up to 22 keV are detected from the northwest region of Vela Jr. The spectra in the soft and hard X-ray band are reproduced with a power-law model with the photon indices of 2.93 ± 0.02 and |$3.15^{+1.18}_{-1.14}$|, respectively. When the spectra in both the bands are fitted simultaneously, a single power-law model with the photon index of 2.92 ± 0.01, or a slightly concave-shaped broken power-law model, is accepted.
The obtained wide-band, steep, power-law-like spectrum with photon index ∼3 implies the energy index p ∼ 5 of synchrotron electron with the energy distribution of dN/dE ∝ E−p. This steep spectrum strongly suggests that the roll-off energy is well below the XIS band. Combi, Romero, and Benaglia (1999) reported the radio spectral index of α = 0.3 ± 0.3 in the NW region, and Duncan and Green (2000) reported the flux density at 1 GHz of ∼50 Jy from the entire region of the SNR. In order to verify consistency between the X-ray and radio results, the X-ray spectra with XIS and PIN are tested with srcut model in xspec (Reynolds 1998). The srcut model describes the synchrotron spectrum from electrons with an exponential roll-off power-law distribution in energy. The synchrotron spectrum has a power-law form from the radio band to the X-ray band with a roll-off energy. The srcut model has three parameters; X-ray roll-off energy, spectral index at 1 GHz, and flux at 1 GHz. We fit the X-ray spectra using spectral index α in the radio band reported by Combi, Romero, and Benaglia (1999) and a typical value of young SNRs, i.e., α = 0.3 and α = 0.6, respectively. Then, when α = 0.3, the best-fitting parameters of 1 GHz flux density and roll-off energy are 0.15 ± 0.01 Jy and 0.15 ± 0.01 keV, with a χ2/d.o.f. of 1.18. When α = 0.6, these are |$31.6^{+1.8}_{-1.9}\:$|Jy and 0.27 ± 0.01 keV with a χ2/d.o.f. of 1.17. The area of the NW region in this paper is ∼27% of the entire area of Vela Jr., hence the 1-GHz flux is expected to become smaller than values reported by Duncan and Green (2000) which is derived from emission of the entire area of Vela Jr. Actually, the derived radio flux is smaller than the value of the entire area of Vela Jr. reported by Duncan and Green (2000). In addition, the roll-off energy is below the XIS band, which is consistent with our X-ray analysis. Therefore, the results of our X-ray analysis and those of the radio band are consistent with each other. Since the radio flux at the NW region alone has not been reported, additional radio observation is needed to verify this result on the wideband spectrum of the NW region.
Thus the steep X-ray spectrum naturally requires a concave roll-off structure as far as we assume a simple acceleration/synchrotron cooling mechanism. For example, Yamazaki et al. (2014) proposed a simple diagnostic to find possible acceleration mechanisms from the observed spectral shape near the maximum energy, assuming (a) one-zone, (b) electron energy spectrum of an exponential cutoff power-law, {N(E) ∝ E−pexp [−(E/Emax,e)a]}, expressed as equation (1) in Yamazaki et al. (2014), and (c) synchrotron radiation. Figure 5 in Yamazaki et al. (2014) shows the relation between the electron spectral parameters p and a on the relation of soft and hard X-ray spectral indices.
In order to discuss theoretical models, we tried a fitting with a broken power-law model (iv) with the breaking energy fixed to 10 keV. Table 4 shows the best-fitting parameters of this model, and the bottom right-hand panel of figure 6 is the spectrum overlaid with the best-fitting model spectra. Both the derived photon indices are consistent with that obtained with the model (iii), though that in the hard band is marginally smaller by 0.1 than the latter. The best-fitting flux is close to that obtained in the models (i) and (ii). Figure 7 overlays our results of the photon indices of below and above 10 keV in the model (iv) in red on figure 5 from Yamazaki et al. (2014). We find that our data do not fit any of the theoretical-model lines from Yamazaki et al. (2014). Thus we find Vela Jr. is the second outlier of the theoretical lines following Cassiopeia A, despite the spectrum in higher energy than roll-off. They are unlike the other SNR RX J1713.7−3946, whose spectral shape is well described with power-law + exponential cut-off model, and which exhibits the soft and hard photon indices on one of the theoretical lines.
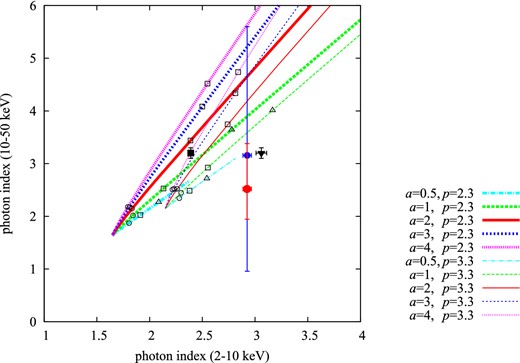
Relation between the two X-ray photon indices for soft and hard bands for a breaking power-law model. The straight lines show the theoretical lines derived by Yamazaki et al. (2014). The open squares, triangles and circles are for |$BE_{\rm max,\!e}^{2} = 10^{4}$|, 105, and 106 μG (TeV)2, respectively (see Yamazaki et al. 2014). The black squares and triangles show the result of RX J1713.7−3946 and of Cassiopeia A, respectively. The red and blue circles show this result with model (iv) with cross-normalization fixed to 1.13 or freed, respectively. These error bars show 99% confidence level.
A possible cause for the mismatch is that at least one of the assumptions (a), (b), and (c) is incorrect for this object. A normal one-zone synchrotron X-ray spectrum usually has a photon index of ∼2 in a softer energy band and rolls off toward the harder energy band due to cooling or escape. However, the wide-band X-ray spectrum of Vela Jr. is well reproduced with a single power-law or even a concave-shape broken power-law. It may suggest that a combination of more than one emission component and/or complex emission mechanisms creates the observed X-ray spectra (Longair 1994; Drury et al. 1999; Zirakashvili & Aharonian 2007; Malkov & Drury 2001; Toptygin & Fleishman 1987; Medvedev 2000; Reville & Kirk 2010; Teraki & Takahara 2011, Yamazaki et al. 2006; Laming 2001; Vink & Laming 2003; Vink 2008; Ohira et al. 2012).
In addition, in order to validate the cross-normalization between the XIS and the PIN, we fit the spectra, allowing both the XIS and PIN normalizations to vary independently, and find that the best-fitting photon index and the XIS flux are consistent with the above-discussed case within the error range, whereas the derived cross-normalization factor is 1.4 ± 0.3, which is marginally larger than that reported for the point source. This result may imply that brightness distribution in hard X-rays is more compact than that of the XIS image and that we have actually underestimated the PIN effective area, as we have assumed a larger diffuse-emission region than the real one. Considering the case of a more compact hard X-ray brightness distribution than that of soft X-rays, we also showed a conservative fitting result with freed cross-normalization factor in figure 7 with a blue mark and error bars. The best-fitting photon indices are 2.93 ± 0.04 and |$3.16_{-2.20}^{+2.44}$| in the soft and hard energy ranges, respectively. Although this estimation accepts most of the model lines presented in Yamazaki et al. (2014), it requires more than one emission region or complex emission mechanisms.
Lastly, we compare the flux with the TeV emission. In subsection 3.1, we derived the flux of (4.43 ± 0.03) × 10−11 erg cm−2 s−1 in 2–10 keV band while Aharonian et al. (2007) showed the TeV flux of entire Vela Jr. of (15.2 ± 0.7 ± 3.20) ± 10−12 cm−2 s−1 with H.E.S.S. (the High Energy Stereoscopic System). Both band spectra exhibit similar slopes and the X-ray to TeV gamma-ray flux ratio is ∼2.91. If we assume the cosmic microwave background inverse Compton scattering as the TeV emission mechanism, we estimate the magnetic field B ∼ 5.5 μG, which is consistent with the value derived by Kishishita, Hiraga, and Uchiyama (2013) and Lee et al. (2013). If the TeV emission is hadronic, the field strength is not constrained and it may be much higher (Bamba et al. 2005b).
The authors would like to thank all the members of the Suzaku team for their continuous contributions in the maintenance of onboard instruments, spacecraft operation, calibrations, software development, and user support both in Japan and the United States. We would like to thank associate professor Koji Mori for analysis of the XIS image. We would like to thank Prof. Yasushi Fukazawa and Dr. Takaaki Tanaka for useful comments about analysis of HXD-PIN. This work was supported in part by Grants-in-Aid for Scientific Research from the Ministry of Education, Culture, Sports, Science and Technology (MEXT) (No. 23340055, Y. T, No. 15K05088, R. Y, No. 15K05107, A. B., No. 15H03642-01, M. S. T., and No. 25800119, S. K.).
M. Ishida et al. 2007, Suzaku Memo 2007-11 〈http://www.astro.isas.ac.jp/suzaku/doc/suzakumemo/suzakumemo-2007-11.pdf〉.
References
