-
PDF
- Split View
-
Views
-
Cite
Cite
Tetsuya Magara, κH-Mechanism of a Solar Eruption Produced Self-Consistently by Flux Emergence, Publications of the Astronomical Society of Japan, Volume 65, Issue 3, 25 June 2013, L5, https://doi.org/10.1093/pasj/65.3.L5
Close - Share Icon Share
Abstract
We report on a new magnetohydrodynamic simulation for the sequence evolution of a magnetic field from emergence to eruption on the Sun. The magnetic field in the shape of a twisted flux tube emerging below the solar surface forms a pre-eruptive structure in the corona, which is composed of expanding envelop flux and a quasi-static inner core called flux rope; this inner core eventually seems to erupt. The evolution proceeds self-consistently; that is, any preexisting coronal magnetic field that causes additional side effects on the evolution of the emerging magnetic field is not assumed. This highlights a possible eruption mechanism inherent in the dynamic nature of the emerging magnetic field. The mechanism is characterized by two key quantities: the curvature (|$ \kappa$| ) and the scale height (|$ H$| ) of the emerging magnetic field.
1 Introduction
The Sun frequently produces global eruptions toward the interplanetary space, which is now believed to have a close relationship to the magnetic field originally coming from below the solar surface. There have been intensive efforts to understand the mechanism of these solar eruptions (Low 1996; Forbes et al. 2006; Chen 2011). Toward this end, numerical simulations have been used as a strong tool to study various dynamic processes leading to eruption. Mikic, Barnes, and Sehnack (1988) and following studies (Biskamp & Welter 1989; Chen 1989; Steinolfson 1991; Inhester et al. 1992; Mikic & Linker 1994; Choe & Lee 1996; Török et al. 2004) investigated how magnetic structures evolve into eruption in the simulation domains that extend from the solar surface to the corona, where shearing and/or twisting motions are applied at the solar surface boundary. There have been studies showing that the magnetic reconnection proceeding at the solar surface, called flux cancellation, produces solar eruptions (van Ballegooijen & Martens 1989; Forbes & Isenberg 1991; Amari et al. 2000; Linker et al. 2003; Roussev et al. 2003; Lin 2004). By changing a boundary condition at the solar surface through the kinematic emergence of a torus flux tube into the solar atmosphere, Fan and Gibson (2004) demonstrated that the kink instability causes the eruption of an emerged torus flux tube. Kliem and Török (2006) explained that those static magnetic fields whose field strength decreases with height over a critical decay rate are subject to the torus instability, leading to eruption. Furthermore, in several multi-polar flux systems the magnetic reconnection between different flux domains produces solar eruptions (Antiochos et al. 1999; Chen & Shibata 2000; Moore et al. 2001; Kusano et al. 2004).
These studies have given insights into various aspects of solar eruptions, although there are still missing issues. One of them is the pre-eruptive magnetic structure composed of the envelop flux overlying the inner core, called a flux rope, subject to eruption. Most of the studies mentioned above assumed pre-eruptive structures where not only the inner core, but also the envelop flux are static. Thus, to drive eruptions they either reduce the confining effect of the envelop flux on the inner core, or enhance the expanding effect of the inner core on the envelop flux; in some cases they apply both. In contrast, it is also possible to consider a situation where a pre-eruptive structure shows a quasi-static behavior in the inner core, while the envelop flux continuously expands into the interplanetary space. This raises an important question about how to form pre-eruptive structures in dynamic states. The so-called flux-emergence simulations reproduce the emergence of magnetic fields below the solar surface, through which pre-eruptive structures are self-consistently formed on the Sun [for a recent review of flux-emergence simulations, see Shibata & Magara (2011)]. Interestingly, it is found that in some pre-eruptive structures formed via flux emergence the envelop flux continuously expands (Magara & Longcope 2003), while the inner core remains in the corona (Manchester et al. 2004), unless an emerging magnetic field reconnects with some particular pre-existing coronal magnetic field, which efficiently reduces the confining effect of the envelop flux on the inner core (Archontis & Hood 2012).
Here, we report on a successful eruption produced solely by an emerging magnetic field. The evolution of the emerging field proceeds self-consistently; that is, no preexisting coronal field was assumed in our simulation. We used a larger simulation domain with finer grids distributed to the corona, and followed the longer-term evolution of the emerging field than in our previous work (Magara 2012). In the next section we explain the setup of the simulation, and present results. We then discuss a possible mechanism for the eruption in terms of the curvature and the scale height of the emerging field.
2 Simulation Setup and Results
The simulation was performed by solving ideal MHD equations in Cartesian coordinates, where the |$ x$| and |$ y$|-axes form a horizontal plane at the solar surface, while the |$ z$|-axis is directed upward. The basic setup of the simulation is almost the same as the ST case presented in Magara (2012). The initial state of the simulation is given by a magnetic flux tube floating in gravitationally stratified gas layers that extend from a subsurface region to the corona. The flux tube completely submerges under the surface, characterized by the so-called Gold-Hoyle profile with the twist parameter being one. The flux tube then, after being perturbed in the subsurface region during a short period of 0 |$ <$| |$ t$| |$ <$| 5 has started to emerge into the vicinity of the origin (|$ x$| , |$ y$| , |$ z$| ) |$ =$| (0, 0, 0) via the magnetic buoyancy (Parker 1955). Compared to our previous work (Magara 2012), we this time adopted a large simulation domain (|$-$| 200, |$-$| 200, |$-$| 10) |$ <$| (|$ x$| , |$ y$| , |$ z$| ) |$ <$| (200, 200, 190), and assigned fine grids to the coronal area of this domain. The grid size was (|$ {\Delta}x$| , |$ {\Delta}y$| , |$ {\Delta}z$| ) |$ =$| (0.1, 0.2, 0.1) for (|$-$| 8, |$-$| 12, |$-$| 10) |$ <$| (|$ x$| , |$ y$| , |$ z$| ) |$ <$| (8, 12, 40), while |$ {\Delta}x$| , |$ {\Delta}y$| , and |$ {\Delta}z$| increase toward 4 as |$ \vert x\vert$| , |$ \vert y\vert$| , and |$ z$| increase, which makes the total number of grids |$ N_x$| |$ \times$| |$ N_y$| |$ \times$| |$ N_z$| |$ =$| 371 |$ \times$| 303 |$ \times$| 597. Here, the units of temperature and length are given by the photospheric temperature, |$ T^{\rm ph}$| , and twice the photospheric pressure scale height, 2|$ \Lambda^{\rm ph}$| . The velocity is normalized by the photospheric sound speed, |$ c_{\rm s}^{\rm ph}$| . To enable continuous expansion of the emerging magnetic field, we reduced the gas pressure in the upper layer of the solar atmosphere (Tajima & Shibata 1997) by shifting the height where the temperature becomes 50|$ T^{\rm ph}$| from |$ z$| |$ =$| 7.5 for the previous work to |$ z$| |$ =$| 10 for the present work.

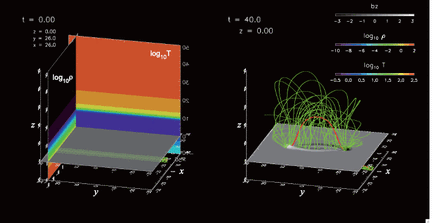
Snapshots of a simulation taken at |$ t$| |$ =$| 0 (left panel) and |$ t$| |$ =$| 40 (right panel). The red and green lines represent the axis of a magnetic flux tube, and twisted field lines surrounding the axis, while the gray-scale map at |$ z$| |$ =$| 0 in both panels gives the surface distribution of the vertical magnetic flux. Two color maps placed at |$ x$| |$ =$| 26 and |$ y$| |$ =$| 26 in the left panel show the initial distributions of the temperature and gas density. The units of density, temperature and magnetic field are given by the photospheric gas density, photospheric temperature and 570 G, respectively.
Figure 1 shows snapshots of the simulation taken at |$ t$| |$ =$| 0 and 40, where the red and green lines represent the axis of the magnetic flux tube and the twisted field lines surrounding the axis. The gray-scale map at |$ z$| |$ =$| 0 in both panels gives the surface distribution of the vertical magnetic flux. Two color maps placed at |$ x$| |$ =$| 26 and |$ y$| |$ =$| 26 in the left panel show the initial distributions of the temperature and the gas density. The flux tube emerges into the atmosphere, and develops a helical structure of magnetic field there, inside of which the axis forms an |$ \Omega$|-loop (right panel in the figure).

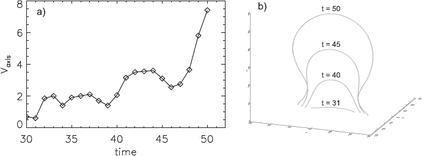
(a) Time variation of rising velocity of the axis measured at |$ z$|-axis. (b) Evolving axis observed at |$ t$| |$ =$| 31, 40, 45, and 50 is presented in the same Cartesian box.
Figure 2a shows the time variation of the rising velocity of the axis measured at the |$ z$|-axis, while figure 2b presents how the shape of this evolving axis temporally changes. In the early phase, 30 |$ <$| |$ t$| |$ <$| 45, the velocity gradually increases in an oscillating manner, and then the axis is dramatically accelerated upward at around |$ t$| |$ =$| 48. Before acceleration, the axis takes a shape suggesting that lateral expansion is limited (|$ t$| |$ =$| 31, 40, 45), while in the eruptive phase, |$ t$| |$ >$| 47, the axis can expand not only vertically, but also laterally.

(a) Two cases for the evolution of the axis of an emerging flux tube are schematically illustrated. In Case I the original axis (black dot) emerges into the corona, while in Case II a new axis (white dot) is formed in the corona, and the original axis stays near the surface. The gradations of gray-scale color in two schematic pictures of the emerging magnetic field represent the strength of the component of magnetic field directed into the paper (|$ B_y$|). The graphs of |$ f$|(|$ z_{\rm b}$| ) defined by equation (1) in these two cases are presented at the lower part of this figure. (b) Graph of |$ f$|(|$ z_{\rm b}$| ) obtained from the simulation is presented. The time is |$ t$| |$ =$| 40.
3 Discussion

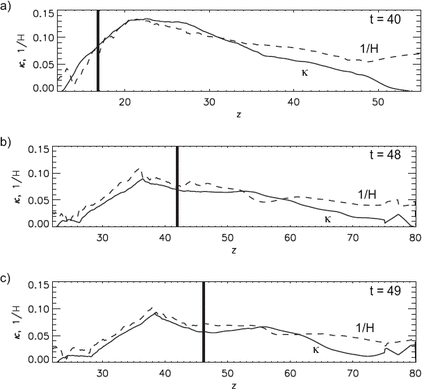
(a) Spatial distributions of |$ \kappa$| (solid line) and 1|$ /H$| (dashed line) along the |$ z$|-axis are presented. The time is |$ t$| |$ =$| 40. The vertical thick line indicates the location of the axis. (b) Same as (a), but for |$ t$| |$ =$| 48. (b) Same as (a), but for |$ t$| |$ =$| 49.
Figures 4a, 4b, 4c show the spatial distributions of |$ \kappa$| and 1|$ /H$| along the |$ z$|-axis obtained before (figure 4a, |$ t$| |$ =$| 40) and during the eruptive phase (figures 4b, 4c, |$ t$| |$ =$| 48, 49). The vertical thick line in each of these figures indicates the location of the axis. It is found that both |$ \kappa$| and 1|$ /H$| tend to increase with height in almost the same way when |$ z$| is small, which means that the magnetic pressure force is nearly balanced by the tension force. After reaching the maximum, |$ \kappa$| tends to decrease with height more rapidly than 1|$ /H$| , although they have undulating profiles in this second range. Regarding the shapes of the evolving axis, a limited lateral expansion shape is observed when the axis is within the first range, while lateral expansion becomes possible when the axis enters the second range.

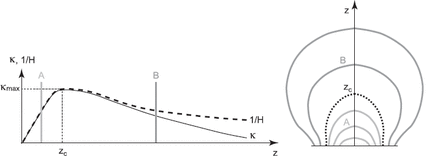
Eruption mechanism based on the profiles of |$ \kappa$| and 1|$ /H$| . |$ z$| |$ <$| |$ z_{\rm c}$| corresponds to the quasi-static range, while |$ z$| |$ >$| |$ z_{\rm c}$| corresponds to the expansion range. For details, see the text.
On the basis of these results, we speculate a possible mechanism of solar eruptions produced by flux emergence. This is schematically illustrated in figure 5. In the early phase of emergence, |$ \kappa$| at the apices of emerging field lines increases as they rise (marked as A in the figure). Magara (2004) showed that emerging field lines with temporally increasing |$ \kappa$| at the apex are reduced to a force-free state. After these apices go over |$ z$| |$ =$| |$ z_{\rm c}$| , where |$ \kappa$| takes the maximum (|$ \kappa_{\rm max}$| in the figure), the field lines can expand laterally as well as vertically (marked as B in the figure). This makes |$ \kappa$| at the apices of the emerging field lines decrease with their rise, while 1|$ /H$| tends to keep constant. What this rather conceptual illustration suggests is that emerging field lines evolve according to the profiles of |$ \kappa$| and 1|$ /H$| , and when the field lines enter the expansion range, |$ z$| |$ >$| |$ z_{\rm c}$| to have a phase of temporally decreasing |$ \kappa$| and steady 1|$ /H$| , large acceleration or eruption occurs during that phase. This can be seen in figures 4b and 4c; |$ \kappa$| changes from 0.07 (|$ t$| |$ =$| 48) to 0.06 (|$ t$| |$ =$| 49), while 1|$ /H$| keeps 0.07 at the location of the axis. Note that the acceleration may not last much longer, since |$ \kappa$| can occasionally be larger than 1|$ /H$| , even in the expansion range, as can also be seen in figures 4b and 4c.
The mechanism explained here is characterized by |$ \kappa$| and |$ H$| , which relates to the transfer of field lines from the quasi-static range, |$ z$| |$ <$| |$ z_{\rm c}$| , to the expansion range, |$ z$| |$ >$| |$ z_{\rm c}$| ; both ranges coexist in the same system. This is different from the standard picture of the loss-of-equilibrium (instability), where eruption arises in the system that maintains static equilibrium as a whole, and follows quasi-static evolution along a sequence of equilibria with temporally changing photospheric boundary conditions. We will make a detailed investigation of the simulation and report results in our forthcoming papers.
The author greatly appreciates productive comments of an anonymous referee. He wishes to thank the Kyung Hee University and Korea Meteorological Administration/National Meteorological Satellite Center. for general support of this work. This work was financially supported by Basic Science Research Program (2010-0009258, PI: T. Magara) through the National Research Foundation of Korea (NRF) funded by the Ministry of Education, Science and Technology, as well as the World Class University (WCU) program through the NRF (R31-10016).
References


