


Abstract
Obesity is associated with chronic pain, but the contribution of body mass index (BMI) trajectories over the life course to the onset of pain problems remains unclear. We retrospectively analyzed how BMI trajectories during the transition to adulthood were associated with a measure of pain interference obtained at age 29 in a longitudinal birth cohort study.
Data from the National Longitudinal Survey of Youth, 1997 Cohort (follow-up from 1997 to 2015), were used to determine BMI trajectories from age 14 to 29 via group trajectory modeling. At age 29, respondents described whether pain interfered with their work inside and outside the home over the past four weeks (not at all, a little, or a lot). Multivariable ordinal logistic regression was used to evaluate pain interference according to BMI trajectory and study covariates.
Among 7,875 respondents, 11% reported “a little” and 4% reported “a lot” of pain interference at age 29. Four BMI trajectory groups were identified, varying in starting BMI and rate of weight gain. The “obese” group (8% of respondents) had a starting BMI of 30 kg/m2 and gained an average of 0.7 kg/m2/y. On multivariable analysis, this group was the most likely to have greater pain interference, compared with “high normal weight” (odds ratio [OR] = 1.47, 95% confidence interval [CI] = 1.14–1.88), “low normal weight” (OR = 1.45, 95% CI = 1.13–1.87), and “overweight” trajectories (OR = 1.33, 95% CI = 1.02–1.73).
Obesity and rapid weight gain during the transition to adulthood were associated with higher risk of pain interference among young adults.
Introduction
Pain is increasingly recognized as a common health problem in adolescents and young adults [1–3]. In cross-sectional studies, obesity has been found to be a common comorbidity of chronic pain, and this association has been ascribed to multiple mechanisms by which obesity may influence the development of pain problems [4–7]. Most evidence on the co-occurrence of obesity and pain has focused on middle-aged and older adults [4,5]. For example, in a registry study, obese adults were more likely than their normal weight twins to be diagnosed with low back pain, headache, fibromyalgia, abdominal pain, and chronic widespread pain [8]. A few longitudinal studies have also been undertaken to examine how weight gain in adulthood was associated with development of pain problems or changes in pain intensity. In a study of adults with knee pain, 14% gained at least 5% of their baseline weight over a two-year follow-up, and this weight gain was associated with worsening pain on a visual analog scale [9]. Similarly, in a community-based sample of adults followed up for two years, each 1% increase in weight over the follow-up period was associated with an 11.6% increase in knee pain [10]. However, prior studies have generally been unable to correlate weight changes in adolescence and young adulthood with pain problems later in the life course.
In light of the increasing prevalence of pediatric obesity [11], it is important to understand how early-life trajectories of weight gain may contribute to pain problems emerging in late adolescence and young adulthood. Some existing data suggest that higher body mass index (BMI) at age seven is correlated with persistent back pain in adulthood [12] and that higher BMI at age 20 predicts knee pain in later life [13], although neither study had access to repeated BMI measures that could differentiate among trajectories of weight change. As the evidence in adults has suggested that both weight status and rate of weight gain are associated with pain problems, we hypothesized that trajectories involving more rapid weight gain during the transition to adulthood would be associated with increased risk of pain problems in young adulthood. Focusing on a measure of pain interference with school or work participation, we tested this hypothesis using available data from a longitudinal birth cohort study in the United States.
Methods
This study was deemed exempt from review as non–human subjects research by the institutional review boards at Nationwide Children’s Hospital and East Carolina University. We used publicly available, de-identified data from the National Longitudinal Survey of Youth, 1997 Cohort (NLSY97) [14]. This survey, sponsored by the Bureau of Labor Statistics of the US Department of Labor, enrolled a nationally representative sample of nearly 9,000 adolescents aged 12–16 years as of December 31, 1996 [15]. Participants were followed up annually from 1997 through 2011, and biennially through 2015. Interviews were conducted primarily in-person, although telephone interviews were conducted when in-person interviewing was not feasible. In the 2015 round, the total retention rate was 79% of the original sample, and 73% of completed interviews were conducted in-person [14]. The most common reasons for noninterview in this round were interview refusal (67% of respondents lost to follow-up), being unable to locate the respondent (18%), and death of the respondent (9%) [14]. Data from this survey have been previously used to characterize determinants of weight gain and obesity in adolescence and young adulthood [16,17]. We included all available data for each respondent until they reached age 29, when the outcome measure of pain interference was assessed (as part of a broader set of questions about health at age 29). We excluded respondents missing data on the outcome measure, and missing data on study covariates.
The outcome in this analysis was a one-item pain interference scale, adapted from a questionnaire designed for the Medical Outcomes Study [18]; it was administered after each respondent turned 29 years old. Respondents were asked the question, “During the past four weeks, how much did pain interfere with your normal work (including both work outside of the home and housework)?” Response options were originally coded as 1 = a lot, 2 = a little, or 3 = not at all. We reverse-coded this scale so that higher-numbered responses indicated greater pain interference. BMI data in the NLSY97 were based on self-reported height and weight in each interview [17]. For each year, we calculated BMI (kg/m2) using the current weight and the current or most recently reported height. BMI data were excluded if collected after age 29 or while the respondent was pregnant, and values <15 kg/m2 or >50 kg/m2 were excluded as biologically implausible. Following prior studies, BMI trajectories were analyzed using group-based developmental trajectory modeling [19,20]. The Bayesian Information Criterion was used to identify the trajectory shape that best fit the data and the optimal number of trajectories, under the constraint that each trajectory must represent at least 5% of respondents. Based on previous studies using this approach, we considered groupings of two to six trajectories and linear, quadratic, or cubic trajectory shapes [20–24]. Models used all available BMI data up to age 29 to predict respondents’ likelihood of being in each trajectory group. Respondents were assigned to their most likely trajectory group based on the best-fitting model, and the average posterior probability (APP) of group membership was used as a measure of internal validity, with values closer to 1 meaning that members of each group were similar to one another and not to members of other groups.
Pain interference outcomes and respondent characteristics were compared among BMI trajectory groups in descriptive analysis. Further analysis included multivariable ordinal logistic regression, where odds ratios (ORs) indicated the association between each covariate and the likelihood of experiencing greater pain interference at age 29. Apart from BMI trajectory, we controlled for birth year, gender, race/ethnicity, highest degree completed by age 29, marital status and number of biological children, and current health insurance coverage. We also controlled for early-life characteristics, which may have influenced the trajectory of BMI and health behaviors throughout adolescence and young adulthood [25]. These characteristics included mother’s educational attainment, whether the respondent lived with both biological parents at the time of the 1997 interview, and whether the respondent had early-life health problems, as reported by a parent at the 1997 interview (“any physical, emotional, or mental condition that has limited [the child’s] ability to attend school regularly, do regular school work, or work at a job for pay?”).
Because the pain interference outcome was not assessed until age 29, we considered whether its association with weight trajectory was robust to adjusting for other measures of functional limitation and health problems in young adulthood. First, we added a control variable for whether a respondent had experienced any health-related limitations on the type of work or amount of work they could do. This measure included data collected from 2007 until the interview before each respondent turned 29. Second, we controlled for a recent history of mental health problems as of age 29. This was measured using two questions asking whether, in the past 12 months, an “emotional, mental, or psychiatric problem” led the respondent to seek treatment by a mental health professional or miss at least one full day of usual activities. Third, we controlled for labor force participation in the year the pain interference outcome was assessed (employed, unemployed, or out of the labor force). Because the NLSY97 calculated labor force participation at the week level rather than at the year level, we used data from the earliest week with known labor force status in the year the outcome measure was collected. Following another recent analysis of NLSY97, we adjusted the standard errors in the regression model for the clustering of respondents (siblings) within households [26]. Stata/IC 14.2 was used for data analysis (StataCorp, LP, College Station, TX, USA), and a two-tailed P < 0.05 was considered statistically significant.
Results
The original survey enrolled 8,984 respondents in 1997, of whom 7,875 ultimately contributed data on the outcome variable in our study. We included all 7,875 respondents in BMI trajectory analysis and bivariate analysis, whereas our multivariable analysis included 6,989 respondents who had complete data on covariates. At age 29, 85.1% of respondents reported no pain interference with their activities, 10.9% reported some pain interference, and 4.0% reported a lot of pain interference. Our analysis of BMI trajectories found that four groups of cubic trajectories best fit the data, while preserving >5% of the sample in each group. Although all trajectories implied weight gain from age 14 to 29, the initial BMI and rate of weight gain varied (Figure 1). In the largest trajectory group (36.2% of respondents), the BMI at age 14 was estimated to be 21.4 kg/m2 and the average rate of weight gain up to age 29 was 0.4 kg/m2/y. In the second largest trajectory group (35.8% of respondents), the initial BMI was 19.1 kg/m2 and the rate of weight gain averaged 0.2 kg/m2/y. In the third largest trajectory group (20.0% of respondents), the initial BMI was 24.9 kg/m2 and the rate of weight gain averaged 0.6 kg/m2/y. In the fourth largest trajectory group (7.9% of respondents), the initial BMI was 30.3 kg/m2, and the average weight gain was 0.7 kg/m2/y. APPs in the four groups were 0.95, 0.96, 0.97, and 0.99, respectively, indicating very good internal validity of assigning respondents to these trajectories. In describing our further results, we refer to the four trajectories as “high normal weight,” “low normal weight,” “overweight,” and “obese,” respectively.
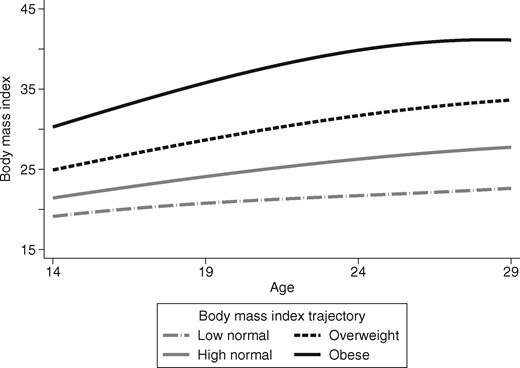
Body mass index trajectories fitted to the study sample.
The characteristics of the study sample are compared by BMI trajectory in Table 1. Among respondents on the high normal weight trajectory, 87.0% had no pain interference at age 29, 9.2% had some pain interference, and 3.8% had significant pain interference (Figure 2). Among respondents on the obese trajectory, the corresponding percentages were 78.1%, 16.8%, and 5.2%, respectively. On multivariable analysis (Table 2), after adjusting for demographic characteristics, socioeconomic status, and early-life characteristics, the trajectory of obesity and rapid weight gain was associated with 47% higher odds of greater pain interference, as compared with the high normal weight trajectory (OR = 1.47, 95% CI = 1.14–1.88, P = 0.003). Although Table 2 shows ORs with high normal weight trajectory as the reference group, pairwise comparisons among other weight trajectories could be calculated from the same model (e.g., the OR of obese relative to overweight equaled the OR of obese relative to high normal weight divided by the OR of overweight relative to high normal weight). Thus, we found that the odds of greater pain interference were also elevated in the obese trajectory as compared with the overweight group (OR = 1.467/1.105 = 1.33, 95% CI = 1.02–1.73, P = 0.037) and in the obese group compared with the low normal group (OR = 1.467/1.011 = 1.45, 95% CI = 1.13–1.87, P = 0.004). However, there was no statistically significant difference in the outcome between the overweight and high normal weight groups (OR = 1.11, 95% CI = 0.91–1.35, P = 0.321).
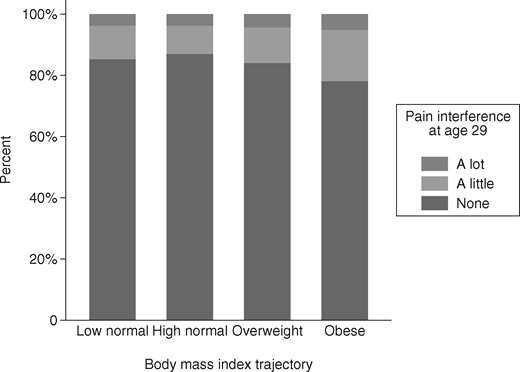
Pain interference at age 29 according to body mass index trajectory.
Characteristics of study participants, by body mass index trajectory (N = 7,875)
| Variable | No. (%) or Mean ± SD, by BMI Trajectory | |||
|---|---|---|---|---|
| Low Normal (N = 2,821) | High Normal (N = 2,853) | Overweight (N = 1,580) | Obese (N = 621) | |
| Study outcome:Pain interferes with work at age 29 (including housework and work outside the home) | ||||
| Not at all | 2,407 (85) | 2,483 (87) | 1,328 (84) | 485 (78) |
| A little | 307 (11) | 263 (9) | 184 (12) | 104 (17) |
| A lot | 107 (4) | 107 (4) | 68 (4) | 32 (5) |
| Demographic characteristics | ||||
| Female | 1,600 (57) | 1,194 (42) | 729 (46) | 369 (59) |
| Race/ethnicity | ||||
| Non-Hispanic white | 1,556 (55) | 1,346 (47) | 634 (40) | 217 (35) |
| Non-Hispanic black | 643 (23) | 768 (27) | 491 (31) | 243 (39) |
| Hispanic | 495 (18) | 653 (23) | 395 (25) | 147 (24) |
| Other | 127 (5) | 86 (3) | 60 (4) | 14 (2) |
| Birth year | 1982 ± 1 | 1982 ± 1 | 1982 ± 1 | 1982 ± 1 |
| Characteristics at age 29 | ||||
| Educational attainment | ||||
| Did not complete high school | 215 (8) | 286 (10) | 180 (11) | 69 (11) |
| High school or GED | 1,662 (59) | 1,866 (65) | 1,113 (70) | 464 (75) |
| Four-year college degree | 696 (25) | 561 (20) | 230 (15) | 76 (12) |
| Graduate/professional degree | 248 (9) | 140 (5) | 57 (4) | 12 (2) |
| No. of children | ||||
| 0 | 1,388 (49) | 1,132 (40) | 609 (39) | 283 (46) |
| 1 | 627 (22) | 686 (24) | 345 (22) | 143 (23) |
| 2 | 469 (17) | 585 (21) | 344 (22) | 111 (18) |
| 3+ | 337 (12) | 450 (16) | 282 (18) | 84 (14) |
| Marital status* | ||||
| Never married | 1,559 (55) | 1,536 (54) | 879 (56) | 396 (64) |
| Married | 1,020 (36) | 1,073 (38) | 572 (36) | 182 (29) |
| Separated/divorced/widowed | 234 (8) | 235 (8) | 126 (8) | 43 (7) |
| Lack of health insurance† | 822 (29) | 888 (31) | 549 (35) | 200 (32) |
| Early life characteristics | ||||
| Mother’s educational attainment‡ | ||||
| <12 y | 528 (20) | 629 (24) | 418 (29) | 171 (30) |
| 12 y (high school) | 890 (34) | 996 (38) | 531 (36) | 234 (41) |
| 1–3 y of college | 616 (24) | 595 (23) | 327 (22) | 117 (20) |
| 4+ y of college | 573 (22) | 408 (16) | 182 (12) | 51 (99) |
| Lived with both biological parents§ | 1,433 (51) | 1,375 (48) | 729 (46) | 240 (39) |
| Physical or mental health problem¶ | ||||
| Absent | 2,300 (82) | 2,345 (82) | 1,294 (82) | 510 (82) |
| Present | 172 (6) | 161 (6) | 109 (7) | 57 (9) |
| Parent unavailable to ask | 347 (12) | 345 (12) | 175 (11) | 54 (9) |
| Young adult health before age 29 | ||||
| Any health problem limiting type of work or amount of work that respondent could do | 357 (13) | 327 (11) | 262 (17) | 140 (23) |
| Mental health problem requiring professional care or leading to 1 or more missed days of usual activities in the past 12 mo‖| | 86 (3) | 85 (3) | 49 (3) | 20 (3) |
| Employment status at age 29^ | ||||
| Employed | 2,136 (76) | 2,152 (76) | 1,156 (73) | 435 (70) |
| Unemployed | 195 (7) | 228 (8) | 147 (9) | 51 (8) |
| Out of labor force | 484 (17) | 467 (16) | 277 (18) | 135 (22) |
BMI = body mass index; GED = graduate equivalency degree.
Data missing in 20 cases.
Data missing in 19 cases.
Data missing in 609 cases.
Data missing in 27 cases.
Data missing in six cases.
Data missing in 245 cases.
Data missing in 12 cases.
Multivariable ordinal logistic regression of pain interference at age 29, controlling for measures of young adult health before age 29 (N = 6,989)
| Variable | OR | 95% CI | P |
|---|---|---|---|
| BMI trajectory | |||
| Low normal | 1.01 | 0.85–1.20 | 0.902 |
| High normal | Ref. | ||
| Overweight | 1.11 | 0.91–1.35 | 0.321 |
| Obese | 1.47 | 1.14–1.88 | 0.003 |
| Demographic characteristics | |||
| Female | 1.28 | 1.10–1.48 | 0.001 |
| Race/ethnicity | |||
| Non-Hispanic white | Ref. | ||
| Non-Hispanic black | 0.60 | 0.49–0.73 | <0.001 |
| Hispanic | 0.78 | 0.64–0.96 | 0.018 |
| Other | 0.67 | 0.42–1.06 | 0.084 |
| Birth year | 0.95 | 0.90–0.998 | 0.041 |
| Characteristics at age 29 | |||
| Educational attainment | |||
| Did not complete high school | 1.18 | 0.92–1.52 | 0.202 |
| High school or GED | Ref. | ||
| Four-year college degree | 0.57 | 0.46–0.71 | <0.001 |
| Graduate/professional degree | 0.41 | 0.27–0.61 | <0.001 |
| No. of children | |||
| 0 | Ref. | ||
| 1 | 0.91 | 0.75–1.10 | 0.331 |
| 2 | 0.89 | 0.72–1.10 | 0.281 |
| 3+ | 0.97 | 0.76–1.24 | 0.815 |
| Marital status | |||
| Never married | Ref. | ||
| Married | 1.01 | 0.85–1.21 | 0.884 |
| Separated/divorced/widowed | 1.27 | 0.99–1.63 | 0.061 |
| Lack of health insurance | 0.75 | 0.63–0.88 | 0.001 |
| Early life characteristics | |||
| Mother’s educational attainment | |||
| <12 y | 0.81 | 0.66–0.99 | 0.042 |
| 12 y (high school) | Ref. | ||
| 1–3 y of college | 1.06 | 0.87–1.28 | 0.570 |
| 4+ y of college | 1.16 | 0.92–1.45 | 0.208 |
| Lived with both biological parents | 0.81 | 0.70–0.94 | 0.006 |
| Physical or mental health problem | |||
| Absent | Ref. | ||
| Present | 1.06 | 0.81–1.39 | 0.667 |
| Parent unavailable to ask | 0.98 | 0.77–1.24 | 0.840 |
| Young adult health before age 29 | |||
| Health problem limiting work | 3.43 | 2.87–4.10 | <0.001 |
| Mental health problem in past 12 mo | 2.26 | 1.64–3.13 | <0.001 |
| Employment status at age 29 | |||
| Employed | Ref. | ||
| Unemployed | 1.34 | 1.03–1.73 | 0.027 |
| Out of the labor force | 1.15 | 0.94–1.39 | 0.171 |
BMI = body mass index; CI = confidence interval; GED = graduate equivalency degree; OR = odds ratio.
Based on the final model in Table 2, several additional characteristics were associated with the pain interference outcome. Considering respondents’ demographic characteristics, women were more likely to report pain interference than men, and non-Hispanic white respondents were more likely to report pain interference than black or Hispanic respondents. Measures of socioeconomic status had conflicting associations with the outcome of pain interference; lower pain interference was seen among respondents who completed a college or graduate degree, but also among respondents who lacked health insurance coverage as of age 29. Considering early-life characteristics, respondents who grew up with both biological parents had lower pain interference, but pain interference at age 29 was not associated with mother’s educational attainment or parent-reported presence of physical or mental health problems during adolescence. As expected, unemployment, work-related health limitations, and a recent history of mental health problems were positively and strongly associated with experiencing pain interference at age 29.
Discussion
Cross-sectional associations between obesity and chronic pain have been reported in a variety of populations [4–6, 13], including several studies specifically identifying obesity as a risk factor for persistent pain during childhood [27–30]. Although a few studies have suggested that obesity in childhood or early adulthood can predispose people to pain in later life [12, 13], longitudinal evidence supporting this hypothesis has remained limited. As weight can change rapidly during the transition to adulthood, we sought to determine whether trajectories of weight gain at this developmental stage were associated with a measure of pain interference at age 29. Using data from a nationally representative longitudinal birth cohort study, we found that the highest level of pain interference at age 29 was found among respondents who gained weight rapidly during the transition from adolescence to adulthood, at a rate averaging 0.7 kg/m2/y. These data provide evidence that the pace of weight gain, and not only BMI at a single point in time, should be considered when evaluating the risk for persistent or recurrent pain among obese adolescents and young adults.
The relationship between obesity and pain is complex and entails multiple biological and psychosocial pathways [6, 31–34]. These pathways may include increased mechanical loading, chronic inflammation, dysregulation of gut microbiota, and development of physical or mental health comorbidities such as arthritis and depression, respectively [6, 7]. These physiological mechanisms may also be intertwined with the experience of weight stigma [35], which can contribute to mental health comorbidities known to increase the likelihood of developing chronic pain. Furthermore, health behaviors (e.g., sedentary lifestyle) and socioeconomic characteristics (e.g., unemployment) can simultaneously contribute to the risks of weight gain and pain persistence, complicating the task of distinguishing how BMI affects pain independently of other risk factors. Although existing data are primarily limited to cross-sectional evidence that pain and obesity tend to co-occur, recent longitudinal studies connecting weight gain with new or more severe pain [9, 10] point to a need for understanding how trajectories of weight gain (or maintenance of excess weight) over the life course culminate in an elevated risk or pain problems.
In our analysis, we found that the association between rapid weight gain and subsequent risk of pain interference with usual activities was not explained by controlling for other health problems that limit respondents’ ability to work or controlling for respondents’ recent history of mental health problems. We undertook a conservative approach to model construction, including several covariates measured at or just before age 29 that were potentially overlapping with the outcome of pain interference. For example, the “work limitation” covariate may have potentially captured those respondents whose pain resulted in actual restrictions on the kind of work they could do. Specifically, 52% of respondents who reported “a lot” of pain interference at age 29 also reported a physical or mental health limitation on their ability to work or the kind of work they could do, compared with 25% of respondents reporting “a little” pain interference and 11% of respondents reporting no pain interference (P < 0.001). Despite the conceptual and empirical overlap of this measure with pain interference, weight trajectory remained associated with pain interference even after controlling for work limitations, employment status, and a wide range of other known or suspected risk factors for pain problems. This finding strengthens our conclusion that a trajectory of increasing obesity is associated specifically with pain problems, not only with health problems and work limitation in general.
Our finding that rapid weight gain during the transition to adulthood was associated with greater likelihood of pain interference in young adulthood adds to an emerging literature of longitudinal or cohort studies where pain outcomes were generally assessed much later in the life course [9, 10, 12]. However, the finding in our study was primarily driven by a contrast in the proportion of young adults reporting “a little” pain interference, suggesting that weight gain may predominantly affect the likelihood but not the severity of pain interference, as measured by the NLSY97. Indeed, most pain interference reported in this population-based, noninstitutionalized sample was not severe, and in the absence of longitudinal data on pain interference, we could not analyze the factors predicting increased severity of this outcome. Further research incorporating longitudinal measures of both BMI and pain problems could elucidate the most relevant mechanisms explaining the association between excess weight gain and the onset of pain interference, as well as the mechanisms responsible for increasing the severity of pain interference at this stage of the life course.
Apart from the limited data available on pain severity, our results were centered on the comparison of pain interference between the obese group and all other groups, including an overweight group also experiencing a higher rate of weight gain than respondents in the two normal weight groups. Although the average weight gain in the overweight group was similar to that of the obese group over the entire follow-up period (0.6 vs 0.7 kg/m2/y), we found that before age 24, the difference in weight gain between the two groups was more pronounced (Figure 1), whereas at ages 24–29, the rate of weight gain in the obese group began to level off. Thus, the results for the obese group may be especially driven by rapid weight gain before age 24, and less so by the weight trajectory at ages 24–29. The lack of difference in pain interference between overweight and normal weight young adults may also be attributed to the much lower starting BMI in the overweight group compared with the obese group. It is possible that only the combination of obesity and rapid weight gain definitively increases young adults’ risk for pain interference, as compared with other combinations of weight status and weight change. However, it is also possible that a weaker association between overweight and pain interference (compared with the normal weight groups) was obscured by controlling for covariates that overlapped with the outcome of pain interference, as mentioned above.
Among adolescents, Deere et al. have reported that obesity increased not only the likelihood of musculoskeletal pain, but also the severity of pain symptoms [13]. The independent effect of obesity was substantiated in an adjusted analysis of a community-based twin registry (mean age = 31 years), where overweight and obesity increased the risk of abdominal pain, back pain, headache, fibromyalgia, and chronic widespread pain [8]. These previous findings have prompted the recommendation that treatment of obesity be integrated with the treatment of chronic pain [6]. Although gradual weight loss may improve pain symptoms for older patients with obesity [36], the normative trajectory of slow weight gain in our cohort (e.g., averaging 0.4 kg/m2/y among respondents in the largest trajectory group) suggests that weight maintenance—rather than weight loss—could be an appropriate goal for obese adolescents and young adults presenting for treatment of chronic pain. Wilson et al. have previously described possible interventions for weight management among adolescents treated at a multidisciplinary pain clinic, including counseling about nutrition and encouraging greater physical activity [37]. Some interventions, such as increasing physical activity, might improve short-term outcomes among adolescents with chronic pain [38], as well as potentially reducing the risk of future recurrent or persistent pain through controlling the rate of weight gain.
Although our analysis adds new evidence on the association between weight gain trajectories and pain in young adulthood, our conclusions are subject to several additional limitations of the data and analytic approach. First, due to the limitations of NLSY97 data collection, we analyzed a single measure of pain that asked about interference with activities over a four-week period. This measure of pain interference may not be comparable to measures explicitly designed to capture chronic pain persisting for or recurring over at least three months. As with many prior cohort studies on BMI trajectories, our results may have been limited by using self-reported height and weight data. Particularly, under-reporting of weight may have led us to underestimate the rate of weight gain in the obese group or the number of respondents who should have been assigned to this group. Yet, although it is known that BMI based on self-reported weight tends to be underestimated, the magnitude of underreporting is relatively small [39, 40], and it is unlikely that reporting bias would change over time, meaning that estimates of weight change are presumably robust to this source of bias.
Our analysis was also limited by lack of data on other measures of adiposity, such as waist circumference, which have been independently associated with chronic pain [41]. Conversely, our use of group-based trajectory modeling allowed us to flexibly determine the best categorization of BMI trajectories, taking advantage of multiple data points obtained during adolescence and the transition to adulthood. Nevertheless, the reasons for rapid weight gain during adolescence are multifactorial, and in an observational study, confounding of the association between rapid weight gain and pain interference cannot be entirely ruled out. Lastly, our study used listwise case deletion to handle missing data due to incomplete responses at the 1997 baseline round (e.g., data on maternal education) and at age 29 (e.g., data on mental health conditions), potentially biasing the results of the multivariable analysis. However, the extent of this bias was likely limited, as results from the 6,989 respondents included in the multivariable analysis qualitatively agreed with the results seen in bivariate comparison of pain interference by weight trajectory in the full analytic sample of 7,875 respondents.
In sum, our study adds novel evidence about the role of weight gain trajectories in the association between obesity and pain. We demonstrate that adolescents who experience the fastest gain in BMI during the transition to adulthood eventually have the highest risk of pain interference with activities, as reported at age 29. These data support the importance of addressing both current obesity and the rate of weight gain in adolescents and young adults presenting for treatment of chronic pain. With emerging evidence suggesting that weight status and weight gain in adolescence can have long-term consequences for persistent or recurring pain, future research may also examine long-term reduction in the risk of chronic pain as an outcome of interventions designed to address excess weight in pediatric populations. Additionally, the limitations of the pain interference measure used in our study suggest that future population-based studies should incorporate clinically relevant definitions of chronic pain to provide accurate data on pain problems’ impact on population health and economic productivity.
Conflicts of interest: None declared for all authors.
Acknowledgments
This research did not receive any specific grant from funding agencies in the public, commercial, or not-for-profit sectors.
References
Bureau of Labor Statistics. National Survey of Youth.
