


With an election having taken place only two years beforehand, there may have been an expectation that little would change in terms of party finance. Yet the period between the 2015 and the 2017 elections demonstrated a surprising amount of change. There were new laws and policies related to party finance and much uncertainty about the legitimacy of some election spending. Moreover, as other chapters also show, the two main opposition parties were fundamentally changed—not only in terms of leading personnel—but also in respect of financial prowess, largely due to an influx of new members and supporters. But despite change, there was also continuity. The national campaign continued to be subsumed into playing a supporting role for the battles in the constituencies, and the growth of digital campaigning continued, though it was still far from the dominant mode of campaigning, especially in terms of expenditure. And, by polling day, ‘normal service’ was resumed in terms of party income and expenditure, with the Conservatives able to raise significant sums once the election was called. But all of this should also be contextualised by the sudden calling of the election. As this chapter shows, its unexpected nature impacted significantly on parties’ spending decisions and their ability to use their money effectively.
1. Developments in party finance rules
While both the 2005 and 2010 Parliaments saw extensive reviews of party finance regulations (Fisher, 2010, 2015), there was no such review during this short Parliament. There were still important developments, however, which had wider implications for funding more generally. Two of these were a result of government policy. The third may result in criminal prosecution. The first was initiated soon after the 2015 election. In July 2015, a Trade Union Bill was presented, which included a clause requiring trade unions with a political fund to operate a ‘contracting-in’ system rather than a ‘contracting-out’ one. This went to the heart of the Labour Party’s relationship with the trade unions, which—following the Trade Union Act 1913—established that for trade unions to engage in political activity, they must create a separate political fund. This covered all political activity—not just that with the Labour Party—and trade union members were actively required to ‘contract-out’ if they wanted to avoid paying the modest additional fee. The 1913 Act laid the ground rules for an important aspect of Labour funding for much of the next 100 years. Political activity through the Labour Party would be expressed collectively through a union’s decision to affiliate to the party.
This had faced challenges in the past. The Trade Disputes and Trade Unions Act 1927 determined that trade union members must ‘contract-in’—that is, make the decision to pay into the fund rather than opt out. Around a quarter fewer trade unionists opted in to the political levy, though the impact on Labour’s finances was mitigated in part by unions raising the affiliation fee for those who continued to pay into the political fund. ‘Contracting-out’ was restored soon after the Second World War and had remained in place until now. Ed Miliband’s changes to Labour Party rules, introduced in the wake of the Falkirk candidate selection controversy (Fisher, 2015) were slightly different. Miliband’s reforms initially floated the idea of ‘contracting-in’ to the political find by union members, together with a positive decision by those paying the levy for a proportion to be paid to the Labour Party (Fisher, 2015). ‘Contracting-in’ to the levy was ultimately dropped by Labour but the radical step of levy payers opting to contribute to Labour remained.
While this aspect the bill originally passed through the Commons relatively unscathed, it experienced trouble in the House of Lords on its second reading in January 2016. As a result, the Lords established the Select Committee on Trade Union Political Funds and Political Party Funding to examine the relevant clauses. Its report concluded that the re-introduction of ‘contracting-in’ could have a ‘sizeable negative effect’ on the number of union members participating in political funds and therefore on the income of the Labour Party. The Lords subsequently voted in favour of a motion to restrict changes to ‘contracting-in’ to new union members. This change (restricting ‘contracting-in’ to new members) was accepted by the Government and the Act received Royal Assent in May 2016.
The second reform related to Short Money. Introduced in 1975 and named after the then leader of the House, Edward Short, this is a form of ring-fenced public funding of opposition parties to assist their work in parliament. In the 2015 Autumn Statement, the Chancellor initially proposed reducing Short Money allocations by 19% and freezing them for the remainder of the parliament, the reasoning being that parties must face cuts just as government services have done. However, following discussions with affected parties, a much lower reduction of around 5% in real terms was agreed. These cuts affected the finances of all opposition parties in the Commons as they also applied to the Representative Money Scheme, which applies to parties who do not take up their seats in the House of Commons. No mention, however, was made of Cranborne money—analogous to Short Money, but used to support the work of opposition parties in the House of Lords rather than the Commons.
What unites both these measures are two things. First, the impact on parties is asymmetric. While the measures on ‘contracting-in’ were not directly related to party funds—they are principally about participation in trade union political funds—it is only Labour’s finances that will be affected, though that effect will not be immediate. Similarly, changes to Short Money only affect opposition parties. Secondly, both arguably represented solutions to problems that were not high on the political agenda. Unlike some aspects of the Trade Union Act, such as requirements in respect of taking strike action, the issue of ‘contracting-out’ had not shown itself to be a particular problem. A considerable number of trade union members already exercised the right to contract-out of the political fund, so the case for changing the procedure in isolation and outside a broader examination of party funding was not especially strong. Equally, while recognising that public spending cuts need to be applied across a variety of areas, there had been no clamour to cut the relatively modest sums distributed through Short Money.
Ultimately, however, the impact of these reforms may be longer-term and affect more parties. In the case of Labour, changes to ‘contracting-in’ may impact significantly upon the party’s income base in the longer term—especially if its reliance on trade union income continues. But for party finance reform more generally, the asymmetric effects of these changes are such that a future Labour or Labour-led government may exact some form of ‘revenge’, either through excessively partisan measures or through a root and branch reform of party finance regardless of any opposition from the Conservative Party. This will leave the vexed question of party finance reform open for a lot longer and with reduced prospects for consensus as a result.
The third issue related to the appropriate allocation of campaign expenditure to candidates or parties. There has been growing issue in British politics in respect of the blurring between what counts as national party level and what counts as candidate expenditure at the constituency level (Fisher, 2015, p. 153). Ostensibly, the distinction is clear—that which promotes a party is counted as national (party) expenditure, while that which promotes the candidate is counted as constituency-level. However, the distinction in reality is not so neat. Nor is the blurring a new concern. In the general elections of 1950 and 1951, there was controversy over a poster campaign opposing Labour’s policies (1950) and an advert in The Times doing likewise (1951). In both cases, it was argued that these were political propaganda and contravened the legislation that no expenditure should be incurred to procure the election of a candidate unless authorised by the candidate’s electoral agent (who is responsible for approving all campaign expenditure in support of the candidate). The 1951 case came to court in 1952 and The Times was acquitted on the grounds the advertisement was general propaganda and did not assist a particular candidate (Butler, 1952, p.33). The implication of this ruling was that posters and newspaper advertisements (and indeed any other form of advertisements) where a candidate was not named, did not contravene the rules on candidate spending. As far back as 1952, Butler (1952, pp. 33-34) argued that the ruling had far reaching implications. He was right.
Certainly, what has become clear over the last twenty-five years is that developments in technology and campaign techniques have become such that the boundaries between national and constituency-level spending have become even less distinct. We can observe this in at least five ways. First, all parties have developed facilities for telephone voter identification (Fisher et al., 2007; Fisher et al., 2011). The calls generally focus in parties’ key seats, but critically, the purpose is not to promote a particular candidate. Rather, it seeks to assess the level of commitment in respect of the vote intention and enquire as to the voter’s principal policy concerns. This feeds into the second key development: nationally sent direct mail. Voters’ policy concerns as expressed through telephone voter identification and other means of voter contact are followed up by bespoke direct mail. Importantly, the direct mail is tailored both to voters’ concerns and their demographic profile (Fisher et al. 2007; Fisher et al., 2011). This tends to be focussed on voters in target seats, but again candidates’ names are not mentioned, thus deeming this activity as national (party) expenditure. The third area is the use of targeted advertisements in social media, undertaken by national parties—in effect, a digital evolution of the approached adopted by direct mail. And as with direct mail, it does not promote a particular candidate, but will typically be targeted on key voters in target seats.
In addition to these technology-driven developments, two further approaches, rooted in more traditional modes of campaigning, illustrate this trend. National party figures tend to focus their election tours on particular seats. Of course, tours by key party figures have long been a highly visible component of campaigning, going as far back as the nineteenth century (Hanham, 1978, pp. 202-204). But from the 1970s, there has been a far greater emphasis on focusing leadership tours on marginal seats (Butler and Kavanagh, 1974, p. 224; Fisher and Denver, 2008, p. 816), with expenditure being ascribed principally to the national party, rather than the candidate.
The fifth development ironically relates to the most traditional campaign approach: face-to-face campaigning. Party volunteers often descend on target seats to assist with campaigns. Again, this practice is not entirely new. Activists have often campaigned in nearby constituencies if that seat was more marginal and their own was safe. However, some parties have struggled more than others to get large numbers to campaign outside their own constituency. As a consequence, parties have assisted with transport. The effects of this have been comparable with the other blurred distinctions. Such expenditure (typically travel) has counted as national (party) expenditure rather than constituency (candidate) expenditure.
These developments have been important for three reasons. First, the national campaign has been effectively subsumed into supporting constituency-level activities (Fisher, 2010, 2015). Second, and as a consequence, the distinctions between expenditure on national and constituency-level campaigns have become increasingly blurred, and the ability to ascribe expenditure meaningfully as being national or constituency-level has become increasingly challenging. Third, the increasing blurring has led some to claim that the candidate spending limits in districts are now effectively meaningless, since so much national spending is devoted to supporting campaigns in particular constituencies. Developments during this Parliament, however, meant that what was principally a discussion about campaign developments became a potentially criminal affair.
Beginning in January 2016, Channel 4 News broadcast a series of reports suggesting (amongst other things) that expenditure ascribed to the national Conservative Party campaign in the 2015 General Election should have been ascribed to those campaigns of particular Conservative candidates. The key areas of importance were hotel expenses paid in respect of activists in one seat, and the use of the election ‘Battle Bus’ to transport activists to key seats. The Electoral Commission began investigating the matter in February 2016 and published its conclusion in March 2016, which resulted in the Conservative Party being fined £70,000 in respect of these matters and apparent breaches in respect of by-elections in 2014 (Electoral Commission, 2017, p. 4). This alone was damaging (and it should be noted that Labour and the Liberal Democrats were also fined by the Commission in respect of inaccuracies in their election expenses). However, more potentially damaging was that the Commission drew the attention of the Crown Prosecution Service (CPS) to the Conservatives’ misreporting. The matter was investigated by 15 separate police forces and potentially affected up to 20 Conservative MPs. If the CPS had decided to proceed, those MPs could have faced criminal charges and would have been disqualified if found guilty. Obviously, disqualifications on this scale would have denied the Conservatives its majority. But potentially more seriously, there would have been significant political damage from such a large number appearing before the courts.
When Theresa May called the election, she was still unaware of whether the CPS would proceed with charges. After dissolution, the MPs in question could no longer be disqualified, but the potential for serious political damage remained. On 10 May, however, it was announced that no charges would be brought against all but one candidate under investigation, the CPS concluding that there was insufficient evidence in respect of the ‘Battle Bus’ expenses to prove to a criminal standard that any candidate or agent had acted in a dishonest matter (Crown Prosecution Service, 2017a). However, a decision on a case being investigated by the Kent police would only be made later and published on 2 June: the case of the Thanet South Constituency (Crown Prosecution Service, 2017b). The CPS concluded there was sufficient evidence to authorise charges against three people: the candidate, his election agent, and a Conservative Party official. One might have expected this to be hugely damaging electorally for the candidate and the Conservative Party. It may well have been for the party in an abstract sense, but just six days later, the candidate was re-elected with a 12.6 percentage point increase in his vote share (and over 6000 additional votes), achieving more than 50% of the vote. Ultimately, the impact of these investigations, however, may be less visible than any public rejection of a party or candidate. Rather, all parties will seek to make sure that they are not vulnerable to accusations of mis-apportioning funds through effective self-policing.
2. Trends in party income and expenditure
The normal pattern of party income is that it cycles with general elections—rising sharply in the year before an election and falling away again in the year after. With an election so soon after the last one, one might have expected little change in this regard. In fact, the reverse was true for Labour and the Liberal Democrats. The Labour leadership election of 2015 produced many new members, topped up by those who wished to participate in the election, adding up to significant financial contributions. And the repeat election in 2016, as a result of the challenge to Jeremy Corbyn’s leadership, boosted income further in what would normally be a year where income fell. As Labour noted in its accounts for 2016, this enabled the party to establish a general election trust fund, something that in previous post-election periods, would have been ‘unthinkable’. The Liberal Democrats also enjoyed a growth in income—up over £1 million mainly through growth in party membership and donations.
By way of contrast, Conservative income in 2016 fell as would be expected. This meant that at the turn of the election year, Labour enjoyed the kind of financial advantage over the Conservatives not seen since the Blair years. This is illustrated both in Figure 11.1 (Central Party Income) and in Figure 11.2, which shows Labour central income as a percentage of Conservative central income.1
As with all figures in the chapter, the source of the data is the Electoral Commission’s Party and Election Finance Database and the parties’ own accounts.
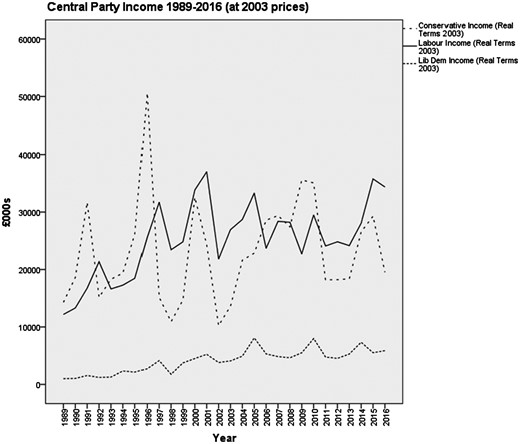
Central Party Income 1989-2016 (at 2003 prices)
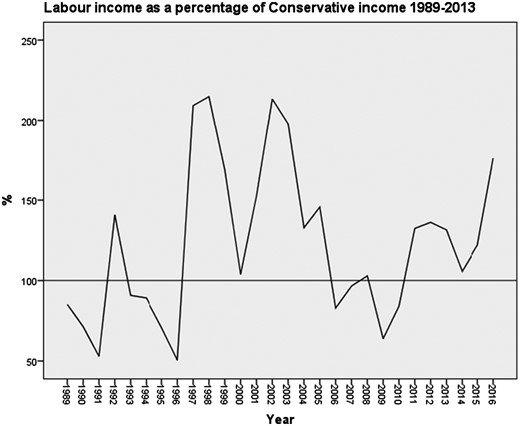
Labour income as a percentage of Conservative income 1989-2016
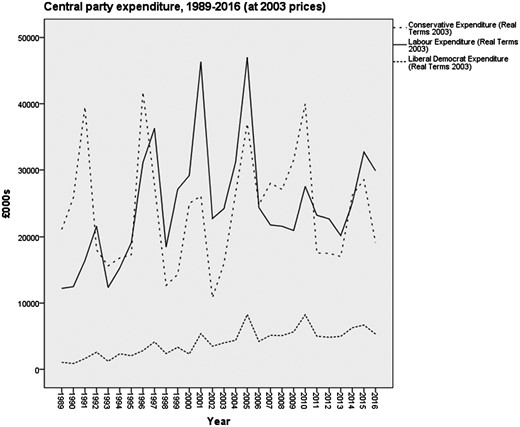
Central Party Expenditure 1989-2016 (at 2003 prices)
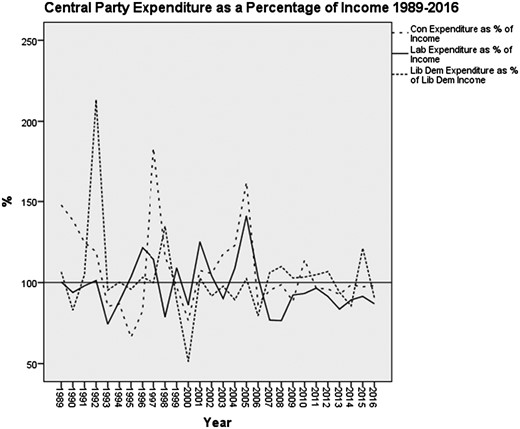
Central Party Expenditure as a Percentage of Income 1989-2016
3. Donations 2015-2017
Figures 11.5 and 11.6 show the number and value of declared donations (over £7500 in value) received in each quarter. Given the short time between the elections, the period between 2010 and 2015 is also included for comparison, with the x-axis reference line in both set at 2015 Quarter 3—the first quarter of the 2015-2017 cycle. The figures show that declared donations in advance of the 2017 election mirrored patterns prior to 2015—the Conservatives had a significant advantage in both the number and the value of declared cash donations. Over the period from 2015 Quarter 3 to 2017 Quarter 2, the Conservatives received £48,867,408 in declared cash donations, compared with Labour’s £24,981,055. Yet, the Conservative advantage was heavily skewed to declared donations in the last six months before the election. In the first two quarters of 2017, the Conservatives received 492 donations totalling over £27 million; Labour received 183 totalling just under £10 million, while the Liberal Democrats received 99 totalling just under £3 million.
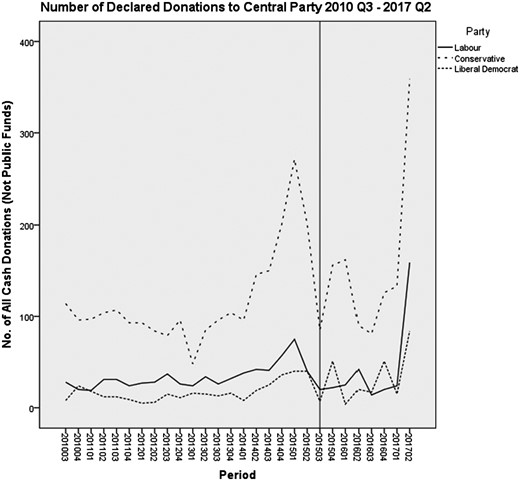
Number of Declared Donations to Central Party 2010 Q3-2017 Q2
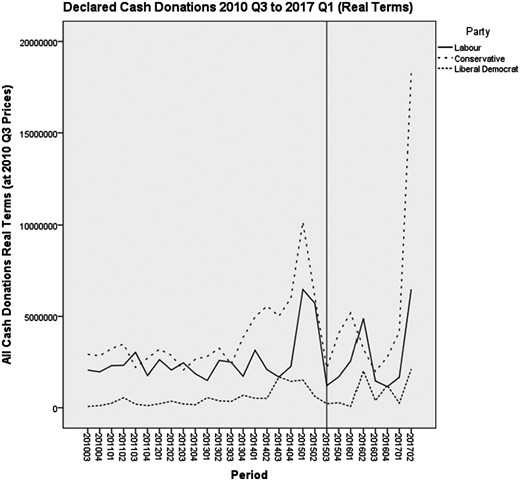
Declared Cash Donations 2010 Q3-2017 Q1 (Real Terms)
Of course, declared donations do not tell the whole story. As we have seen, Labour was very successful in 2015 and 2016 in generating a large number of small donations as a result of the leadership contests that took place. In 2015, for example, the party generated £3 million in low-value donations in addition to a surge in membership, meaning that the party was finally able to clear its unsecured loans. Nevertheless, the ‘normal situation’, whereby the Conservatives were able to attract more income, was confirmed in the six months prior to the election.
The Conservative income advantage was further illustrated by donations in the six weeks before polling day (see Tables 11.1 and 11.2). The Political Parties, Elections and Referendums Act 2000 requires donation declarations to be made weekly during the period between dissolution and polling day. Although delivering more in the way of transparency than the regular quarterly donations, they have previously told us comparatively little about the impact of party finance on the election as the money would have arrived too late to have a substantial effect. Traditionally, most income has been generated in the year before an election, in part because many campaigning activities such as direct mail require a long lead time for the activities to yield payoffs. However, the growth of digital campaigning, which often has a shorter lead time than other campaign methods, means that these data are increasingly helpful in understanding parties’ finances at elections.
Source of Election Period Declared Cash Donations and Levels of Declared Non-Cash Donations
| Conservative | Labour | Lib Dems | ||||
|---|---|---|---|---|---|---|
| (£) | No. | (£) | No. | (£) | No. | |
| Individual | 9,672,049 | 170 | 189,699 | 8 | 776,950 | 27 |
| Company | 2,885,000 | 48 | – | – | 299,750 | 6 |
| Trade Union | – | – | 4,302,917 | 32 | – | – |
| Unincorporated Associations | 61,000 | 2 | – | – | – | – |
| Public Funds | 21,247 | 1 | – | – | 108,024 | 1 |
| Total Cash Donations | 12,639,296 | 221 | 4,492,616 | 40 | 1,184,724 | 34 |
| Total Non-Cash Donations | 85,742 | 2 | 54,800 | 3 | 30,870 | 2 |
| Total All Donations | 12,725,038 | 223 | 4,547,416 | 43 | 1,215,594 | 36 |
Source: The Electoral Commission Party and Election Finance Database.
During this period, the Conservatives received over £12.5 million from 221 declared cash donations, compared with Labour’s £4.5 million from 40. This represented more than double the level of Conservative donations that the party received in the same period prior to the 2015 election (Fisher, 2015). By way of contrast, Labour generated only 69% of the declared cash donations it received in the 2015 campaign period and in real terms, the proportion is even lower at 66%. The Liberal Democrats generated twice the level of declared donations in 2017 in the last six weeks before the election compared with the same period in 2015. The most lucrative period for the two largest parties was in the first week, where the Conservatives generated £4.3 million, and Labour £2.7 million. But, as Table 11.2 shows, money flowed into Conservative coffers in fairly sizeable amounts throughout the campaign.
Timing of Weekly Declared Cash and Non-Cash Donations
| £s | Week 1 | Week 2 | Week 3 | Week 4 | Week 5 | Week 6 | Total |
|---|---|---|---|---|---|---|---|
| Conservative | 4,343,000 | 1,639,108 | 3,785,050 | 1,115,833 | 1,605,800 | 236,247 | 12,725,038 |
| Labour | 2,683,300 | 382,925 | 359,499 | 1,046,692 | 75,000 | 0 | 4,547,416 |
| Lib Dems | 180,000 | 160,750 | 310,500 | 210,394 | 353,950 | 0 | 1,215,594 |
Source: The Electoral Commission Party and Election Finance Database.
Of course, the snap election will have prompted some of this late fundraising, but a further reason for the large sums raised may also be political. One of the explanations for the shift in Conservative funding from individual donors to institutional ones in the 1920s was a fear amongst some companies of the Labour Party (Fisher, 2000, p. 20). That motivation had declined over the last 30 years as fewer companies saw the prospect of a Labour government as a threat (Fisher, 1994). Certainly, corporate donations to the Conservatives in the 2001 and 2005 campaigns were modest (Fisher, 2001, 2005). They were larger in 2010 and 2015, but the sum raised from companies in 2017 was 37% higher in real terms than the prior high level of company giving in 2010. Although this can only be properly verified through donor surveys (Fisher, 1994), it does suggest at least that companies are more likely to support the Conservative party financially when Labour is seen as being more threatening.
It is also worth noting Labour’s reliance on declared donations from trade unions during the campaign period. Trade unions accounted for 96% of Labour’s declared donations in the six weeks leading up to polling day, up from 72% in the comparable period in 2015, 64% in 2010 and 41% in 2005. Over the same period, there has been a decline in declared individual donations. In 2005, 41% of Labour’s election period declared donations were from individuals. The figures for 2010, 2015 and 2017 were 24%, 12% and 4% respectively.
4. Election Period Expenditure
4.1 Conservatives
An important area of expenditure was digital campaigning. A feature of the 2015 campaign had been a very successful campaign on Facebook, with the micro-targeting opportunities that this presented. 2017 was no different. The party’s strong financial position and prior success meant that the digital operation was very well resourced. But, there were some issues that hindered the full potential of this approach. First, there were data weaknesses. According to Mark Wallace (2017a), centrally held data used for the purposes of targeting voters were out of date compared with 2015, and critically, were focused on the type of contests fought in 2015 rather than 2017. For example, while the Conservatives had very successfully targeted Liberal Democrat seats in 2015, the circumstances in 2017 were very different as a function of the EU Referendum. In the aftermath of that, the kinds of voters the party sought to target were former UKIP voters and Labour Leave voters. The party recognised this disparity and spent time early in the campaign on new polling and consumer data (Wallace, 2017a). A second issue, according to Wallace (2017a), was that the party assumed that young voters were not a priority. This informed the choice of digital platforms, where Labour proved to be much more innovative (see below).
As in previous elections, however, it was print that continued to be a significant source of expenditure. This manifested itself in two prominent ways. First, the party engaged significantly in ‘wraparound’ adverts in local and regional newspapers. These are adverts that wrap around the newspaper, meaning that the front and back pages of the paper constitute a party advertisement. Not surprisingly, these were focused on areas with target seats. The second major area was direct mail, although the problems with central data described above did apparently cause some delays in distribution. But according to Wallace (2017b), there was one unforeseen problem beyond the control of the party—namely a difficulty in getting huge amounts printed at short notice, in part because of an apparent shortage of paper! The party’s financial advantage did mean however, that it was able to have more professional staff on the ground. A survey of party agents indicates that some 21% of agents were employed by the national party or local associations (compared with 3% for Labour) (Fisher, Cutts and Fieldhouse, 2017)
At party headquarters, however, the snap election meant that it was difficult to fully exploit the party’s financial advantage. For example, as Figures 11.1 and 11.3 show, party income and expenditure cycles closely around the timing of general elections. The key here, is Conservative expenditure—this fell sharply in 2016 as per previous elections. In one sense, this is to be expected, since income falls noticeably in the same period. However, the outcome for the Conservatives in 2017 was that when the election was called, the level of staffing at all levels of party headquarters compared with the run-up to the 2015 election was far lower. Thus, while the party was ultimately able to engage staff, the sudden calling of the election meant that it was at a potential disadvantage having lost many staff who helped fight the election two years previously. Critically, this included senior figures such as Lynton Crosby who were hired as consultants, but who were based abroad when the election was called (Wallace, 2017a).
Overall, the Conservative national expenditure revealed the continuation of particular trends. First, based on the success of its use in 2015 and the shorter lead time compared with print, digital campaigning continued to grow in importance. Second, however, print campaigning was far from obsolete and continued to be an important campaigning tool. Third, the national campaigning continued to be effectively subsumed into one that supported the campaigns in the key constituencies. Fourth, the Conservative Party’s strong financial position meant that it was able to spend sufficient funds on a range of activities. Yet, for all the financial advantages in the short term, the party’s campaigns were not without difficulties on account of the snap election. It took time to re-establish the staff complement and the data underpinning the print and digital campaigns presented some problems—at least initially. In sum, the Conservatives’ considerable short-term financial advantage was offset to a degree by the sudden calling of the election.
4.2 Labour
A number of financial aspects influenced Labour’s campaign. First, the snap election meant the bulk of the spending was compressed at the backend of the campaign. Second, and perhaps most critically, there was no agreed list of target seats. A combination of the party’s poor opinion poll position and the need to select candidates at short notice in a number of seats meant that in many ways, this was a less coordinated campaign compared with previous elections. But it was still, in effect, a national campaign that was subordinate to the constituency efforts.
However, one particular financial windfall benefited Labour quite significantly, despite the snap election. The leadership election in 2016 generated significant income and as a result, Labour was able to spend £2 million almost as soon as the election was called. This opportunity was particularly welcome as the main donations from trade unions did not appear until the second half of May and, as in 2015, some unions were keen that their contributions should be focused on particular candidates who shared their own ideological preferences (Fisher, 2015, p. 150).
Overall, the party spent around £11 million. As in previous elections, printed matter continued to represent a significant item of expenditure, but developments in digital campaigning continued and were a key feature of the party’s campaign, if not its expenditure. Overall, Labour spent £1.2 million on digital campaigning. The bulk of this was on Facebook, but a feature of this campaign was the way Labour diversified its digital activity. In addition, the party also utilized YouTube, Twitter and for the first time, Snapchat. Labour was of the view that to mobilize younger voters it needed to engage with a platform used overwhelmingly by them, especially as its digital team reported that young people were now less likely to use Facebook. The party spent £100,000 on Snapchat adverts, which generated 7.8 million views (interview with party official). On polling day, Labour also spent £90,000 on a promoted post on Twitter, while on YouTube the party invested in non-skippable adverts of around fifteen seconds (interview with party official).
In addition, as Chapter 12 explains, the party had developed a new digital tool called Promote, which allowed the party’s existing databases and the electoral roll to link with Facebook IDs, meaning that voters could receive messages both through the direct mail medium and through Facebook. This meant that the digital targeting was much more precise than in previous elections, but equally represented an evolution from targeted direct mail rather than something that was fundamentally different. And critically, the party still focused more attention on print advertising for the simple reason that only an estimated 60% of the population uses Facebook. Elsewhere, the party invested in other digital tools to assist in internal campaign organisation. Chatter was a text message based system whereby potential campaign volunteers could be contacted, while Dialogue allowed volunteers to contact voters by telephone from home without their number being revealed. Beyond these initiatives, the absence of some older campaign approaches was again apparent. Labour did not invest in any fixed billboards or national newspaper advertising. Where there was non-constituency-focused advertising, it was in local newspapers covering a few seats, where the party took out around 40-50 advertisements.
Overall, Labour’s campaign and spending confirmed previous trends: the supporting role of the national campaign to constituency efforts, the growing importance of digital approaches, but also the continued importance of direct mail. However, what marked it out was the relative lack of coordination at national level. In effect, there were two campaigns: one run by the central party and one run by the leader’s office. All in all, while this election continued the decline of the national campaign, the sudden nature of the election, together with the lack of coordination meant this was a more haphazard affair.
4.3 Liberal Democrats
The Liberal Democrats were the best prepared of the three principal parties, having started to prepare in the summer of 2016, following the referendum and the change of Conservative leader. This meant that unlike the other parties, their candidates were already in place. Coupled with that, the party’s financial situation had improved, in part because of a surge in membership.
A variety of campaign activities were funded. Despite the lack of lead time, a significant sum was spent on direct mail, which was heavily targeted on key voters in key seats. Equally, the leader’s tour was also a crucial component of the target seat strategy, as was telephone voter identification, which took place both at the party’s headquarters and through ‘virtual’ phone banks. Like Labour, there were no national newspaper advertisements or fixed billboards—only mobile digital billboards on vans, just as in 2015 (Fisher, 2015, p. 151).
In addition to this campaign spending on established approaches, the Liberal Democrats also spent heavily on digital techniques. The party has embraced digital campaigning for some years now, even claiming it ‘won the digital war’ at the 2010 general election (Fisher et al., 2011, p. 205) and indeed, claimed it ran its biggest ever digital campaign in 2017. Facebook was the principal platform, the party viewing it as having the most volume, the level of resource behind Facebook meaning that response rates would be likely to be better. The party used it in a number of ways, including individual and geo-targeting of advertisements as well as videos. The party also made use of Facebook Live. In sum, despite the party’s perilous electoral position following the 2015 election, it went into the 2017 campaign with healthier finances, significantly more members and, under the circumstances, with good levels of preparation. Coupled with the growing emphasis on digital campaigning, the party was able to take advantage of the significant level of fundraising it achieved during the campaign, which was nearly double that which was collected in 2015.
5. Conclusion
The sudden calling of the general election in April 2017 had significant implications in terms of party finance. At the start of the year, Labour was in the relatively unusual position of being at a financial advantage relative to the Conservatives—ironically, in part due to the instability surrounding the party’s leadership between 2015 and 2016. But by the time of the election, the Conservatives had re-asserted their financial dominance, raising very significant sums in a short period of time. In the longer term this initial advantage for Labour may be more difficult to achieve, since there will not be the one-off events of leadership elections generating new income, and the effects of ‘contracting-in’ for new trade union members may be unpredictable.
The snap election also impacted upon spending decisions and critically, the ability of parties to exploit their financial position. Yet it also affected how parties spent money on campaigning. More established methods like direct mail require long lead times to be truly effective. But as digital campaigning continued to grow, the short lead time meant that it made more sense to accelerate the use of these methods. The key benefit of digital campaigning in 2017 was that it presented more opportunities for ‘late spend’—campaign expenditure right up to polling day. There was variation by party in the extent and diversity of digital campaigning, but overall, it continues to grow, with its use increased by the snap election. But that does not mean that everything has changed. Print campaigning was still the dominant form of campaign expenditure, not least because of its wider reach. Digital approaches remain second best in terms of reaching large numbers of voters and the much-trumpeted micro-targeting represents an evolution of that which has gone on for many years with direct mail, rather than a revolution in voter contact. The balance between campaigning tools will no doubt continue to shift towards digital, but for now, it continues to play second fiddle in terms of campaign expenditure.
