


Abstract
To assess potential public concerns, this paper examines theory and evidence surrounding graduate educational underemployment (overeducation) in this era of mass higher education. Using a new, validated, index of graduate jobs, we find that the prevalence of graduate underemployment across 21 countries is correlated with the aggregate supply–demand imbalance, but not with indicators of labour market flexibility. Underemployment’s association with lower job satisfaction and pay is widespread. Yet in most countries there are external benefits (social trust, volunteering, and political efficacy) associated with higher education, even for those who are underemployed. Taken together with existing studies we find that, in this era of mass higher education participation, under-employment is a useful indicator of the extent of macroeconomic disequilibrium in the graduate labour market. We conclude that governments should monitor graduate underemployment, but that higher education policy should be based on social returns and should recall higher education’s wider purposes.
I. Introduction: who’s worried about the underemployment of graduates?
We are living through an era of increasing mass participation in higher education, the consequence of which is an unprecedented generalized expansion across developed (and many developing) countries in the proportion of highly educated workers. Across the Organization for Economic Cooperation and Development (OECD) between 2000 and 2014 the proportion of 25–34 year-olds with tertiary education rose by an average of 15 percentage points to around 41 per cent ( OECD, 2015 , p. 44). There was much variation between countries, ranging from Finland where the increase was low (it started from a high level), to countries such as South Korea and Poland where the rise exceeded 25 percentage points. This transformation has been generally welcomed and in most cases actively supported by policy-makers, but also poses the question of how far graduates can find employment to match their education level, and the extent to which many find themselves educationally ‘underemployed’—that is, with a level of educational achievement that exceeds that required for the job. 1 Should governments worry about the spectacle of shopkeepers and office clerks apparently wasting their university education? Should they be concerned that extended higher education without commensurate employment breeds mass disillusion? Are young people nowadays taking a big risk in devoting both their time and money to higher education? Are there, nonetheless, further benefits from higher education, both for graduates and others, that should frame governments’ policy perspectives surrounding the ongoing expansion of higher education?
To address these big issues, this paper examines theory and evidence surrounding underemployment, and studies the prevalence of graduate underemployment across 21 countries, and its potential policy implications. The answer emerging from this exercise to the question in our title is, broadly: ‘yes, but . . .’. We find that the penalties, in terms of lost wages and lower job satisfaction, for failing to land a graduate job are widespread across almost all countries examined. A certain disillusion with higher education is thus a reality for many. Nevertheless, we find also that there are significant alternative benefits from higher education that accrue even to graduates who are underemployed, including better self-reported health and greater external benefits for the rest of society. The evidence suggests, therefore, that governments should indeed be concerned with policies to mitigate graduate underemployment, but should also consider the wider purposes of higher education as a public good.
Academic scholars have concerned themselves with the spectre of underemployment for some decades ( McGuinness, 2006 ; Leuven and Oosterbeek, 2011 ), though typically concern has been higher among heterodox economists and sociologists than within the mainstream of neoclassical economics. In some countries worries about underemployment have emerged openly in public discourse. Mok et al. (2016) have documented such apprehensions among recent students in China and Taiwan. Media search in the US, the UK, and Canada reveals concerns with the difficulties of recent graduates in finding well-paid jobs and the potential implications for family formation, housing, and repayment of student debt (e.g. Leonhardt, 2014 ; Burnett, 2015 ; Ferro, 2015 ; Thompson, 2015 ; Williams, 2015 ). The Economist (28 March 2015) in its main feature asks of the global expansion of university participation: ‘Is it worth it?’ In Japan the bulk recruitment of students before graduation by large employers (a policy now abolished in South Korea) is a continued cause of stress: graduates without an employment contract at the time of graduation fear lifelong precarious employment. The concern over post-college employment could not be said to be universal. In other countries public worry has often focused, as in Denmark and Finland, on the consequences of post-recession austerity for higher education systems and the implications for the viability of some higher education institutions or for student support. In Germany media concern surrounds the changing roles of vocational and academic education (e.g. Füller, 2013 ; Mühl, 2015 ). Nevertheless, the instrumental orientation that sees higher education’s purpose as a route to good and secure employment appears to be widespread.
Concern with underemployment has fed its way only patchily and indirectly into the policy-maker’s world. Some countries do collect data on the employment of recent graduates, and agencies write reports about recent graduate cohorts, but with few tangible policy outcomes (e.g. ONS, 2013 ; Statistics Canada, 2014 ; Abel et al. , 2014 ; Bildungsbericht, 2014 ; European Commission, 2015 ). For example, the EU Commission reports the proportion of recent graduates who are in non-graduate jobs but, unlike for participation rates in tertiary education and subsequent employment rates, there is no policy target for over-education. Obama’s US administration wants ‘college for all’. Nevertheless there are broader attempts to reform higher education systems, such as through the EU Bologna process, to enhance the employability of graduates ( European Commission, 2015 ), and the employment success of universities’ graduates has become an increasingly important metric (consider, for example, the foundation and growth of the AlmaLaurea consortium), entering into increasingly important global rankings.
The paper is organized as follows. The next section sets the scene by briefly summarizing what is known about the determinants and consequences of underemployment, including its relationships with skill heterogeneity and with skills underutilization. While our summary will draw on studies from a number of countries, international studies that compare the prevalence and consequences across countries are scarce. Indeed, very little is reliably known about how much underemployment varies across countries, and the factors behind such variation. Also insufficiently studied are the potential social effects of underemployment: though it is known that graduate education has a number of social benefits above the conventional private returns in the labour market, what is unknown is the extent to which, if at all, higher education’s social returns can be realized when graduates fail to find graduate jobs.
These issues, which should be important background for a proper evaluation of the policy stance towards graduate underemployment, are examined in section III, for 22 countries in the OECD that participated in the first wave of the Programme for International Assessment of Adult Competences (PIAAC), also termed the Survey of Adult Skills (SAS). We make use of a new 3-digit occupation classification in each country of ‘graduate jobs’, derived using skills utilization data from the survey. This classification method, which has been empirically validated elsewhere ( Green and Henseke, 2016 a ), keeps the resulting index close in principle to the concept of a graduate job. Section IV then considers general consequential implications for any government’s policy stance concerning higher education and graduate underemployment.
II. Theoretical frameworks and evidence surrounding underemployment
The aim of this section is to interrogate theory and existing evidence for what they imply, if anything, about the significance of underemployment for the widespread policy of encouraging the expansion of higher education.
(i) Why underemployment is a useful analytical concept
According to all economic theories of a dynamic labour market, there will always be some degree of mismatch between educational achievements and job requirements. Some people’s education will exceed requirements and they will be underemployed; others’ vice versa. The normal adjustments of a functioning labour market should operate to reduce imbalances as they appear. In the short term, workers and firms respond to market signals, firms by recruiting or retrenching, workers through job search, mobility, or training. Job requirements themselves become elastic, as employers design jobs to suit their workers and prevailing technologies, while job-holders mould their jobs towards their own skills. In the long term, if there are imbalances between the supply of graduates and the demand to fill graduate jobs, the returns to higher education will change and young people will modify their education and training plans. Since all such adjustments are by no means instantaneous, frictional mismatches, including underemployment, remain (in parallel with frictional unemployment).
From the viewpoint of human capital theory, education–job mismatches among graduates are largely temporary, or else no more than an artificial conceit masking skill gaps between the matched and mismatched. In this perspective, therefore, underemployment is not a phenomenon of major concern. An additional consideration is the phenomenon of credentialism, whereby college credentials signal abilities correlated with academic performance. In such a world, underemployment (or overeducation) is interpreted as an equilibrium phenomenon, with education settling at an above-optimum level (e.g. Charlot and Decreuse, 2010 ). Recent studies have been directed at theorizing the wage effects of underemployment as emerging from equilibrium wage bargaining ( Sattinger and Hartog, 2013 ).
Most scientific interest in underemployment stems, by contrast, not from a denigration of the value of education as merely a signal for what is important to employers, but from scepticism that labour markets are systematically functional in the way that human capital theory envisages. Sceptics have held, instead, either to a jobs competition model or to models of imperfect assignment between workers and jobs (see McGuinness, 2006 , for an overview). Either approach allows that underemployment can not only occur, but be persistent, genuine (i.e. reflecting underutilization of skill), and substantive.
Three main developments support the view that the concept of underemployment has important analytical value, especially in this era of mass higher education. Consider first the question of whether graduate underemployment is temporary or persistent. Earlier studies had suggested that there was an element of job search and/or learning involved in accepting a position below one’s educational level. Subsequent studies have thrown doubt on this conclusion, however, and longitudinal studies since have generally found a high degree of state dependence (that is, persistence) in being underemployed (e.g. Clark et al. (2014) for USA; Diem and Wolter (2014) for a cohort of recent Swiss graduates; Kiersztyn (2013) for Poland; Mavromaras et al. (2013) for Australia). It seems that being obliged to accept a lower-status job to end unemployment at the start of the career slows down the transition into an education-adequate job compared to a longer initial search period ( Baert et al. , 2013 ).
A second development surrounds the question of skills heterogeneity. Studies in a few countries have demonstrated that skill, among graduates, is a robust determinant of the likelihood of their being underemployed ( Green and McIntosh, 2007 ). It is also well known that estimates of the underemployment wage penalty may be biased because of unobserved endogenous factors that affect both underemployment status and wages. Yet despite some endeavour, none has demonstrated that all or even most mismatch is due to such heterogeneity. Moreover, even with objective test data available in the OECD’s Survey of Adult Skills, the association of underemployment with lower pay is only to a minority extent accounted for by numerical skills ( Levels et al. , 2014 ). No reliable piece of evidence has refuted that a substantial proportion of over-educated workers would be able to pursue a more skilled job. 2 In our reading of the evidence, most graduates in non-graduate jobs would be able to perform at least some graduate jobs, if given the opportunity of acquiring the necessary on-the-job skills.
This skills heterogeneity question is linked to the view that it may for some purposes be more fruitful for analysts to focus on skills, rather than educational, mismatch (e.g. Allen and van der Velden, 2001 ; Green and McIntosh, 2007 ; Quintini, 2011 a ). Studies of self-report indicators of skills under-utilization have indicated that these may be better than educational underemployment as predictors of labour market penalties. Nevertheless, further analysis of graduate skills mismatch has been hampered by lack of any scientific consensus about what constitute adequate, meaningful indicators. Subjective measures have been derived from sometimes ill-advised survey questions that place undue emphasis on the respondent’s own skills, inviting social esteem bias: to illustrate, one such measure, in SAS’s background questionnaire, implied that nearly nine in ten workers experienced skill underutilization, a result which could not be interpreted meaningfully. Capturing domain-specific skills mismatch has also so far proved difficult. Thus, although a useful goal would be to analyse and interpret underemployment primarily through the lens of skill underutilization, this objective is yet to be achieved by researchers working in this field.
A third development addresses a long-standing claim, namely that the elasticity of jobs and flexible labour markets make it nigh on impossible to delineate the education or skill requirements of jobs in an objective manner; from that it followed that underemployment could also not be defined objectively. Others have gone further, likening the specification of educational requirements to an aspiration for Soviet-style manpower planning ( McMahon, 2009 , p. 110). Yet the growth of task-based analyses of jobs in several countries belies that comparison: these demonstrate the value of both educational requirement and task measures for understanding both changing skills demands and distributional trends (e.g. Spitz-Oener, 2006 ).
In the assessment of Leuven and Oosterbeek (2011) , disputed measurement methods (including undue reliance on the ‘realized matches’ indicators of required education) are a reason that leads them to a pessimistic prognosis for whether underemployment has much of use to contribute to understanding of modern labour markets. It is also sometimes advanced that it is better to consider evidence on trends in the economic returns to graduation, than evidence on underemployment. This preference stems, one can surmise, from the view that one can have more confidence in estimates of the returns than in indicators of jobs’ educational requirements, and from reliance on an equilibrium perspective.
Yet in our view these two approaches—educational mismatch and rates of return—should not be regarded as substitutes. Especially in the current era, with the extraordinary change in the supply of graduates juxtaposed against the uncertain employment effects of the fourth industrial revolution, examination of past rates of return is a potentially unreliable guide. Moreover, in a world with some form of job competition, it is quite possible for there to be stable returns to graduate education if underemployed graduates displace less educated workers in the middle into even lower-skilled jobs; and neither wage returns nor underemployment amply capture productivity differences. 3 A full-information approach that integrates both price and quantity in a complementary analysis promises more insight. Even if young people do respond appropriately to market signals for higher education, the responses are typically governed on a longer time horizon than that of the macro-social changes now occurring following the expansion of mass higher education participation. Increased under-employment could be expected from this expansion, especially where high-skill demand growth is sluggish, and should be monitored for the suggestive information it provides about potential future price changes. Indeed, it would be misleading to examine the issue of the overall balance of supply and demand for graduates solely through a backward-oriented estimate of the rate of return. Since pay is not just determined by higher education qualifications, labour market reactions are likely to be slow and mixed.
Not least, one should ask: whose rate of return? In an increasingly mass, globalized, market for graduates, the trends for the average rate of return—as typically reported—may differ markedly from those at the top and bottom ends of the spectrum. Recently, differentiation has been recorded along a number of dimensions, including the subject and grade of degree, and, potentially, type of university ( Walker and Zhu, 2011 ; Dale and Krueger, 2014 ; Webber, 2014 ). Strohush and Wanner (2015) , for example, found that although on average a US college education pays, by 2010 there were significant groups who would have been better off not attending college. In a significant number of studies, the differentiations appear to be growing. The evidence also points, moreover, to a (related) increasing pay penalty for underemployed graduates compared with matched graduates ( Green and Zhu, 2010 ).
(ii) The growth and international distribution of underemployment
The foregoing arguments imply that underemployment can be a useful analytical concept, where the phenomenon comprises not only the outcome of a microeconomic matching process but also a macroeconomic disequilibrium . This is especially the case for graduate underemployment at a time of rapid growth in the supply of higher-educated labour. This perspective takes graduate underemployment to be similar, in its macroeconomic and involuntary character, to unemployment. Its analytical value rests neither on an equilibrium view of the labour market, nor on the extent of credence afforded to signalling as a description of the function of higher education ( McMahon, 2009 , p. 111).
We are also less pessimistic than Leuven and Oosterbeek (2011) about the prospects for insightful empirical research, provided that it does not rest on weak measures of underemployment derived from realized matches. Research is now showing that graduate underemployment became more prevalent in Great Britain between 1992 and 2006, while overall education rose in Germany between 1991 and 1999 ( Green, 2013 , p. 131). Similar trends for general underemployment have been observed for Poland ( Kiersztyn, 2013 ) and Sweden ( Korpi and Tåhlin, 2009 ). These countries are probably not alone. What might lie behind this growth? There are no studies providing estimates of how much is an optimal amount of graduate mismatch, and how much, therefore, might be too much. The growth of underemployment might be taken as an indication that the economy is moving away from its optimum, reflecting a deterioration of the efficiency of its labour market institutions for matching workers to jobs. However, in the absence of other evidence for such a deterioration, a more likely explanation is that the growth reflects an increasing aggregate imbalance between graduate labour and graduate jobs.
Recent studies have also found that, using consistent measures, underemployment markedly differs across countries. The OECD’s Survey of Adult Skills indicates that the incidence of underemployment as reported by workers’ reports of their jobs’ educational requirements ranges from 13 per cent of the overall workforce in Italy to as much as 31 per cent in Japan ( OECD, 2013 a , p. 171). 4 Such large cross-national variation might be due to national differences in skills matching institutions (reflecting the characteristics of both the education system and labour market institutions). Some existing studies have implicated labour market rigidities as captured by employment protection regulations or by union density, and education system characteristics such as the general/specialized orientation of higher education. Other work in the context of skills mismatch suggest potential effects from product market regulations, housing market regulations, or managerial quality on the individual probability of working in well-matched jobs ( McGowan and Andrews, 2015 ). It is also plausible to expect that, where the demand for high-level skills and the supply of graduates have expanded at varying speeds, any supply–demand imbalances that arise will increase the prevalence of underemployment; support for this expectation is forthcoming from Verhaest and Van der Velden (2013) and Verhaest et al. , (2015) , who proxy the imbalance by the standardized stock of graduates relative to expenditure on R&D. A further macroeconomic factor is the state of the business cycle at the time when individuals first enter the labour market, which has been shown to correlate negatively with the incidence of underemployment (ibid). However, the existing cross-national evidence on graduate underemployment is based almost exclusively on data from alumni who graduated in 1999/2000 and their labour market circumstances 5 years later in 15 countries. So far, we know very little about the drivers of cross-national variation in underemployment in general populations of graduates.
(iii) Underemployment and the purpose of higher education
Our argument so far has concluded that it is relevant and potentially useful to examine underemployment, including its growth and distribution, and its effects on employment outcomes. Yet it is equally important not to translate concern about underemployment automatically into an argument against higher education. To do so would be to neglect the wider purposes of education as a preparation for life and as a potentially lifelong process, and to ignore the public-good character of higher education. It would also be a rejection of higher education’s historical roots. Rather than the development of specialized professional skills, higher education’s contribution to character formation, civic engagement, and involvement in knowledge creation through the development of reasoning powers by critical investigation and independent research was traditionally the dominant role of higher education in (Western) societies ( Altbach et al. , 2009 ).
And, for the present day, it is important to recall the external benefits of each individual’s higher education. There is robust evidence that higher education is associated with reduced crime rates, lower incarceration costs, lower welfare costs, enhanced health, reduced mortality, reduced calls on social medical expenditures, enhanced social trust, and increased civic participation ( McMahon, 2009 , pp. 201–27; Huang et al. , 2009 , 2011 , 2012 ; Lochner, 2011 ; Hout, 2012 ; Borgonovi and Burns, 2015 ; Hooghe et al. , 2015 ); 5 sometimes these external benefits are held to be reflected in others’ pay ( Moretti, 2004 ). With long lags, higher education is also associated with the development of democracy ( McMahon, 2009 , pp. 202–6), though it may also be associated with violent conflict and a rising social demand for democracy if mass higher education participation is not met by appropriate employment opportunities ( Campante and Chor, 2012 ). While these associations do not always reflect a causal impact of higher education, collectively they strongly suggest that the underemployment debate, both in academic scholarship and public discourse, is too narrowly focused on the employment effects of higher education.
Typically, studies of the external benefits of higher education do not examine whether they are mediated by employment or quality of employment. A partial exception is Huang et al. (2011) who find that a ‘life experience’ indicator, where the class of job is one of several components, does not mediate the impact of college education on social trust. Nevertheless, a question arises as to whether the higher education of graduates who do not subsequently gain graduate jobs contributes external benefits to other members of society. Are crime rates, public health, social trust, participation, and other social outcomes still improved? If the external benefits derive from the higher education itself and subsequent non-work life experiences, then the underemployed graduate would contribute no less than the matched graduate. It is even conceivable that graduates in non-graduate jobs would have time to contribute more external benefits, for example through volunteer activities. Conversely, it might be that graduates in non-graduate jobs become disillusioned, lack opportunities for ongoing work-based learning, and come to be quite similar (as regards external contributions to society) to their non-graduate co-workers doing the same jobs as themselves. The resolution of this empirical question, hitherto unexamined, would seem important to the case for ongoing expansion of higher education.
III. Graduate underemployment across the OECD: determinants and consequences
Our conclusion so far is that the evidence and arguments presented in studies of underemployment do, indeed, raise concerns about public policies for ever ongoing expansion of higher education. It is suggested that, at least in respect of studying the links between higher education and employment-related outcomes, underemployment estimates can be a useful complement to analyses of the rate of return. Moreover, underemployment is associated with some individual cost in terms of those employment outcomes, including lower pay and job satisfaction. Our knowledge of these costs across nations at different stages of higher education expansion and economic development is somewhat piecemeal, so a useful addition will be to document these costs across many countries in a consistent manner. We know from previous studies that there may be substantial variation across countries in the prevalence of underemployment, but we lack recent estimates of graduate underemployment and its effects in many countries. We also lack empirical evidence surrounding the relationship of underemployment, if any, to non-employment private benefits and to the external benefits of higher education.
Therefore, in this section we use consistent data for 21 countries, available in the OECD’s Survey of Adult Skills (SAS), to begin to address these gaps.
(i) The measurement of underemployment
SAS covers a target population of those over 16 but we confine our analysis to those aged 25–65 years ( OECD, 2013 b ). By the age of 25, almost all have completed full-time education, while those working after 65 are in a selective minority. SAS consists of a survey covering job tasks and educational requirements, several key outcomes, including earnings, health, and social trust, and many background characteristics. The survey is complemented by proficiency tests of literacy and numeracy ( OECD, 2012 ). 6 From the background survey, we are also able to include an index of ‘elaborate learning’, based on work by Kirby et al. (2003) . It is conceptualized as a personality trait in SAS and captures how employees approach learning at the workplace (OECD, 2013). Elaborate learning has been shown to correlate, for example, with informal learning ( Ferreira Sequeda et al. , 2015 ). Respondents’ educational attainment is collected using each country’s own codes, then reclassified to the International Standard Classification of Education 1997 (ISCED). We define a ‘graduate’, for the purposes of this paper, as anyone who has achieved at least ISCED level 5A. Respondents’ jobs are coded using the International Standard Classifications of Occupations in its 2008 revision.
To measure the educational requirements of a job, several approaches have been made in the literature. One school of thought prefers to use the ‘realized matches’ approach, coding the education requirement of each occupation according to the modal level, or some close variant. We have argued elsewhere that this method risks tautology when badly implemented, that it is unsuitable to examining change, and that it is particularly inappropriate when comparing educational requirements across nations ( Green, 2013 ). It is rarely validated independently. Any method which draws on evidence about the skill requirements of jobs is preferable in principle. In some cases expert methods can be deployed, but these often lack transparency and, again, are ill-suited to cross-national comparisons.
The advantage of openly accessible task-based data is that, combined with educational requirements data, they can be used to derive a conceptually more satisfactory indicator of graduate jobs, using transparent methods. In Green and Henseke (2016 a ) we derived an occupational indicator for ‘graduate job’, based on the evidence from the British Skills and Employment Survey of high levels of several skill domains. Using the task data, the high skill requirements are entered in a probit model as predictors of the probability that an individual reports that a graduate qualification is required for the job. A latent graduate skills requirement index is thereby calculated for each individual from the probit estimation. In the second stage this index is averaged within each 3-digit occupation. Finally, in the third stage a conventional cluster k-medians analysis is deployed to separate all 3-digit occupations into two clusters: graduate and non-graduate jobs. The resulting classification displays a plausible distribution across the major occupation groups. Of course, any such dichotomous classification will be fuzzy, a few occupations coming close to the threshold: its value is proven ultimately through its use. Ours is found to be a significant predictor of wages and other outcomes, better than traditional classifications.
Using the SAS data we followed the same principle and methods to derive an internationally consistent indicator of graduate jobs. The resulting classification, termed ISCO(HE)08, again shows a plausible distribution across major groups, though this differs from one country to another, reflecting how graduates and other types of labour are used. Across countries, this indicator is again found to be a superior predictor compared with other classifications. The details of the method are described in Henseke and Green (2015) and updated resulting classifications for each of the 22 countries analysed in this paper are given in Green and Henseke (2016 b ). Having classified all jobs as graduate or non-graduate, it is then straightforward to define graduate underemployment as occurring where a graduate is in a non-graduate job.
Some previous studies attempt to go further and sub-divide underemployment according to whether it is ‘genuine’ (or ‘real’), or just ‘apparent’ (or ‘formal’), according to whether underemployed people are underutilizing their skills. Such studies require independent estimates of skills mismatch which, as noted above, remain a contested area. In this paper, however, while we do examine the role of skills heterogeneity, we focus on underemployment in total and its potential links to policy.
Specifically, we address the following questions.
– Which countries are experiencing high and low levels of underemployment among their graduates? To what extent is the underemployment linked to skill differences between matched and underemployed graduates?
– Is a high prevalence of underemployment associated with substantial excess supply of graduates, or with labour market institutions that might inhibit or improve skills matching?
– Across countries, what are the private penalties among graduates for being underemployed, and what nonetheless are the benefits of graduation, even if underemployed?
– What, if anything, are the external benefits from higher education, even if graduates find themselves in non-graduate jobs?
(ii) How underemployment varies across nations
Addressing our first question, Figure 1 shows that there is large cross-national variation in the incidence of graduate underemployment: ranging from 11 per cent in Finland to almost 50 per cent in Japan. It is notable that anglophone countries (UK, 7 USA, Ireland, and Canada) are positioned at the upper end of the spectrum. The Nordic countries, with the exception of Denmark, find themselves at the opposite end of the spectrum. However, no simple conventional classification of countries fits the variation overall. Other countries’ labour markets that have also apparently absorbed higher education graduates well include Poland (15 per cent), Germany (16 per cent), Cyprus (17 per cent), and Italy (17 per cent), while at 38 per cent graduate underemployment appears more problematic in the Czech Republic, despite the fact that graduates are a relatively low proportion of the labour force.
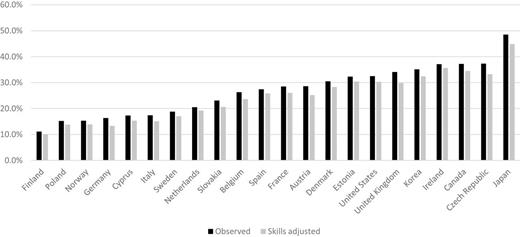
Proportion of underemployed graduates, observed and skills adjusted
Note : Employed graduates from higher education aged 25–65 years.
Graduate underemployment, as noted earlier, is sometimes cast without evidence as entirely a symptom of skills heterogeneity, implying that only less capable graduates become sorted into less skills-demanding jobs. In the same vein, policy initiatives to reduce underemployment tend to focus only on an assumed lack of employability skills among graduates (e.g. European Commission, 2015 , p. 68). We consider in Table 1 how much the varying incidence of graduate underemployment can be accounted for in terms of skill heterogeneity, using the information on literacy and numeracy skills as well as the elaborate learning trait.
Underemployment among graduates and the role of skills heterogeneity
| (1) | (2) | (3) | (4) | (5) | (6) | |
|---|---|---|---|---|---|---|
| Country | Share of graduates (% in labour force) | Underemployed (% among graduates) | Numeracy | Literacy | Elaborate learning | Underemployed (adjusted %) |
| Austria | 12.6 | 28.6 | –0.00295*** | –0.00307*** | –0.0213 | 25.2 |
| Belgium | 18.3 | 26.3 | –0.00101* | –0.000900 | –0.0523*** | 23.6 |
| Canada | 30.6 | 37.2 | –0.00199*** | –0.00244*** | –0.0401*** | 34.5 |
| Cyprus | 26.5 | 17.3 | –0.00125* | –0.00114* | –0.0184 | 15.3 |
| Czech | 19.1 | 37.3 | –0.00106 # | –0.000615 | –0.0211 | 33.2 |
| Denmark | 20.6 | 30.5 | –0.00192*** | –0.00226*** | –0.0545*** | 28.3 |
| Estonia | 26.6 | 32.3 | –0.00166*** | –0.00214*** | –0.0500*** | 30.4 |
| Finland | 28.3 | 11.1 | –0.00135** | –0.00103* | –0.00994 | 10.1 |
| France | 20.6 | 28.5 | –0.00180*** | –0.00152*** | –0.0442*** | 26.0 |
| Germany | 21.6 | 16.3 | –0.00257 | –0.00304** | –0.0114 | 13.3 |
| Ireland | 24.2 | 37.1 | –0.000520 | –0.000976 | 0.00648 | 35.6 |
| Italy | 15.7 | 17.4 | –0.00121*** | –0.00105** | –0.0276* | 15.1 |
| Japan | 27.9 | 48.5 | –0.00206*** | –0.00109 # | –0.0214 # | 44.8 |
| Korea | 24.8 | 35.1 | –0.00193*** | –0.00265*** | –0.0489*** | 32.4 |
| Netherlands | 32.4 | 20.5 | –0.00129** | –0.00172*** | –0.0366*** | 19.2 |
| Norway | 36.7 | 15.3 | –0.00109** | –0.00121** | –0.00488 | 13.9 |
| Poland | 33.7 | 15.2 | –0.000929** | –0.000864* | –0.0423*** | 13.8 |
| Slovakia | 23.8 | 23.1 | –0.000849 # | –0.000384 | –0.0223 # | 20.6 |
| Spain | 26.2 | 27.4 | –0.00110* | –0.00120* | –0.0118 | 25.8 |
| Sweden | 24.5 | 18.8 | –0.00215*** | –0.00175*** | –0.0257 # | 17.0 |
| England/NI | 27.7 | 34.1 | –0.00255*** | –0.00290*** | –0.0369** | 29.8 |
| USA | 32.0 | 32.5 | –0.00240*** | –0.00214*** | –0.0237 # | 30.3 |
Note : Columns (3), (4), and (5) summarize the marginal effects of cognitive and non-cognitive skills on the individual probability of underemployment in a sample of employed graduates aged 25–65 years. The marginal effects are calculated from probit estimations of the graduate job indicator on a set of control variables (age group, dependent children dummy, and a cohabitation dummy, all fully interacted with a gender dummy) all interacted with the skill variable relevant for each column. The adjusted proportions of underemployed graduates in column (6) were predicted from coefficients of a logit regressions including the controls and all the skill domains jointly, assuming mismatched graduates were endowed with the average skill levels of matched graduates. #p<0.1, *p<0.05, **p<0.01, ***p<0.001.
Column (1) gives the proportion of graduates in the labour force in each country, with Norway having the highest proportion. Column (2) reports the observed incidence of underemployment, as shown in Figure 1 . Columns (3)–(5) show the marginal effects of numeracy, literacy, and elaborate learning skills on the individual propensity to work in a non-graduate job. First, in every country except for Ireland, at least one skill domain correlates significantly with the likelihood of underemployment. The point estimates of cognitive skills are largest in Austria, Germany (though the coefficient of numeracy is insignificant in the latter), and the UK. Sweden, Denmark, the United States, Canada, and Korea also have relatively large effects of cognitive skills on the propensity of mismatch. Ireland, Slovakia, Czech, Poland, Belgium, Italy, and Spain were at the other end of the spectrum—suggesting that underemployment is more often ‘genuine’ in these countries. The pattern is different for elaborate learning skills, where the scale was statistically associated with the likelihood of underemployment in only ten out of the 22 countries. Estimated effects were largest in France, Korea, Estonia, Belgium, and Denmark.
Although the variation in individuals’ skills is associated with each individual’s chances of being underemployed, are the magnitudes of the correlations large enough so as to make a sizeable difference, relative to the inter-country variation in underemployment? To consider this we conducted a simple hypothetical accounting decomposition. We ran within-country estimations of the underemployment indicator on all the skill domains and demographic controls, then computed the predicted probability of underemployment for each individual, after replacing the skill levels with those of an average graduate doing a graduate job. When aggregated, this yields the predicted prevalence of underemployment in the country, shown in column (5). While this is an artificial exercise, since it does not model general equilibrium adjustments, it gives an indication of how important skills heterogeneity might be for understanding the variation in underemployment. Comparing columns (1) and (5), it can be seen that the incidence of underemployment is lower in this artificial prediction than the actual prevalence. However, the differences are small everywhere. The comparison is also illustrated in Figure 1 , which shows the skills-adjusted bars alongside the frequency bars. In 14 out of 22 countries, adjusting for skills reduces the predicted incidence of underemployment by less than 10 per cent. The relative drop in underemployment after accounting for skills heterogeneity was largest in Germany, Italy, and the UK, perhaps reflecting greater heterogeneity in these higher education systems. Nevertheless, skill differences between matched and mismatched graduates not only fail to account for a substantial fraction of underemployment within countries, they also make little difference to the range of variation across countries.
We assess next the case that variations in the aggregate supply/demand of graduates relative to graduate jobs may lie behind the cross-national variation in the prevalence of graduate underemployment. To do this, we define the ‘relative demand for graduates’ as the ratio of the number of graduate jobs in the economy (without current vacancies) over the supply of graduates. In the majority of countries the relative demand is positive, with more graduate jobs than there are graduates. The exceptions are Japan, Ireland, Canada, USA, Spain, Czech Republic, and Korea.
Figure 2 plots this relative demand on its horizontal axis against the proportion of graduates who are educationally underemployed, for 21 OECD countries. The plot shows a strong negative relationship. Thus, a country with a lower relative demand for graduates has a higher proportion of underemployed graduates. The regression line indicates that a 10 percentage increase in relative demand for graduates is associated with a relative drop in graduate underemployment by 3 percentage points.
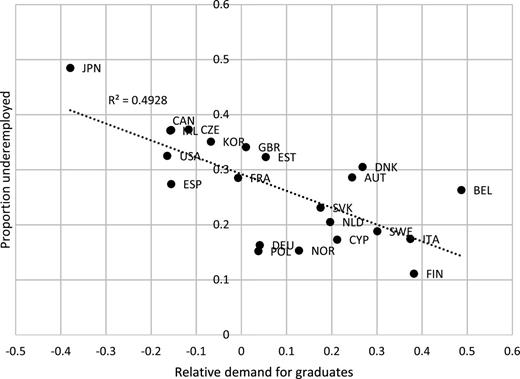
Underemployment and the relative demand for graduates
Of course, the simple correlation between relative demand and underemployment, while statistically significant and quantitatively large, could be a reflection of other correlated factors or of aggregation at the country level. Other factors would seem to be relevant, not least because not every country is situated close to the regression line on Figure 2 . Germany, Poland, and Norway form a cluster with unusually low proportions of underemployment given the relative demand, while Denmark and Austria have higher proportions of underemployed graduates than suggested by the relative demand.
The main potential theoretical candidate for other factors to explain the variations is skills matching efficiencies. Following earlier studies, to partially capture matching efficiency we use two possible indicators: the strictness of employment protection legislation (EPL) for people in permanent jobs and coverage of union wage-bargaining agreements. Table 2 reports the results of simple regressions of three determinants of the log of underemployment across countries: relative demand EPL and wage-bargaining coverage. Each measure by itself is negatively associated with the proportion of underemployment. Column 1 shows the negative effect of relative demand illustrated already in Figure 2 . But also countries with higher EPL or higher wage-bargaining coverage have lower proportions of graduate underemployment (columns 2 and 3). Both variables explain a similar fraction of the variation in graduate underemployment across countries. However, if we combine all variables, only the measure of relative demand emerges as a significant predictor of underemployment (column 4). Compared to the bivariate regression, the point estimate is slightly reduced to –0.9. But conditional on relative demand there is no evidence that either EPL or union power correlates with level of underemployment among graduates in these countries. This finding also holds when either EPL or union power are entered separately with relative demand into the regression and neither changes when we swap the observed proportion of underemployment with residual underemployment after adjusting for skills and demography. Thus, differences in search frictions—as measured by these variables—do not appear to account for variations in graduate underemployment; this finding corroborates previous cross-national studies ( Verhaest and van der Velden, 2013 ; Verhaest et al. , 2015 ).
Country differences in the propensity of graduate underemployment
| (1) | (2) | (3) | (4) | |
|---|---|---|---|---|
| Log (underemployed) | Log (underemployed) | Log (underemployed) | Log (underemployed) | |
| Relative demand | –1.099**(0.305) | –0.942 # (0.454) | ||
| EPL | –0.271* (0.110) | –0.147 (0.115) | ||
| Union coverage | –0.00617* (0.00247) | 0.000473 (0.00339) | ||
| N | 21 | 21 | 21 | 21 |
| R 2 | 0.407 | 0.241 | 0.247 | 0.460 |
| adj. R 2 | 0.375 | 0.201 | 0.207 | 0.365 |
Notes : OLS regression of the proportion of underemployed graduates at country level on the relative demand for graduates, EPL, and union coverage. EPL for workers on permanent positions is taken from the OECD. Figures on union coverage of wage bargaining are from the most recent issue of the Visser database (Visser, 2015). List of countries: AUT, BEL, CAN, CZE, CZE DEN, EST, FIN, FRA, DEU, IRL, ITA, JPN, KOR, NLD, NOR, POL, SVK, ESP, SWE, GBR, USA. Standard errors in parentheses. #p < .1, * p < .05, ** p < 0.01, *** p < 0.001.
(iii) The private and social effects of graduate underemployment
Higher education is held to increase individuals’ chances of access to better paid jobs, to improve healthiness, and to generate external benefits for society. We now use the SAS data to address our third and fourth policy-related research questions. We provide consistent estimates across 21 countries of the pay and non-pay penalties for graduates of being underemployed, and simultaneously the benefits from being a graduate for those working in non-graduate jobs. The estimates do not establish causal processes, since both education and underemployment status are potentially endogenous, introducing potential biases. Comparisons between countries are nevertheless made, on the assumption that the sources of endogeneity and bias are similar across countries and that therefore the differences in the estimates are informative. We also present consistent estimates, for the first time in any country, of the effects of higher education on three indicators of external benefit: social trust, civic participation, and political efficacy. 8
Table 3 summarizes the relative differences between matched and mismatched graduates (MG vs MiG) and the relative differences between mismatched graduates and matched non-graduates (MiG vs MnG) with respect to earnings, job satisfaction, self-reported health, social trust, civic participation, and political efficacy.
Differences in earnings, job satisfaction, and social capital by educational attainment and underemployment status
| (1) | (2) | (3) | (4) | (5) | (6) | (7) | ||
|---|---|---|---|---|---|---|---|---|
| Pr (low earnings) | Pr (high earnings) | Pr (job dissatisfaction) | Health | Social trust | Civic participation | Political efficacy | ||
| AUT | MG vs MiG | — | — | –0.0911* | — | 0.183 | –0.0300 | 0.0613 |
| MiG vs MnG | — | — | 0.0738* | — | 0.970*** | 0.0560 | 0.142** | |
| BEL | MG vs MiG | –0.0937* | 0.154*** | –0.0473 | 0.00688 | 0.0631 | 0.0613 | 0.00567 |
| MiG vs MnG | –0.172*** | 0.263*** | 0.0378 | 0.335*** | 1.092*** | 0.0820 # | 0.262*** | |
| CAN | MG vs MiG | — | — | –0.0840*** | 0.196*** | 0.403*** | 0.0839*** | 0.0206 |
| MiG vs MnG | — | — | 0.0240 | 0.0949* | 0.488*** | 0.110*** | 0.140*** | |
| CYP | MG vs MiG | –0.237*** | 0.347*** | –0.150** | 0.318** | 0.380** | 0.0773 # | 0.0239 |
| MiG vs MnG | –0.0786 | 0.0898 # | 0.0903 # | –0.0406 | 0.0128 | 0.113** | 0.0249 | |
| CZE | MG vs MiG | –0.122* | 0.235*** | –0.0910* | 0.161 | 0.268 | 0.0976* | 0.0672 |
| MiG vs MnG | –0.148** | 0.146** | –0.00378 | 0.307* | 0.656*** | 0.0297 | 0.175** | |
| DNK | MG vs MiG | –0.204*** | 0.273*** | –0.0932*** | 0.0907 | 0.514*** | 0.0170 | 0.0416 |
| MiG vs MnG | –0.0369 | 0.124*** | 0.0842** | 0.122 | 0.694*** | 0.0328 | 0.0254 | |
| EST | MG vs MiG | –0.192*** | 0.209*** | –0.130*** | 0.109 # | 0.355*** | 0.0823** | 0.135*** |
| MiG vs MnG | –0.0993** | 0.113*** | 0.0258 | 0.294*** | 0.540*** | 0.104*** | 0.106*** | |
| FIN | MG vs MiG | –0.363*** | 0.397*** | –0.0738* | 0.353** | 0.627** | 0.0217 | 0.114** |
| MiG vs MnG | –0.0368 | 0.0468 | 0.0429 | 0.103 | 0.439* | 0.0989 # | 0.0842* | |
| FRA | MG vs MiG | –0.278*** | 0.367*** | –0.0740** | 0.208** | 0.471*** | 0.0115 | 0.00697 |
| MiG vs MnG | –0.0764** | 0.124*** | 0.0268 | 0.0579 | 0.895*** | 0.0985** | 0.119*** | |
| DEU | MG vs MiG | –0.271*** | 0.372*** | –0.0871 # | 0.198 # | 0.604** | 0.0540 | 0.0336 |
| MiG vs MnG | 0.0107 | 0.0253 | 0.0677 | 0.146 | 0.529** | 0.0859 | 0.174** | |
| IRL | MG vs MiG | –0.185*** | 0.302*** | –0.131*** | 0.184 # | 0.375* | 0.0657 # | 0.0834* |
| MiG vs MnG | –0.228*** | 0.242*** | 0.0435 | 0.129 | 0.499*** | 0.0369 | 0.103** | |
| ITA | MG vs MiG | –0.280*** | 0.257*** | –0.121* | 0.0397 | 0.266 | 0.0345 | –0.0319 |
| MiG vs MnG | 0.00615 | 0.0768 | 0.0825 | 0.0827 | 0.436 | 0.0759 | 0.170** | |
| JPN | MG vs MiG | –0.164*** | 0.295*** | –0.106*** | –0.001 | 0.104 | –0.00958 | 0.0283 |
| MiG vs MnG | –0.108*** | 0.108*** | –0.00836 | 0.120* | 0.565*** | 0.0618* | 0.161*** | |
| KOR | MG vs MiG | –0.113*** | 0.127*** | –0.169*** | 0.206** | 0.116 | 0.0324 | 0.0344 |
| MiG vs MnG | –0.127*** | 0.189*** | –0.0456 | 0.0428 | 0.367*** | 0.126*** | 0.0714* | |
| NLD | MG vs MiG | –0.297*** | 0.311*** | –0.0636** | 0.327*** | 0.290* | 0.0624 | 0.112** |
| MiG vs MnG | 0.0207 | 0.0991** | 0.0464 # | –0.0204 | 0.867*** | 0.0349 | 0.0684 # | |
| NOR | MG vs MiG | –0.315*** | 0.294*** | –0.0490 # | 0.004 | 0.673*** | 0.0282 | 0.142*** |
| MiG vs MnG | –0.0596 | 0.0795 # | 0.0356 | 0.278** | 0.839*** | 0.0284 | 0.0811 # | |
| POL | MG vs MiG | –0.235*** | 0.290*** | –0.0537 | 0.234* | 0.422** | 0.0991* | 0.0654 |
| MiG vs MnG | –0.153** | 0.172*** | –0.0465 | 0.187* | 0.338* | 0.106* | 0.189*** | |
| SVK | MG vs MiG | –0.0910* | 0.150** | –0.0472 | 0.0166 | 0.256 # | 0.0404 | 0.0125 |
| MiG vs MnG | –0.214*** | 0.244*** | –0.0650 # | 0.400*** | 0.266* | 0.135** | 0.186*** | |
| ESP | MG vs MiG | –0.136*** | 0.252*** | –0.0910** | –0.004 | 0.913*** | 0.105*** | 0.0757 # |
| MiG vs MnG | –0.138*** | 0.162*** | 0.0363 | 0.0885 | 0.0501 | –0.00268 | 0.0106 | |
| SWE | MG vs MiG | –0.340*** | 0.312*** | –0.0784* | 0.196 # | 0.543** | –0.0406 | 0.0165 |
| MiG vs MnG | –0.0414 | 0.101** | 0.0552 # | –0.0171 | 0.615*** | 0.0850* | 0.126** | |
| GBR | MG vs MnG | –0.259*** | 0.343*** | –0.0828* | 0.102 | 0.382** | 0.0963** | 0.0369 |
| MiG vs MnG | –0.0375 | 0.104** | 0.0724* | 0.218** | 0.537*** | 0.122*** | 0.153*** | |
| USA | MG vs MnG | –0.179*** | 0.305*** | –0.128*** | 0.206* | 0.549*** | 0.0216 | 0.0477 |
| MiG vs MnG | –0.149*** | 0.157*** | 0.0385 | 0.409*** | 0.513*** | 0.210*** | 0.145*** |
Notes : Estimation sample of employed adult population in age group 25–65 with at least lower secondary levels of education. Outcomes are: (1) annual earnings in bottom two income quintiles, (2) annual earnings in the top two income quintiles, (3) not satisfied or extremely satisfied with current job, (4) self-assessed health in five categories, (5) sum score over two 4-level Likert items on the general trustworthiness of people, (6) at least some volunteer work in the last 12 months, (7) binary item that distinguishes between respondents who agree to the statement ‘People like me don’t have any say about what the government does’ versus those who disagree. The table displays the estimated marginal effects after either OLS (column 4), probit (columns 1, 2, 3, 6, and 7), or on the linear index after ordered probit (column 4). Estimations including controls (age-groups, cohabitation status, and dependent children dummy, all fully interacted with a gender dummy). Mismatched (underqualified) non-graduates were included in the regressions, but their coefficients are omitted for brevity. #p < 0.1, * p < 0.05, ** p < 0.01, *** p < 0.001.
In every country for which we have pay information, matched graduates have a significantly higher probability of working in high paid jobs ( Table 3 , column 2, MG vs MiG) and a lower risk of working in low paid jobs, as compared with mismatched non-graduates (column 1). The effects are large. In Cyprus, for example, the ‘penalty’ associated with being underemployed is that the probability of being in the top two earnings quintiles is lower by 35 log points (41 per cent). This finding generalizes to all examined countries a common conclusion from previous single-country studies. The penalty turns out to be lowest in Korea and greatest in Finland.
Comparing the earnings of mismatched graduates to those of matched non-graduates (MiG vs MnG), provides a more mixed picture. On the basis of previous literature, there is expected to be a pay advantage for graduates over non-graduates, even in non-graduate jobs. In part, such a difference is attributable to the inevitable within-group skill heterogeneity in a simple graduate/non-graduate dichotomy. 9 The advantage is confirmed for the majority of countries: it mostly does pay to be a graduate, even if you are not in a graduate job. In the US, for example, among those doing non-graduate jobs, graduates’ chances of being in the lowest two earnings quintiles are lower than those of non-graduates by 15 log points (16 per cent). Yet there are exceptions: for graduates in non-graduate jobs in Cyprus, Finland, Germany, and Italy there is no evidence that higher education delivers any pay advantages above secondary or professional tertiary education.
Previous single-country studies have typically found that there is greater job satisfaction among well-matched workers than mismatched workers. We can again confirm this finding for graduates across most of the PIAAC countries: in 17 out of 22 countries, matched graduates report significantly less dissatisfaction with their current job than underemployed graduates. In the remaining countries the differences is either not or only weakly statistically significant. In contrast, differences between graduates and non-graduates within non-graduate jobs are scarce, with the exception that with non-graduate jobs in Austria, Denmark, and the UK there are significantly higher levels of dissatisfaction among underemployed graduates than among non-graduates.
A further private benefit of higher education, though with additional external benefits, is health, which is captured in SAS by a categorical self-assessment of general health (column 4). This indicator of latent health has been shown to predict the onset of morbidities and future health care utilization ( Doiron et al. , 2015 ). 10 Health as a facet of individual productive capacity has been found to affect labour supply and occupational choice and may thus be inversely related with both educational attainment and labour market positing ( Jones et al. , 2010 ; Korpi and Tåhlin, 2009 ). If graduates in poor health sort into (less demanding) non-graduate jobs, we might expect a downward bias on the differences between mismatched graduates and matched non-graduates, while the difference between matched and mismatched graduates would be exaggerated. In general, in most but not every country (exceptions are Denmark, Germany, Ireland, Italy, Spain, and Sweden) we find significant health differences between the types of labour. The differences between mismatched graduates and matched non-graduates are largest in the US, Slovakia, Belgium (Flanders), and the Czech Republic. Health differences between matched and mismatched graduates are largest in Finland, the Netherlands, and Cyprus.
We now extend these analyses of private benefits explicitly to potential external benefits. If higher education has notable external benefits, even for those that are mismatched in employment, the case for the policy of higher education expansion is strengthened.
Looking first at generalized social trust (column 5), we find that mismatched graduates report higher social trust levels than matched non-graduates in 20 out of 22 countries. In Canada, for example, the effect of higher education raises social trust by 0.49, which is 25.5 per cent of the standard deviation. The largest effect is in Belgium, the least in Cyprus. It can be seen also that matched graduates had even higher values of social trust than mismatched graduates in most countries (15 out of 22). However, the social trust gap between matched graduates and mismatched graduates in most of the countries was quantitatively less important than the differences between mismatched graduates and matched non-graduates.
Civic participation measures whether the respondent has worked voluntarily for non-profit organizations in the 12 months preceding the survey. In 12 countries graduates were more likely to volunteer than non-graduates (column 6). In addition, in six countries we find statistically significant differences among graduates by mismatch status (Canada, Czech, Estonia, Poland, Spain, and the UK), with matched graduates more likely to volunteer than mismatched graduates.
Finally, we observe statistically significant advantages for graduates in perceiving high levels of political efficacy in 19 of the 22 countries (column 7). Graduates in France, for example, whether or not they are in a graduate job, are 10 percentage points more likely than matched non-graduates to exhibit a high level of political efficacy. In only five cases, does it make a significant difference to graduates’ political efficacy to be doing a graduate job. In Germany the estimated coefficient is just 3 log points and insignificantly different from zero.
IV. Conclusion: consequences for policy on higher education
While some academic writers have worried about underemployment for some time, in the wake of the 2008 economic crisis the media serving an aspiring middle class now frequently raises concerns about graduate job prospects, and questions the value of going to university. Official concern among policy-makers remains relatively rare or is manifested obliquely in the concern for ‘employability skills’, not least because for most countries policy is oriented towards a continued expansion of university education. The pejorative aspect of the term ‘overeducation’, often used as a synonym for underemployment, no doubt generates potential embarrassment for governments that are committed to a skills-based strategy for economic growth.
Against this backdrop we have in this paper drawn on theory and evidence pertaining to 21 OECD countries (and Cyprus), in an attempt to find evidence-based answers to the broad policy question that animates this paper: should governments worry about underemployment? We find that there is a legitimate concern with underemployment, and do not join with other economists’ or government policy-makers’ sanguine view that it is sufficient to monitor the average rate of return to higher education. We have argued the importance of taking underemployment seriously, treating it as a macroeconomic disequilibrium phenomenon that may be especially prominent in and following an era of mass higher education participation. We have then contributed to the literature by deploying a new skills-based indicator of graduate jobs to study graduate underemployment and its effects consistently across 22 countries, all but one of which have greatly increased their stocks of higher-educated labour in recent years.
There are some potentially serious limitations to these analyses, principally that we have not attempted to address the potential endogeneity of higher education and underemployment status, not least because to do so consistently over such a range of countries raises major practical difficulties. Nevertheless we hold that the estimates, even when not adjusted for endogeneity, can have predictive value and are at least suggestive that a causal influence lies behind them, deriving ultimately from the proposition that a person’s productivity is affected by the job they are in as much as by their own skills, and that graduates have a comparative advantage in graduate jobs. There could also be some remaining skills gaps, not registered by SAS, between matched and underemployed graduates.
The central findings are these.
– The prevalence of graduate underemployment varies substantially between countries. The single factor to account for this variation is the aggregate relative high skills demand—the proportion of graduate jobs relative to graduate labour supply. Beyond that, there is little evidence that the cross-country variation arises from differences in labour market skills matching institutions, or from the relative proficiencies of matched and mismatched graduates. One might agree for other reasons with OECD policy recommendations, that countries’ governments should aim to improve their information, advice, and guidance services, while also invoking policies to raise the skills of the weaker graduates, and improve systems for recognizing foreign qualifications ( Quintini, 2011 a ); however, our evidence does not give much confidence that these could make much of a difference in the aggregate.
– Underemployment matters a lot in every country. There is a downside from devoting time and money to higher education, a risk which is manifested ex post in the reduced chances of earning high pay if one does not obtain a graduate job. The estimated penalty, should this occur, is lowest in South Korea and highest in Finland. Nevertheless, even in non-graduate jobs, in all but two countries there is a positive pay benefit for graduates compared to non-graduates.
– There is also, in almost all countries, a significantly increased risk of being dissatisfied in the job associated with underemployment. If job dissatisfaction is a harbinger of disillusion with higher education, governments would do well to note the potential consequences.
– Last but not least, however, our evidence not only confirms previous studies that have shown social returns to higher education to be greater than private returns, but also finds that higher education delivers external benefits even for those that become underemployed , though in some countries rather less than for those who are matched to graduate jobs.
These findings suggest broad policy directions, rather than specific recommendations surrounding higher education regulation or funding mechanisms. It can be advocated that concerned governments should monitor graduate jobs, and by extension graduate underemployment, to help provide information (as a public good) about higher education. Such information should help to illuminate both the present and the future prospects for the return on higher education investment. Where possible more detailed information can also be provided, surrounding levels and subjects of study.
One focus of concern should be the aggregate imbalance between the stocks of graduates and of graduate jobs. With governments neither willing nor in all probability able to curtail the growth of higher education participation ( Marginson, 2016 ), intervention policies can be targeted also on the demand side of the labour market, through policy approaches that can alter the levels of demand for highly educated workers. If governments were able to progress beyond a now traditional neo-liberal stance, they could include technology and industrial policies as part of the potential armoury of interventions.
If the above is not always feasible, it should be possible for governments also to re-orient the emphases surrounding the purposes of higher education, focusing it towards broader educational objectives, accepting that higher education has considerable value independent of resulting employment prospects. This conclusion questions the central prominence given to employability policies, while recognizing that such policies can be important components of policies for social inclusion. Governments might also re-visit the advisability of their subject-based priorities. Typically the emphasis on STEM subjects (science, technology, engineering and mathematics), for example, has been premised on estimates of private rates of return, coupled with evidence from industry about the importance of scientific innovation. Whether the subjects would differ in the same way in respect of their social rates of return is, however, unclear, there being scarce research to go on. In short, concern about growing underemployment and graduate employment prospects should be counterbalanced by renewed commitment and research about the purposes and non-production benefits of higher education, and a contestation of the widespread tendency to orient education and training narrowly and exclusively to the purposes of employment.
References
— — — (
— (
— (
— (
— (
One widely-used synonym for educational underemployment is ‘overeducation’, though this term is easily misinterpreted as implying excess education in relation to some social optimum. Another synonym is ‘overqualification’. A different type of mismatch, which we shall not pursue here, is that of ‘horizontal mismatch’, where the subject or type of education does not match the job needs. In this paper we refer to educational underemployment as, simply, underemployment. In other papers, underemployment has an alternative interpretation in terms of under-utilizing a worker’s offer of working time.
Fixed effects models in Tsai (2010) and Quintini (2011 b ), using the contested ‘realized matches’ approach to measure required schooling, show the estimated effects of both education and underemployment being reduced by more than half. However, this method works only through job moves which are endogenous, and assumes wages change immediately after job moves, both of which are likely to induce downward bias.
We are grateful to referees for alerting us to these last points.
In an earlier study using a very different measure the range is even greater, from below 10 to more than 40 per cent ( Quintini, 2011 b ).
It is not always possible to distinguish education effects from those of, specifically, higher education.
Problem-solving competences in ‘technology-rich environments’ are also collected, but are not universally available.
In SAS, the UK comprised England and Northern Ireland only, since Wales and Scotland were not sampled.
Each of these three can also be construed as having some private benefit.
We excluded from all these estimates any controls for skill differences between groups, since those differences between graduates and non-graduates are endogenous, being in part attributable to the higher education. Nevertheless, as a robustness check in separate runs we included skills controls. This made little or no difference to the estimates of underemployment penalties but, as expected, lowered somewhat the estimates of the MiG vs MnG gaps.
There are potential measurement errors in the variables, not addressed here, due to shifts in reference points across socio-economic groups and across countries.
Author notes
This work was supported by the ESRC-funded LLAKES Centre for Research on Learning and Life Chances with an additional contribution from the ESRC/UKCES Strategic Partnership (ES/I03792X/1.
