


Abstract
Inequality is a crucial issue in Latin America and the Caribbean, alongside very low productivity gains over the last 60 years and low levels of investment and efficiency. Most literature, especially on the political economy determinants of these problems, has considered these issues individually. This article revisits the discussion on the political economy of redistribution (or lack thereof) in the region, embedding it in a broader political economy debate. We characterize the region and its countries in terms of the size of the public sector, the extent of fiscal redistribution and the efficiency of public action. We summarize various strands of literature that explain elements of the fiscal vector individually and provide a framework that combines elements from several strands, explaining why different countries exhibit different configurations of government size, redistribution and efficiency.
Introduction
Inequality is a crucial issue in Latin America and the Caribbean (LAC). The region’s richest 10% of the population earns 22 times more than the bottom 10%, twice the ratio in developed countries (Busso and Messina 2020). By 2022, 32% of the region’s population lived in poverty, and 13% lived in extreme poverty (ECLAC 2022). The region’s poverty and inequality levels cannot be considered independently of the growth problem it faces. Between 1980 and 2020, the average per capita growth rate of real GDP in Latin America was below the world average. Other regions have narrowed the gap with the per capita income of the USA: the typical country in Emerging Asia increased its income per capita from 11% of US levels in 1960 to 58% in 2017. LAC has not; on average, countries in the region closed only 4 percentage points (p.p.) of the gap, far less than the 47 p.p. achieved by the Emerging Asian countries (Cavallo and Powell 2018). This persistent low growth is particularly problematic because growth tends to have a much larger impact on poverty than redistribution does. For example, from 2009 to 2014, poverty reduction in LAC was estimated at 7.4 p.p., from which 6.2 p.p. were driven by average income growth and only 1.2 p.p. were the result of redistribution (World Bank 2023). These estimates show that growth plays a critical role in how poverty changes and that all the redistribution efforts may be irrelevant if the average income is left unattended in the policymaking process.
However, the region’s growth is hampered by a lack of investment and, as a result, low productivity. Private investment in LAC is lower than in the rest of the world, except for Sub-Saharan Africa. Public investment is also low by international standards. The comparison with Emerging Asia is the most striking, with an investment gap equivalent to 10% of Latin America’s annual GDP between 1980 and 2013, and infrastructure investment reaching only one-half the level of Asia (Cavallo, Powell and Serebrisky 2020).
Thus, Latin American countries today suffer from many challenges, with inequality being crucial but not the only one. When looking into the roots of inequality, it is natural to focus on a political economy with an asymmetric distribution of political power. There is support in the literature confirming that this relationship holds in many cases. Perhaps the most salient line of explanation is the work by Daron Acemoglu, James Robinson and collaborators over the last several decades that argues that economic elites have been able to sustain political privileges since democratization.1 The characterization of the political economy of Latin America as a region where elite domination has led to high and relatively sustained inequality is quite accurate for many countries at many points in history. However, the story is not a good characterization of the political economy of several Latin American countries today, and it does not encompass all the challenges the region faces—in particular, it is not enough to account for poverty levels in the region.
In an often-told story, elite power translates into inequality in market incomes (through both market and public-intervention channels) and insufficient fiscal redistribution to remedy those market outcomes. To introduce some explicit nuances to that story, we focus in this paper on the latter part of the assertion, the ‘fiscal version’ of the canonical story, which goes something like ‘Taxation and fiscal redistribution are too low in the region because of the power of the rich.’ That statement might be true in some countries in the region. Yet, it is not true in others: taxation, public spending and redistribution are indeed relatively high in some Latin American countries.
Figure 1 shows how Latin American countries compare among themselves and with OECD countries in terms of the size of their government, as reflected in total spending. The figure shows the heterogeneity within the region in this regard. There are countries, such as Guatemala and the Dominican Republic, that are the lowest spenders in this international sample. Still, there are also cases, such as Brazil and Argentina, that spend at the average OECD levels. Moreover, several LAC countries spend more than a few OECD countries do (e.g. more than half spend more than Ireland does). Figure 2 further explores such heterogeneity, looking into social spending, which presents a wide dispersion. Clearly, the fiscal reality of Argentina is not the same as that of Guatemala, and neither are their political stories. These facts lead us to believe that a more nuanced story regarding the ability of LAC countries to tax and spend seems to be warranted.

Total spending in LAC and the OECD. Source: Authors’ calculations based on data from the OECD Social Expenditure Database (SOCX) and CEPALSTAT for Latin American countries. Izquierdo, Pessino and Vuletin (2018). Note: for most countries, data correspond to 2015 or 2016 or the most recent year available.
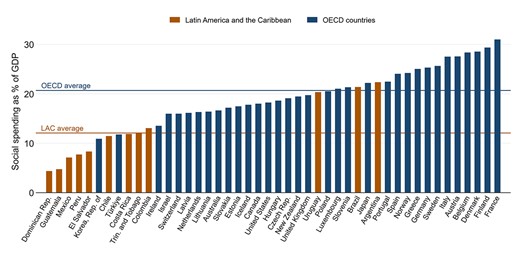
Social spending in LAC and the OECD. Source: Authors’ calculations based on data from the OECD Social Expenditure Database (SOCX) and CEPALSTAT for Latin American countries. Note: data correspond to 2017.
The region varies greatly also in terms of the efficiency of public policies. In a region where collecting revenues does not come easy, governments should combine inputs to maximize the provision of public services at the lowest cost. Redistribution with poor state capacity, inefficient public policies and unstable macroeconomies dampens the long-term impact on poverty reduction. Unfortunately, as shown in Fig. 3, inefficiencies abound in Latin America—and this hinders the productivity, growth and the ability of the region to lift the most vulnerable out of poverty (Scartascini and Tommasi 2010). Figure 3 shows Latin America as a region of low government efficiency and considerable heterogeneity.2

Government efficiency in LAC and the OECD. Source: Authors’ calculations based on the Global Competitiveness Indicators (GCI). Note: Government efficiency is the first principal component of the wastefulness of government spending, burden of government regulation, quality of overall infrastructure and quality of the education system. Data correspond to 2017 for all countries except Bolivia and Guyana, which correspond to 2016. Averages are calculated using 2017 data.
To explain this heterogeneity of experiences, we take a broader view of the political economy of Latin America, moving away from the one syndrome-one outcome paradigm to a multi-syndrome-multi-outcome logic. The main issues in Latin America include various political economy malfunctions and various poor outcomes. Elite capture is not the only political syndrome present in the region; populism is another one.3 As shown, there are, plenty of economic and social maladies present in Latin America beyond inequality, including low investment, poor growth performance and low-quality public policies, as well as serious macroeconomic imbalances.4 The broader argument we push in this paper is that when exploring the political economy of the region, issues of inequality and aggregate economic performance should be looked at in an integrated manner. This paper argues that there are various possible political configurations (including elite domination and populism, among others) and that different political configurations lead to different economic and social outcomes (including the degree of redistribution and others). We postulate that each configuration of social outcomes emerges from different political economy equilibria. Different countries in the region will be in different political economy equilibria and hence will have different combinations of political economy syndromes and socioeconomic outcomes.
This paper advances this logic in two ways: first, we characterize the fiscal vector of different Latin American countries and explore some patterns connecting those fiscal variables to other relevant outcomes. Then, we take some steps toward an integrated political economy of redistribution and efficiency, first reviewing some branches of political economy that attempt to explain some aspects one at a time, and then suggesting a simplified, yet more general, framework (exemplified by one simple model) that might explain different country configurations as outcomes of different political economy equilibria.
Characterizing different country configurations: the fiscal vector
In the context of the issues discussed here and the challenges the region faces, countries can be characterized by (i) how large their governments are (in terms of taxation and spending), (ii) how much they redistribute and (iii) how well they do so. The latter includes issues of macroeconomic sustainability as well as microeconomic effectiveness, relating to the quality and efficiency of public policies, and (more relevant for the distributive concerns of this initiative) the question of whether interventions change the lives of the poor in the long run.5 We loosely group these characteristics under the ‘fiscal vector’ heading. In this section, we characterize Latin American countries along those dimensions from a comparative international perspective and connect those measures to other relevant outcomes.
The two traditional measures of government size are revenue and spending. We use data on general government total revenue as a share of GDP from the World Economic Outlook (WEO) (IMF 2023) to capture size.6
We measure redistribution as the percentage reduction in the Gini index from the market-income distribution (before any government intervention) to the disposable-income distribution (after considering direct taxes and subsidies and contributions to and benefits from the contributory social insurance system), that is, how much direct taxes and subsidies and the contributory pension system reduce inequality from the original income distribution. For countries in LAC and some other developing countries, we rely on the data and methodology from the Commitment to Equity Standard Indicators (CEQ 2023; Lustig 2018, 2022), while data on redistribution in the OECD countries are retrieved from the Income Distribution Database (IDD) (OECD 2023).
Finally, as a proxy for government efficiency, we take the first principal component of four opinion-based indicators from the Global Competitiveness Report of the World Economic Forum: the wastefulness of government spending, the burden of government regulations, the quality of the education system and the quality of the overall infrastructure. Together, these indicators aim to capture some sense of (the perception of) long-term efficiency, as they incorporate how well-executed public spending is, how well-designed regulations are, and how good the quality of the physical and social infrastructure provided by the government is.
The resulting sample of countries can be divided into clusters based on these indicators for government size, redistribution and efficiency. Using the most recent values for each country, we divide countries into halves by their government size and efficiency and into terciles by redistribution. The 12-group partition is presented in panel (a) of Fig. 4, while panels (b) and (c) highlight observations from LAC and the OECD, respectively. These two panels show that LAC countries tend to have low efficiency and a small to medium government size as well as some variation in their level of redistribution, while OECD countries cluster around high efficiency levels, large government and high redistribution.
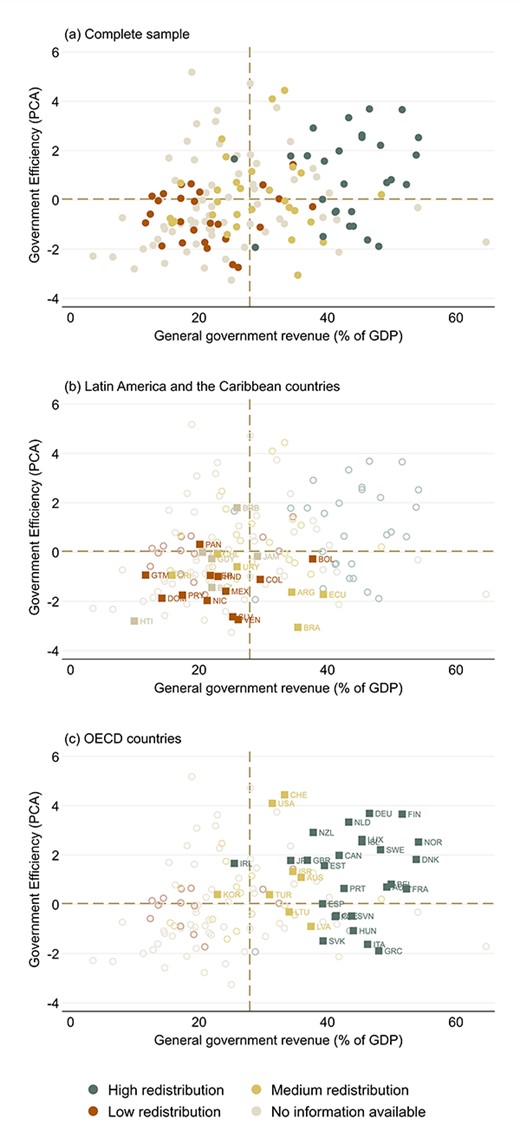
Government size, redistribution and efficiency. Source: Authors’ calculations based on the WEO, the GCI, the CEQ Standard Indicators and the IDD. Note: Government efficiency is the first principal component of the wastefulness of government spending, burden of government regulation, quality of the overall infrastructure and quality of the education system from the GCI. Redistribution is defined as the percentage reduction of the Gini index from market income to disposable income, considering contributory pensions as government spending. Highlighted points are those for which redistribution data are available.
This empirical classification supports the argument that Latin America is a diverse region that suffers from many maladies. Inequality is high, but so are social and general government spending in several countries. The level of redistribution is, on average, higher in the region than in other developing countries. Many countries in the region tax very little, but others tax as much and even more than many developed countries. Government efficiency is particularly low—lower than in other regions of the world. These stylized facts warrant coming up with a broader characterization of political economy equilibria in the region. In the next couple of sections, we take some steps toward building a framework for such an endeavor.
Towards an integrated political economy of redistribution and efficiency. A review of some building blocks
In the previous sections, we saw that different countries present different configurations of fiscal and socioeconomic outcomes. To explain such configurations, we want to integrate various strands of literature that have addressed some of those outcomes in isolation. In this section, we review several such branches of political economy, and in the next section, we hint at a framework for putting some of those pieces together and present one simple model exemplifying the framework.
The political economy of redistribution (or lack thereof)
Explanations of redistribution in modern political economy originated hand in hand with attempts to explain the growth of government. Meltzer and Richard (1981) have become the workhorse model of majority voting over taxes to finance distributive transfers. Redistribution via lump-sum transfers is financed by a proportional income tax on individuals with heterogeneous productivities (and identical preferences over consumption and leisure). Each individual derives an indirect utility function over policy by optimizing their consumption/leisure choice. These preferences are then aggregated into a fiscal policy choice by majority rule. The model assumptions are such that the conditions for a median voter result obtain. The model has several empirical predictions. The poorer the median voter, the larger the predicted size of government and redistribution. The larger the franchise from below, the poorer the median voter becomes; hence, we expect larger governments and more redistribution. This means that the model predicts increased redistribution as countries democratize.
An extensive literature has explored the connections between inequality and redistribution and between democratization and redistribution, and the results are not too supportive of the basic predictions of the Meltzer-Richard model. The evidence seems to suggest that democracies with high inequality tend to redistribute less, not more.7 Similarly, the empirical literature is far from a consensus on the relationship between democracy and redistribution.8 This mixed empirical evidence led to an industry of papers modifying the assumptions of the model in various directions, including multidimensionality and policy influence beyond voting. Iversen and Goplerud (2018) provide an excellent summary of the implications of moving to a multidimensional policy space, the most natural theoretical extension within the context of voting models. They show how issue bundling, issue salience and the distribution of preferences can affect redistribution and discuss the role of political institutions in inducing particular outcomes. Grossman and Helpman (2001) is the standard reference on interest group politics, where political technologies (the means to influence policies) go beyond voting, various pressure groups demand specific distributive policies and redistribution does not necessarily go toward the bottom of the income distribution.
One possible way of summarizing that vast literature, helpful for this paper, is by its sociological emphasis on the collective action (or lack thereof) of the main sociological classes: the poor, the middle class and the rich.
Many important works have explored why the poor do not demand and obtain more redistribution. Different explanations highlight issues of information, preferences, lack of cohesion, endogenous turnout (Mahler et al. 2014; Chong and Olivera 2008), expectations of future mobility (Benabou and Ok 2001) and the presence of other dimensions—such as race or religion—that sidetrack the poor from redistributive concerns (Alesina and Glaeser 2004; Austen-Smith and Wallerstein 2006; Scheve and Stasavage 2006; De la O and Rodden 2008 ). Some of these factors are potentiated by characteristics of de jure political institutions such as electoral systems (Iversen and Soskice 2006) or federal arrangements (Dixit and Londregan 1998; Díaz-Cayeros 2016; Dunn 2022).
Other important avenues of thought have examined the role of the middle class in the ‘low-taxation, low-redistribution equilibrium.’ De la O et al. (2023) underscore one aspect of such a role, the ‘exit’ toward the private provision of public services such as education or security. More generally, the middle class could form political coalitions with either the poor or the rich. Which coalition is more likely to form depends on the structure of inequality (how close the middle class is to the poor; Lupu and Pontusson 2011) and on the formal rules of the political game (Iversen and Soskice 2006). A coalition of the middle class and the poor will support high taxation and broad-based redistribution. A coalition with the rich will support low taxation and redistributive programs that benefit the middle class, such as some public utility subsidies, pensions and free university education (Ferreira et al. 2012).9
The set of variations from median-voter models that is more related to the arguments we discuss in this paper (and the one implicit in the LACIR initiative) is one that focuses on the power of the rich or ‘elite power.’ This family of arguments has many related variants. One emphasizes the power of ‘business’ and puts the light on two forms of power: structural power and instrumental power, the first related to the power exercised through economic actions and the latter through political actions.10
A more historical branch of the political economy of the power of the rich has emphasized the power of ‘elites.’ The monumental work of Acemoglu and Robinson (2005) on democratization has the Meltzer-Richard framework as its workhorse model of democratic politics. As we know, that set-up predicts relatively high redistribution after democratization. But another crucial building block in Acemoglu and Robinson’s theory of democratization consists, precisely, of exploring various mechanisms by which the rich can invest in de facto political power in a democracy. In that enlarged median-voter model, the distributive effects of democratization might be quite meager. ‘Latin America’ seems to fit that mold. The argument is formalized in Acemoglu and Robinson (2008), which attempts to explain why important democratizing changes in formal political institutions did not always lead to much change in the inequality of socioeconomic outcomes. According to them, a change in political institutions alters the distribution of de jure political power but creates incentives for investments in de facto political power to offset the change in de jure power. Their model can imply a pattern of captured democracy whereby a democratic regime may survive but choose economic institutions favoring an elite. This may come about through the investments made by the elite in building de facto political power and through some details of the new democratic institutions that tilt the scale in favor of the powerful.11
The political economy of redistribution and growth
Kuznets (1955) advanced the very influential hypothesis that as an economy develops, market and demographic forces first increase and then decrease economic inequality. The inverse U-shaped Kuznets curve appeared consistent with experience at the time. However, as inequality has risen in the USA and other developed countries, a new wave of research has argued that there is no automatic decrease in inequality at the mature stage of economic development, with Piketty’s (2014) Capital in the 21st Century being its most salient exponent. On the other hand, an important literature has looked into the impact of inequality on growth, with a negative association being the predominant, but not exclusive, finding (Berg et al. 2018). Among the channels connecting inequality to lower growth, an influential early literature emphasizes credit constraints and political economy issues. Regarding the latter, some argue that inequality breeds political instability, which, in turn, lowers investment and growth (Alesina and Perotti 1996; Rodrik 1999; Keefer and Knack 2002), while others emphasize democratic voting mechanisms by which greater inequality leads to more redistribution, lower investment and lower growth (Alesina and Rodrik 1994; Persson and Tabellini 1994; Benabou 1996; Perotti 1996).
Regarding this latter political economy of redistribution and growth, the basic logic is that (i) higher inequality leads to higher redistributive taxation (à la Meltzer-Richards) and (ii) this, in turn, has adverse effects on economic growth. Both parts of this logic merit closer attention. As discussed in the previous section, there are various reasons why the path from inequality to redistribution can be offset. Also, several arguments suggest that more redistribution is not necessarily bad for growth (Saint-Paul and Verdier 1996; Bourguignon 2000). To think about the connection between redistribution and growth, it is useful to decompose the former into taxation and spending. On the taxation side, we concur with Berg et al. (2018), who, after a thorough review and analysis, conclude that ‘it seems hard to improve on the conclusions of Tanzi and Zee (1997), who find some general indication that the relationship between growth and the level of total taxes is negative.’ Things are more interesting on the spending side, where various authors have argued for channels through which public spending can increase growth. A long and diverse literature could be summarized by saying that some items of spending (such as public investment, public education and improving financial markets) tend to have a better growth impact than others (such as transfers) and that this impact varies across countries and time in a way that some authors have associated with state capabilities and the quality of institutions (see, for instance, Afonso et al. 2005).
The political economy of (in)efficiency
The last assertion leads us to another relevant literature that has focused on understanding the reasons why government intervention, including redistribution, often takes inefficient forms. Table 1 summarizes a selection of the contributions attempting to explain inefficient (redistribution) policies as equilibrium outcomes of the political process.
Models of inefficient public policies
| Underlying distortion | Paper or book | Political agency is crucial |
|---|---|---|
| Time inconsistency | Acemoglu (2003) | Yes |
| Acemoglu and Robinson (2001) | ||
| Dixit and Londregan (1995) | Yes | |
| Dixit (1998) | Yes | |
| Robinson and Verdier (2013) | Yes | |
| Imperfect information | Coate and Morris (1995) | Yes |
| Non-cooperation in repeated game | Alesina (1988) | |
| Spiller and Tommasi (2007) | ||
| Lack of institutionalization | Scartascini and Tommasi (2012) | |
| Caruso et al. (2015) | ||
| Inefficiency policies today affect the political game tomorrow | Becker and Mulligan (2003) | |
| Drazen and Limão (2008) | Yes | |
| Besley and Coate (1998) | Yes | |
| Populism14 | Acemoglu, Egorov and Sonin (2013a) | Yes |
| Acemoglu, Robinson and Torvik (2013b) | Yes | |
| Keefer, Scartascini and Vlaicu (2021) | Yes | |
| Rodrik (2018) |
This rich literature offers several motives for why inefficiency frequently comes hand in hand with redistribution. The analytical structure often utilized to embed such microfoundations is that of dynamic games of incomplete information. These are games among contending political parties or societal groups or between officeholders and societal groups, often with the voters as third players. The last column highlights the cases in which political agency issues, a topic we address below, are crucial.
The issue of imperfect voter information is highlighted in many important works, such as Coate and Morris (1995). In their model, citizens face incomplete information both on the effects of policies and on the type of the politician in office, and this leads politicians to implement inefficient but less observable transfers to special interests.12
An even larger strand of literature has focused on the dynamic structure of interactions as the microfoundation of inefficient public policies in general and inefficient redistributive policies in particular. In terms of a two-period game, some authors have emphasized the strategic effect of period-one actions on the conditions of the second-period game, while others have highlighted the anticipation effect of expected second-period equilibrium actions on first-period choices.13
The political economy of intertemporal cooperation
Several authors have argued that inefficient policies emerge due to time-consistency problems in dynamic games. According to Acemoglu (2003), ‘parties holding political power cannot make commitments to bind their future actions because there is no outside agency with the coercive capacity to enforce such arrangements’, and according to Acemoglu and Robinson (2001), ‘when political institutions cannot commit to future policy … inefficient redistribution is a tool to sustain political power.’
In those arguments, the possibility of committing to more efficient actions through repeated-game enforcement is not considered. If we add such considerations (as in Alesina 1988 or Spiller and Tommasi 2007), the efficiency or inefficiency of redistributive policies will depend on the degree of intertemporal cooperation in each country’s political equilibrium.
This logic has been the foundation of several works (IADB 2005; Stein et al. 2008; Scartascini and Tommasi 2012; Caruso et al. 2015), arguing that various characteristics of political systems (including notably the degree of institutionalization of policymaking processes) can lead to more or less cooperative policymaking styles and, hence, to more or less efficient public policies.
The political economy of agency
The positive growth effects of public intervention are conditional on state capacities and how well and efficiently these policies are designed and implemented. It is conventional wisdom by now that for public policies to deliver the desired outcomes, good governance is required. Thinking about these issues requires introducing a representative democracy logic in which decisions are taken by politicians and implemented by public employees with their own motivations.
Politicians in power claim that they have a general mandate from the population to search for the policies that are in the national interest, but they have their own agendas. The study of the principal-agent problem in politics has a long pedigree.15 The main instrument citizens have for controlling their elected representatives is the vote, a fairly blunt instrument. The election contract is a fundamentally incomplete agreement, allowing politicians much space to maneuver. Given such opaque contracts, politicians tend to amass considerable resources to allow them to operate freely, and they try to maximize the resources to conduct their business. These resources are used to remunerate favors to the people who helped them win elections, as well as to finance propaganda and clientelism to convince the principal about their suitability as political agents. Oftentimes, the rent-seeking ambitions of political agents lead them to engage in activities such as patronage, embezzlement and corruption.
A good part of the literature on the political economy of inefficiency, summarized in Table 1, has agency issues at the core of the political distortions leading to inefficient public policies. Acemoglu (2003) argues that inefficient institutions and policies are chosen because they serve the interests of politicians in power. Dixit’s (1998) transaction-cost politics approach emphasizes the low power of incentives in policymaking and the multi-principal agency nature of politics, which makes public policymaking a difficult realm for the control of agents, leading to inefficiencies. Besley and Coate (1998) explore the sources of inefficiency in a representative democracy. Coate and Morris (1995) argue that lack of information on the part of the voters leads politicians to favor inefficient ‘sneaky’ redistribution methods. In Robinson and Verdier (2013), inefficient redistribution by politicians becomes attractive in situations of high inequality and low productivity. According to Drazen and Limão (2008), it is the government, and not social actors, that prefers inefficient policies. Acemoglu, Egorov and Sonin (2013a) explore the connection between agency problems, polarization and populist biases, arguing that the latter is greater when politicians have a greater valuation of remaining in office and when politicians are more corrupt.16 Acemoglu, Robinson and Torvik (2013b) argue that voters dismantle checks and balances that could prevent abuses of power and rents in return for redistribution.17 Keefer et al. (2021) emphasize that low trust among citizens prevents the collective action necessary to control political agents. This might lead to low-quality governments and populist politicians who advocate ultimately disastrous policies.
Towards an integrated political economy of redistribution and efficiency: sketch of A framework and A simple model
Our objective is to suggest a framework in which different country situations (fiscal vector, economic performance) could be characterized as political economy equilibria. Each of these configurations could be associated with some of the different predominant syndromes of Latin American polities (elite domination, corruption, populism). In the previous section, we reviewed a number of theoretical angles addressing some of those issues, mostly ‘one at a time’. In this section, we suggest an agenda to integrate some relevant aspects of these various strands to characterize country configurations of the variables of interest. The framework we are suggesting should incorporate the following features.
There are elements of conflict, but there is also commonality of interests among different social actors. In any polity, there are many divisive issues, such as the distribution and redistribution of income, but there are also valence dimensions: a common interest in things such as larger output, economic efficiency, effective public services and a healthy macroeconomy.
Social actors do not decide and implement policies by themselves, but they do so through elected representatives.
There are formal institutions (federal arrangements, electoral rules, legislative and judicial procedures) that regulate the access to and the exercise of (de jure) political power.
Social groups have de facto political power in addition to their de jure political power.
Elected representatives are not perfect agents of their constituents. There are political agency issues relating to outcomes such as corruption, patronage, clientelism and other distortions connected to state inefficiencies and waste.
The political game takes place over time. Repeated interactions open the possibility of cooperation among different social and political actors.
We present a model that captures some of these features in an extremely simplified manner.
The set-up
There are two social groups, the rich |$\boldsymbol{R}$| and the poor |$\boldsymbol{P}$|. The rich decide on investment, and investment determines output. Investment |$\boldsymbol{I}$| takes values |$\mathbf{1}$| (invest) or |$\mathbf{0}$| (do not invest). Investing has a cost |$\boldsymbol{c}$|. Output |$\boldsymbol{y}$| equals |$\mathbf{1}$| without investment and |$\mathbf{1}+\boldsymbol{\gamma}$| with investment.
After this economic decision, policy decisions are made in a political system with two parties, representing the rich (|$\boldsymbol{PR}$|) and the poor (|$\boldsymbol{PP}$|). In each period, |$\boldsymbol{PR}$| is in power with probability |$\boldsymbol{p}$| and |$\boldsymbol{PP}$| is in power with probability |$\left(\mathbf{1}-\boldsymbol{p}\right)$|.18 Parties solve the collective action of each social group, but they do so at a political agency cost. The party in power gets to decide a policy |$\boldsymbol{s}$| of tax and redistribution, where |$\boldsymbol{s}$| will be the share of output (net of graft) going to the poor and |$\left(\mathbf{1}-\boldsymbol{s}\right)$| the share going to the rich, along with its own output appropriation (graft) |$\boldsymbol{r}$|.
Let |$\boldsymbol{\mu} =\boldsymbol{R},\boldsymbol{P}$| be the random variable that allocates power in each period, with |$\boldsymbol{p}= Prob\left(\boldsymbol{\mu} =\boldsymbol{R}\right)$| being the probability that the party of the rich is in power. Let |${\boldsymbol{s}}_{\boldsymbol{\mu}}$| be the policy decided by party |$\boldsymbol{P}\boldsymbol{\mu }$|, and |${\boldsymbol{r}}_{\boldsymbol{\mu}}$| be the share of output appropriated by party |$\boldsymbol{P}\boldsymbol{\mu }$|. Let |$\boldsymbol{j}=\boldsymbol{R},\boldsymbol{P},\boldsymbol{P}\boldsymbol{R},\boldsymbol{P}\boldsymbol{P}$| represent the four players of the game. Let |${\boldsymbol{x}}_{\boldsymbol{j}}$| be the consumption of player j, that is, the share of output going to player j. In each period, payoffs of the respective players are |${\boldsymbol{u}}_{\boldsymbol{P}}=\sqrt{{\boldsymbol{x}}_{\boldsymbol{P}}}$|, |${\boldsymbol{u}}_{\boldsymbol{R}}=\sqrt{{\boldsymbol{x}}_{\boldsymbol{R}}}-\boldsymbol{c}\left(\boldsymbol{I}\right)$|, |${\boldsymbol{u}}_{\boldsymbol{P}\boldsymbol{P}}=\boldsymbol{\omega} {\boldsymbol{r}}_{\boldsymbol{P}}+{\boldsymbol{u}}_{\boldsymbol{P}}$| and |${\boldsymbol{u}}_{\boldsymbol{PR}}=\boldsymbol{\omega} {\boldsymbol{r}}_{\boldsymbol{R}}+{\boldsymbol{u}}_{\boldsymbol{R}}$|, where |$\boldsymbol{\omega}$| captures the political agency distortion. Let |${\boldsymbol{\beta}}_{\boldsymbol{j}}\in \left[\mathbf{0},\mathbf{1}\right]$| be the discount factor of player |$\boldsymbol{j}$| in the repeated game.
The sequence of play within each period is the following:
The rich decide on investment |$\boldsymbol{I}\in \left\{\mathbf{0},\mathbf{1}\right\}$| and pay cost |$\boldsymbol{c}\left(\boldsymbol{I}\right)\in \left\{\mathbf{0},\boldsymbol{c}\right\}$|. (Strategic moment |${\boldsymbol{\lambda}}_{\mathbf{1}}$|). Technology determines output |$ \boldsymbol{y}\left(\boldsymbol{I}\right). $|
Nature determines the distribution of political power μ, where
Social group μ instructs Pμ on s; that is, they tell their party what distribution of output among the social groups they want at that moment (Strategic moment |${\boldsymbol{\lambda}}_{\mathbf{2}}$|).
The political party in power Pμ decides and implements the policy vector |$\left(\boldsymbol{s},\boldsymbol{r}\right)$|, that is, the level of taxation and redistribution |$\boldsymbol{s}$| and the party’s own take |$\boldsymbol{r}$| (Strategic moment |${\boldsymbol{\lambda}}_{\mathbf{3}}$|).
In this version of the model, we treat the politicians/political parties as myopic maximizers of their one-period payoffs (|${\boldsymbol{\beta}}_{\boldsymbol{PR}}={\boldsymbol{\beta}}_{\boldsymbol{PP}}=\mathbf{0}$|), leaving the rich and the poor as the only long-horizon strategic players in the repeated game, with a common discount factor |$\boldsymbol{\beta}$|. Total output |$\boldsymbol{y}$| in each period will depend on the investment decision by the rich (‘the economy’) and will be distributed among the four players by policy choices (‘the polity’).
with |${\boldsymbol{x}}_{\boldsymbol{P}}=\left(\mathbf{1}-\boldsymbol{r}\right)\boldsymbol{sy}$|, |${\boldsymbol{x}}_{\boldsymbol{R}}=\left(\mathbf{1}-\boldsymbol{r}\right)\left(\mathbf{1}-\boldsymbol{s}\right)\boldsymbol{y}$|, |${\boldsymbol{x}}_{\boldsymbol{P}\boldsymbol{P}}\in \left\{\mathbf{0},{\boldsymbol{r}}_{\boldsymbol{P}}\boldsymbol{y}\right\}$| and |${\boldsymbol{x}}_{\boldsymbol{PR}}\in \left\{\mathbf{0},{\boldsymbol{r}}_{\boldsymbol{R}}\boldsymbol{y}\right\}$|. Notice that the rents received by the party out of power will always be |$\mathbf{0}$| in this formulation.
Analysis of equilibria: the one-shot game
Before exploring the solution to the intertemporal game, we solve the one-shot game, which will be a relevant node in the broader game. It is easy to see that in the one-shot game |${\boldsymbol{s}}_{\boldsymbol{i}}\in \left\{\mathbf{0},\mathbf{1}\right\}$|; that is, the social group that controls the polity will, at |${\boldsymbol{\lambda}}_{\mathbf{3}}$|, appropriate all the output, except for its party’s take |$\boldsymbol{r}$|. In other words, when the party of the rich is in power, there is no redistribution, and when the party of the poor is in power, redistribution is maximal.19 Given that choice, the political party in power Pμ decides its own take |${\boldsymbol{r}}_{\boldsymbol{P}\boldsymbol{\mu }}$| by maximizing |$\boldsymbol{\omega} {\boldsymbol{r}}_{\boldsymbol{P}\boldsymbol{\mu }}+{\boldsymbol{u}}_{\boldsymbol{\mu}}\left({\boldsymbol{s}}_{\boldsymbol{\mu}},{\boldsymbol{r}}_{\boldsymbol{P}\boldsymbol{\mu }},\boldsymbol{I}\right)$|, where |${\boldsymbol{s}}_{\boldsymbol{\mu}}$| is the value of s chosen by social group |$\boldsymbol{\mu}$| using the previous logic. It is easy to show, then, that the rents extracted by either party are [|$\mathbf{1}-\frac{\mathbf{1}}{\mathbf{4}{\boldsymbol{\omega}}^{\mathbf{2}}}$|] when there is no investment, and [|$\mathbf{1}-\frac{\mathbf{1}}{\mathbf{4}{\boldsymbol{\omega}}^{\mathbf{2}}}$|](|$\mathbf{1}+\boldsymbol{\gamma}$|) when there is investment.
Knowing how |$\boldsymbol{r}$| and |$\boldsymbol{s}$| are chosen, the rich will decide to invest if and only if their expected value of consumption under investment is greater than or equal to their expected value of consumption under no investment. This leads to the following condition for investment:
The probability of investment is increasing in the power of the rich and in the productivity of investment, and it is decreasing in the cost of investment and in the propensity to corruption of politicians.
Section A.1 in the Online Appendix shows the following result:
Result 1: there is a unique subgame-perfect equilibrium (SPE) to the one-shot game, in which there is investment if and only if |$\boldsymbol{p}\boldsymbol{\gamma } \ge \mathbf{2}\boldsymbol{c}\boldsymbol{\omega}$|; the party in power gets rents |$\left[\mathbf{1}-\frac{\mathbf{1}}{\mathbf{4}{\boldsymbol{\omega}}^{\mathbf{2}}}\right]\boldsymbol{y}$|, the social group whose party is in power receives |$\raisebox{1ex}{\boldsymbol{y}}\!\left/ \!\raisebox{-1ex}{\mathbf{4}{\boldsymbol{\omega}}^{\mathbf{2}}}\right.$|, and those out of power get |$\mathbf{0}$|, with |$\boldsymbol{y}=\mathbf{1}\kern0.5em$|when |$\boldsymbol{I}=\mathbf{0}$| and |$\boldsymbol{y}=\mathbf{1}+\boldsymbol{\gamma}$| when |$\boldsymbol{I}=\mathbf{1}$|. This unique SPE is also the unique Nash equilibrium to the one-period game.
Analysis of equilibria: the infinitely repeated game
We proceed now to analyze the infinitely repeated game that has the game explored above as its stage game. Under our assumptions regarding the |$\boldsymbol{\beta}$|s, the party in power will maximize |${\boldsymbol{u}}_{\boldsymbol{P}\boldsymbol{\mu }}=\boldsymbol{\omega} {\boldsymbol{r}}_{\boldsymbol{\mu}}+{\boldsymbol{u}}_{\boldsymbol{\mu}}$| in any period, while social groups |$\boldsymbol{R}$| and |$\boldsymbol{P}$| will maximize |$\sum_{\boldsymbol{t}=\mathbf{0}}^{\infty }{\boldsymbol{\beta}}^{\boldsymbol{t}}{\boldsymbol{Eu}}_{\boldsymbol{it}}\left(\boldsymbol{s},\boldsymbol{r},\boldsymbol{I}\right)$|.
Infinitely repeated games do have many equilibria. We follow the applied tradition of focusing on two equilibria, capturing the minimum and maximum level of cooperation in the repeated game. We call them the non-cooperative equilibrium (NCE) and the cooperative equilibrium (CE), respectively.
Applying the well-known result that infinite repetition of the unique Nash equilibrium to the stage game is an equilibrium to the infinitely repeated game for all parameter values (Fudenberg and Tirole 1991), we know the following:
Result 2 (NCE): the choices shown in Result 1, played at every node a player is called to play, constitute an SPE to the infinitely repeated game for all parameter values.
To explore the enforcement of cooperation through repeated play, we focus on equilibria in grim-trigger strategies. We postulate the following grim-trigger strategies. For all t, the rich will choose investment |$\boldsymbol{I}=\mathbf{1}$|, and any party in power will choose |${\boldsymbol{s}}^{\ast}\in \left(\mathbf{0},\mathbf{1}\right)$|, but all players will revert to NCE behavior forever if there is any deviation.20
We have to consider whether the postulated strategies constitute an equilibrium under each of the two parameter situations determining whether investment takes place in the cooperative equilibrium, condition (1). In each of the two cases and for each of the two intertemporal players, we explore under what conditions playing the postulated cooperative strategy dominates going for a deviation that maximizes short-term payoffs. This analysis leads to conditions on the set of parameters for such inequalities to be satisfied and to the following result, proven in the Online Appendix.
Result 3: (CE)
For |$\boldsymbol{p}\boldsymbol{\gamma } <\mathbf{2}\boldsymbol{c}\boldsymbol{\omega}$|, the grim-trigger strategies postulated constitute an SPE as long as |$\mathbf{1}-\mathbf{2}{\left[\mathbf{1}-\boldsymbol{\beta} \left(\mathbf{1}-\frac{\mathbf{2}\boldsymbol{\omega } \boldsymbol{c}+\boldsymbol{p}}{\mathbf{1}+\boldsymbol{\gamma}}\right)\right]}^{\mathbf{2}}\ge \mathbf{2}{\left[\mathbf{1}-\boldsymbol{\beta} \left(\mathbf{1}-\frac{\mathbf{1}-\boldsymbol{p}}{\mathbf{1}+\boldsymbol{\gamma}}\right)\right]}^{\mathbf{2}}$|.
For |$\boldsymbol{p}\boldsymbol{\gamma } \ge \mathbf{2}\boldsymbol{c}\boldsymbol{\omega}$|, the grim-trigger strategies postulated constitute an SPE as long as |$\mathbf{1}-\mathbf{2}{\left(\mathbf{1}-\boldsymbol{\beta} +\boldsymbol{\beta} \boldsymbol{p}\right)}^{\mathbf{2}}\ge \mathbf{2}{\left(\mathbf{1}-\boldsymbol{\beta} \boldsymbol{p}\right)}^{\mathbf{2}}$|.
Comparative statics
In general, it is not easy to derive comparative statics in situations with multiple equilibria. Comparative statics within a given equilibrium are straightforward. It turns out that the simple structure of our model allows us to make comparisons across our two equilibria. Given that the NCE exists for all parameter values and the CE only under some, the parameter space can be partitioned into two parts: an area where only the NCE exists and an area where both equilibria exist. If conducting comparative statics on any given parameter increases the set of other parameters for which the CE is an equilibrium, then we will say that increasing that parameter increases the possibility of observing the CE and its associated outcomes. In the specific context of our model, it turns out that ‘the probability of cooperation’ can be characterized by the size of the segment |$\left[\overline{{\boldsymbol{s}}_{\boldsymbol{R}}},\underset{\_}{{\boldsymbol{s}}_{\boldsymbol{P}}}\right]$|, where |$\overline{{\boldsymbol{s}}_{\boldsymbol{R}}}$| is the maximum share the rich are willing to give to the poor and |$\underset{\_}{{\boldsymbol{s}}_{\boldsymbol{P}}}$| is the minimum share that the poor are willing to accept in the CE.
Using this logic, we can then proceed to do comparative statics on both the probability of being in a CE and on relevant endogenous variables within each of the two equilibria being considered. It turns out that the particular structure of our model leads to some monotonicity in the comparative statics, in the sense that all dependent variables have a monotonic relation to all parameters, counting both within and across equilibria.
Table 2 summarizes these comparative static results. The probability of cooperation is decreasing in the cost of investment and in the political agency distortion, it is increasing in productivity and in patience, and it is first increasing and then decreasing with respect to the probability of the rich being in power.21 Investment is decreasing in the cost of investment and in the political agency distortion, and it is increasing in productivity, patience and in power of the rich. Redistribution (consumption of the poor) is decreasing in the cost of investment, the power of the rich and corruption tendencies, and non-decreasing in patience and in productivity.22
Comparative statics
| |$\overline{{\boldsymbol{s}}_{\boldsymbol{R}}}$| | |$\underset{\_}{{\boldsymbol{s}}_{\boldsymbol{P}}}$| | Prob. of cooperation |$\overline{{\boldsymbol{s}}_{\boldsymbol{R}}}-{\overline{\boldsymbol{s}}}_{\boldsymbol{P}}$| | Investment I | Redistribution |$\boldsymbol{E}\left(\boldsymbol{s}\right)$| | ||
|---|---|---|---|---|---|---|
| THE ECONOMY | Cost of investment |$\boldsymbol{c}$| | ↓ | = | ↓ | ↓ | ↓ |
| Productivity |$\boldsymbol{\gamma}$| | ↑ | ↓ | ↑ | ↑ | =↑ | |
| Patience β | ↑ | ↓ | ↑ | ↑ | =↑ | |
| POLITICAL SYSTEM | Power of the rich p | ↑ | ↓ | ↗↘ | ↑ | ↓ |
| |$\mathbf{Polit}.\mathbf{agency}\ \mathbf{distortion}$| |$\boldsymbol{\omega}$| | ↓ | = | ↓ | ↓ | ↓ |
Note: ↑ stands for non-decreasing and ↓ stands for non-increasing.
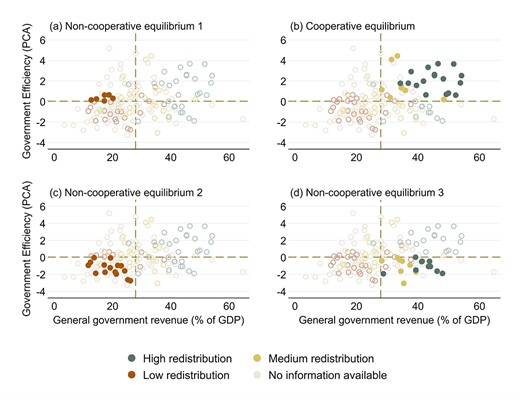
Table 3 takes us one step further in connecting the implications of the model to the objective of the paper of studying redistribution and efficiency within a unified framework. Focusing on the—reduced form—parameters of the political system, it shows the level of investment and of redistribution for various combination of |$\boldsymbol{p}$| (distribution of power) and |$\boldsymbol{\omega}$| (extent to which political agency problems are under control). The first row represents those cases considered in the canonical Latin American case of elite domination and low redistribution. The level of investment (and hence economic performance) will depend on whether the party or state representing the rich is corrupt (non-cooperative configuration 2) or not (non-cooperative configuration 1). In the latter case, we will observe high investment and low redistribution; in the former, we will have low investment and low redistribution. The situation in which there is alternation (or balance) of power and politicians are not corrupt is the one in which the CE with good economic performance and reasonable redistribution is more likely. The bottom right corner of the table represents a situation in which a corrupt party representing mainly the poor tends to dominate the political system. Such a case, resembling left-wing populism in Latin America, will generate high taxes and redistribution but poor economic performance and (in a slightly broader interpretation) inefficient policies.
Political economy equilibria as a function of characteristics of the political system
| Parties as agents of constituency | ||
|---|---|---|
| Distribution of power | Good | Bad |
| Very powerful rich | Non-coop. equilibrium 1 {high investment, low redistribution} | Non-coop. equilibrium 2 {low investment, low redistribution} |
| Balance or alternation | Cooperative equilibrium {high investment, reasonable redistribution} | |
| Dominant ‘left’ party | Non-coop. equilibrium 3 {low investment, high redistribution} | |
To suggest that the logic proposed here is a good first step to explain the empirical patterns described earlier, Fig. 5 fills in Fig. 4, showing that non-cooperative configuration 1 corresponds to the north-west quadrant, including countries such as Chile, a country of good economic performance and low amounts of redistribution; NCE 2 corresponds to the south-west quadrant, including countries such as Guatemala, a country of poor economic performance, a small and inefficient state, with little social spending and redistribution; and NCE 3 corresponds to the south-east quadrant, including countries such as Argentina, a country of poor economic performance, a large and inefficient state, with abundant social spending and redistribution. The CE corresponds to the north-east quadrant of Figs 5 and 4, representing the typical Northern European society characterized by a large and efficient state, high productivity and a reasonably redistributive welfare state. Unfortunately, none of the Latin American cases at this point seems to fit that case.
Set of political economy equilibria. Source: as in Fig. 4.
Concluding remarks
We have revisited the discussion on the political economy of redistribution in LAC and attempted to embed it in a broader debate, including other aspects of the region’s political economy. We characterized the region and its different countries regarding the size of the public sector, the amount of fiscal redistribution and the efficiency of public action. We summarized various strands of literature that attempt to explain some elements of that fiscal vector one at a time. Then, combining elements of some of these strands, we provided a simple framework that might explain why different countries present different configurations of size, distributiveness and efficiency. This step forward in the discussion of the political economy of the region needs to be complemented on both the empirical and the theoretical fronts.
In terms of the characterization of the fiscal vector, while measuring size is relatively straightforward, the other two concepts are much more multifaceted and harder to grasp conceptually and in terms of data availability. Regarding the redistribution data, the CEQ methodology provides the most comprehensive cross-country-comparable analysis of how a country’s taxes and social spending affect its income inequality and poverty. The problem is that CEQ assessments have only been produced for some countries for some years, and other data sets with wider coverage do not have their granularity and thoroughness. We have juggled between quality/completeness of the analysis and coverage. We chose an intermediate path that left us with a particular set of countries and years and with a concept of redistribution that tends to underestimate the degree of redistribution in developing, lower-redistribution countries, which tend to do more through in-kind spending and less through direct taxes and transfers. While waiting for more CEQ assessments, future analyses should explore alternative ways of dealing with those methodological trade-offs.
There are even more difficulties regarding the efficiency data, where no equivalent of CEQ efforts of such depth and amplitude are available. The lack of harmonized objective measures led us to prioritize subjective over objective proxies with limited country-year coverage. On the one hand, extending the country-year coverage of useful efforts such as IADB (2005) or Izquierdo et al. (2018) would be valuable. On the other, focusing on the inequality and poverty concerns of the LACIR initiative, it would be crucial to develop adequate metrics of the intertemporal incidence (the long-term impact on poverty reduction) of public interventions. Doing that presents important methodological and data challenges.23 The most comprehensive analysis of that sort for one country is provided by Hendren and Sprung-Keyser (2020), who use the marginal value of public funds and build from evidence on policies’ impacts and costs available for the 133 main social policy changes in the US history. Finding a shortcut to move in that direction within the current international availability of data and previous impact and cost-benefit analyses would be crucial.24
The model summarized in the previous section provides an initial step regarding the framework we suggest. That simple model provides a prototype, which could be extended to address several of the issues we want to discuss in this agenda.
In the simple model presented, the political rules of the game are characterized very starkly by just two parameters: the probability of the representatives of each group being in power and the degree of agency distortion. Our model takes the alternation and degree of agency problem as exogenous factors to define the efficiency-redistribution political equilibrium. We could treat these factors as endogenous and propose new exogenous ones. We need to open that black box by modeling some explicit political decision-making procedures that could be related to more realistic de jure institutions such as forms of government, electoral systems, legislative rules, characteristics of party systems and the like. Also, we might explore some asymmetric microfoundations of the collective action and agency control problems of the rich and the poor.25
Another natural set of extensions would be moving from the comparative statics analysis of countries in different equilibria to the comparative dynamics of countries that seem to be moving toward different equilibria. For instance, are Latin American and Caribbean countries condemned to jump from exclusionary to populist polities? How can we attempt to build more inclusionary yet more efficient states?
Regarding policy implications, the framework we propose in this article indicates that one-size-fits-all policy recommendations are not the solution. We can think of potential policy implications of our discussion at two levels. First, in terms of ‘first-best’ policy recommendations as economists, we believe that the logic of fiscal vectors is a very useful diagnostic tool.26 Depending on the configuration of government size, redistributiveness and efficiency, we can provide country-specific recommendations. For instance, for a case such as Argentina, where we observe a relatively large and redistributive state, coupled with low levels of efficiency and poor macroeconomic performance, the recommendation would be budget retrenchment protecting the more redistributive programs, while for a case such as Guatemala with a small and inefficient state that provides little social protection, the recommendation would be to increase taxation on the rich and to develop social programs.27
At another level, we know as political economists that ‘first-best’ policy recommendations are often ignored in political equilibria.28 Using the framework developed in the previous section, our recommendations at the political economy level would go in the direction of attempting to push countries toward the northeastern direction of more cooperative equilibria. How to do that is, again, a tricky question, but we would point toward potential institutional changes that facilitate intertemporal cooperation by strengthening bureaucratic capabilities, promoting party system institutionalization and programmatic orientation, and promoting stakeholder dialog and consensus building. Once we have a better understanding of possible new equilibria and how transitions might operate, we will be in a much better position to give country-specific policy advice on crafting new social contracts.
ACKNOWLEDGEMENTS
This article is based on a background paper prepared for the Latin America and Caribbean Inequality Review (LACIR). We are highly indebted to two anonymous referees for insightful comments and to Lucila Porto, who was fundamental in developing the theoretical model we sketch here. We received valuable comments from the coordinators of the LACIR initiative, from discussants and colleagues at the LACIR meetings in Washington DC and Cartagena, at the UNU-WIDER conference in Bogotá, the International Economic Association World Congress in Medellín, and Universidad de San Andrés, Di Tella, IIEP-UBA, Vanderbilt, Houston, Tulane, NYU. Some parts of this paper draw from joint work with Nora Lustig and Ludovico Feoli at the Commitment to Equity (CEQ) Institute of Tulane University, from where we took the redistribution data. The authors acknowledge the financial support of the Inter-American Development Bank. The opinions expressed here are those of the authors and do not necessarily reflect the views of the Inter-American Development Bank, its Board of Directors or the countries they represent.
STUDY FUNDING
This research was financed by the Inter-American Development Bank (IDB).
CONFLICT OF INTEREST
IDB management had no involvement in the study design, analysis or interpretation of the data, in the writing of the report or in the decision to submit the article for publication.
AUTHORS' CONTRIBUTIONS
Carlos Scartascini and Mariano Tommasi (Conceptualization), Matias Guizzo-Altube (Data Curation, Software, Validation), Matias Guizzo-Altube, Carlos Scartascini and Mariano Tommasi (Formal analysis, Methodology, Visualization, Writing—original draft, Writing—review & editing), Carlos Scartascini (Funding acquisition, Supervision).
DATA AVAILABILITY
Data used in this paper are publicly available from the original sources, as cited in each figure.
Footnotes
We refer to a very important line of work led by Acemoglu and Robinson around the 2000s; for instance, Acemoglu and Robinson (2005) and (2008). Clearly, the broader work of Acemoglu, Robinson and collaborators on institutions and development is much more comprehensive and nuanced. Yet, the ‘simple’ connection of elite power and inequality is quite salient in policy discussions in the region even today. See, for instance, the influential UNDP Regional Economic Report 2021 (United Nations Development Program (UNDP) 2021), especially chapter 3.
The indicator of inefficiency used in the figure includes the wastefulness of government spending, the burden of government regulation, the quality of overall infrastructure and the quality of the education system. (We will discuss later the limitations of the available data to better measure government efficiency across countries.) To get an idea of the magnitude of the burden of government regulation, barriers to entry are 40% higher in the region than in OECD countries, and government regulations are more than twice as high according to the Doing Business indicators and the Enterprise Surveys conducted by the World Bank (https://www.worldbank.org/en/businessready and https://www.enterprisesurveys.org/en/enterprisesurveys).
In some interpretations of the foundations of populism, it is a sort of mirror image of elite domination. ‘Critiques of elites define populism, which conceives of power relations as a unified, conspiring elite exploiting the good people. Yet, populism itself is inherently elitist, calling for a strong leader to take power and channel the will of the people’ (Mangset et al. 2019).
As can be seen from the previous figures, there are cases in the region with high levels of taxation and non-negligible redistributive efforts. But in some cases, such redistribution comes hand in hand with macroeconomic imbalances, high inflation, low growth and low-quality public policies. When redistributive efforts are short-sighted, fiscal imbalances lead to inflation and frequent macroeconomic crises that reduce growth and thwart poverty reduction efforts. del Valle et al. (2022) describe Argentina as fitting this description quite well.
See Tommasi (2021) and Tommasi (2023) for an elaboration on these issues.
We use revenue since it is a more direct measure of the distortions introduced into the economy by fiscal policy, but results are analogous when we use spending instead. These two measures of government size have a correlation above 90%, and when we classify countries into political equilibria (see below), 91.6% are equally classified by both measures. In the Online Appendix, we present the alternative version of Figure 4 below (Figure A1).
See, for instance, Alesina and Glaeser (2004), Benabou (1996), Lindert (1996), Moene and Wallerstein (2001) and Perotti (1996).
Several works report a negative relationship between democracy and inequality using specific episodes and datasets (Acemoglu and Robinson, 2000; Lindert, 1994, 2004; Persson and Tabellini, 2003). Other papers point in the opposite direction (Perotti 1996; Gradstein and Milanovic 2004; Scheve and Stasavage 2012).
The truncated welfare states that characterized many Latin American countries in the past and to some extent in the present could be thought of as one materialization of the latter equilibrium (Holland, 2018).
In the words of Haggard, Maxfield and Schneider (1997, p. 38), ‘capital votes twice: once through the organized pressure it can bring to bear on the political process, again through its investment decisions.’ Recent applications include Fairfield (2015), which examines under what conditions the interests of economic elites prevail in preventing tax reforms in Latin America.
An example of the latter might be the post-Pinochet Chilean constitution, which contained many elements favoring the parties on the right. Ardanaz and Scartascini (2013) provide broader evidence of these mechanisms, showing that legislative malapportionment enables rich elites to exercise disproportionate political influence, blocking progressive tax reforms.
Similar models exist, such as Acemoglu, Egorov and Sonin (2013a), in which politicians in power implement populist policies to signal their type.
Models that show that the desire to manipulate future political equilibria can induce inefficient policies include Robinson and Verdier (2013), Besley and Coate (1998), Becker and Mulligan (2003), Drazen and Limão (2008) and Acemoglu and Robinson (2013). This logic has also been applied to explain macroeconomic outcomes, such as fiscal deficits and public debt, in terms of the strategies of incumbent politicians who anticipate that the opposing party can be in office in the future (Alesina and Tabellini 1990; Alesina and Passalacqua 2016; Eslava 2010).
Populism is not necessarily an underlying exogenous distortion. It is an equilibrium outcome which might be more likely under some parametric assumptions and that correlates with some inefficient outcomes in such equilibrium. In the framework we refer to in the next section, there are some equilibria that can be interpreted as situations of (left-wing) populism.
A good account is provided in Lane (2013).
These authors have the cases of Hugo Chávez in Venezuela, the Kirchners in Argentina, Evo Morales in Bolivia, Alan García in Peru and Rafael Correa in Ecuador as motivating examples.
These authors also use Latin American examples to motivate their logic.
This very simplified version of models with richer allocation mechanisms of power over time (as in Alesina 1988 or Dixit, Grossman and Gul 2000), or with richer decision-making protocols within period (a la Baron and Ferejhon 1989), allows us to put emphasis on the intertemporal aspects of political negotiation and policy implementation. Having said that, it is important to highlight that ‘the power of the rich’ |$\boldsymbol{p}$| should be broadly interpreted to include the de facto political power of the rich as well as their additional institutional (de jure) power in a richer bargaining model.
We could have fewer stark results if the economic or political microfoundations introduced other frictions, but the substance of the results would be the same if instead of |$\mathbf{0}$| and |$\mathbf{1}$| we had interior values |$\underline{\boldsymbol{s}}$| and |$\overline{\boldsymbol{s}}$|. Section A.1 in the Online Appendix provides more detailed discussion and proof of the statements made here.
We focus on the symmetric grim-trigger strategy equilibrium in which both parties choose the same |${\boldsymbol{s}}^{\ast}$|. The strategies are defined more formally in the Online Appendix. Given that in this formulation political parties maximize short-term payoff, their reaction function is taken into consideration in the strategies of the rich and the poor.
This inverse U-shape tells us that the probability of cooperation is high when power is balanced and low when power is concentrated in one of the groups. This result was also present in similar models by Alesina (1988) and Spiller and Tommasi (2007).
The weak inequality in the last two cases comes from the fact that redistribution is independent of |$\boldsymbol{\gamma}$| and |$\boldsymbol{\beta}$| within equilibria, but it is higher in the CE, which, in turn, is more likely with higher |$\boldsymbol{\gamma}$| and |$\boldsymbol{\beta}$|.
These challenges are discussed in Tommasi (2021, 2023) and World Bank (2022).
Tommasi (2021) provides some tentative suggestions for that endeavor. For instance, given that a large body of literature suggests that social spending on children has much higher social rates of return than spending on adults and seniors, adequately weighting the age composition of spending in CEQ assessments could constitute one step in the right direction.
For instance, if the rich have an easier time solving their collective action problems, then political parties representing the poor are likely to be more corrupt than those representing the rich.
This argument is developed in more detail in Tommasi (2021).
Table A3 in the Online Appendix (taken from Tommasi, 2023) presents a 2 × 2 × 2 matrix with a more detailed analysis of policy recommendations for various fiscal vector configurations.
Acemoglu and Robinson (2013) and Dercon (2023) provide insights into such dilemmas and possible ways to overcome them.
REFERENCES
Fudenberg, D., and Tirole J. (
