


Abstract
It is unclear if there are differences in methicillin-resistant Staphylococcus aureus (MRSA) risk between sexes in high-risk populations.
Females incarcerated at the Cook County Jail were enrolled within 72 hours of intake. Surveillance cultures (nares, throat, groin) were collected to determine the prevalence of MRSA colonization. A survey was administered to identify colonization predictors. Univariate and multivariate analyses were performed to identify predictors of colonization at intake. Genomic sequencing was performed on MRSA colonization and archived clinical isolates.
Two hundred fifty women were enrolled (70% African American, 15% Hispanic), with 70% previously in jail. The prevalence of MRSA colonization at intake was 20%, with 42% of those colonized solely in the throat or groin. Univariate predictors of MRSA colonization at entrance were illicit drug use, unstable housing, engaging in anal sex, recent exchange of sex for drugs/money, and a higher number of recent sexual partners. With multivariate adjustment for race/ethnicity, use of needles for illicit drugs was a significant predictor of MRSA. Use of illicit drugs was also associated with inclusion in a genomic cluster. Nares colonization was significantly associated with not being in a genomic cluster (18.8% vs 78.6%; P < .001), whereas exclusive extranasal colonization was associated (odds ratio, 15.89; P < .001).
We found that a high proportion (20%) of females entered jail colonized with MRSA, suggesting that previously reported sex disparities of a lower risk in women may not apply to high-risk populations. Our findings suggest high-risk activities or venues in the community for MRSA, with potential for directing sex-specific interventions.
Community-associated methicillin-resistant Staphylococcus aureus (CA-MRSA) has become a major clinical problem [1]. The predominant CA-MRSA strain in the United States—now endemic in some cities [2]—is pulsed-field gel electrophoresis-type USA300 [3]. There has been a disproportionate burden of CA-MRSA in particular disadvantaged populations [4, 5]. Incarceration exposure, illicit drug use, social networks, and high-risk living situations have been hypothesized to contribute to observed MRSA disparities [6–8]. A sex disparity in MRSA risk—more carriage and infection in men—also has been reported [9], but it is not clear if this disparity applies to high-risk populations.
One identified risk factor for USA300 is residence in congregate living settings such as correctional facilities [10–12]. Urban jails—characterized by short-term incarceration while awaiting trial or sentencing, high turnover, and high recidivism—may be a site where high-risk networks can intersect [13, 14]. Prior work has demonstrated that inner-city jails can be important sites for public health interventions aimed at directly benefiting detainees and subsequently improving the health of the community at large [15–18]. This approach could be extended to MRSA to maximize the benefits of a nonhospital intervention.
It is unclear if in high-risk populations, such as persons in correctional facilities, the risk for MRSA in females could be similar to that in males. Prior evaluation of high-risk females suggests that the risk for MRSA is significantly higher than in the general population [19] and nears it that of high-risk males [4, 20]. In addition, females entering a jail might have different risks—drug, sexual, and community exposures—from male detainees [20, 21].
Examining sex differences in MRSA risk may provide epidemiologic-driven planning of interventions for MRSA control. We sought to determine the prevalence of MRSA colonization in females at entrance to a large urban jail and identify community MRSA risk factors. Whole-genome sequencing (WGS) was used to delineate the genomic epidemiology of MRSA strains.
METHODS
Study Population
The study setting was the Cook County Jail (Chicago, IL, USA), one of the largest single-site jails in the United States, with roughly 250 incarcerations per day and an average daily census of 9000–10 000 detainees during the study (for females, 25 incarcerations per day and an average daily census of 900–1000). From August 2017 through May 2018, incarcerated females were enrolled at intake to the jail. Females were followed during incarceration and were eligible for study visits at day 15 and day 30 if still incarcerated.
Swab Collection and Processing
Surveillance cultures of anterior nares, throat, and bilateral inguinal area were collected at enrollment to determine MRSA colonization prevalence and at day 15 and day 30 to assess acquisition. Specimens were obtained using Copan ESwabs for MRSA detection [22], as described previously [14]. Sample sites were chosen to maximize identification of MRSA carriers [10, 23]. Swabs were inoculated into enrichment broth to increase culture sensitivity [24]. Aliquots of overnight broth cultures were inoculated on ChromID MRSA agar plates (bioMérieux, Durham, NC, USA). MRSA was confirmed by standard biochemical tests; methicillin resistance was confirmed by cefoxitin disk.
Archived Clinical MRSA Isolates
Archived clinical MRSA from female detainees incarcerated preceding and during the study also underwent genomic sequencing. Clinical isolates from individuals who had been in the jail for >48 hours were considered jail-onset infections. The purpose of including these isolates was (1) to put into context MRSA colonization isolates from enrolled detainees and (2) to better characterize the genomic epidemiology of circulating MRSA strains.
Whole-Genome Sequencing
WGS was performed as described previously [25] on MRSA isolates collected from enrolled females at intake and the day 15 and day 30 study visits and among existing clinical MRSA isolates from female detainees (Supplementary Methods). Details on sequenced strains are available in Supplementary Table 1. Sequence data are available under Bioproject PRJNA761409.
Potential transmission links were defined by a single nucleotide variant (SNV) threshold of 20 based on previous reports to optimize the balance between false-positive and -negative linkages [26, 27]. For individuals with multiple isolates sequenced, representative isolates were selected using a combination of phylogenetic clustering and an SNV distance threshold, to include multiple isolates from an individual if they were deemed to represent independent acquisition events (Supplementary Figure 1). Isolates from female detainees occurring after 2015 were combined with previously published male isolates (Bioproject PRJNA530184 and PRJNA638400) [14] from a similar period to put community and within-jail transmission networks into context. Details on variant calling and phylogenetic analysis are in the Supplementary Methods.
Risk Factors and Statistical Analysis
A survey to identify predictors of MRSA colonization was administered to females at enrollment and included questions about drug use, sexual behaviors, housing status, sexually transmitted disease history, and incarceration history.
The prevalence of MRSA colonization at entrance to the jail in females was calculated using the total number of females sampled as the denominator. The prevalence of extranasal colonization (eg, throat, inguinal area) and exclusive extranasal colonization (colonization at a body site when the anterior nares test was MRSA-negative) was examined. MRSA prevalence was calculated at intake and follow-up (ie, either day 15 or day 30). An assessment was done for individuals who were negative for MRSA at intake and later became positive (presumptive acquisition), for those who were positive at intake and remained positive, and for those who lost colonization (positive at intake and subsequently negative).
The results of surveillance cultures and intake survey data were used for risk factor analysis. SAS software, version 9.4 (SAS Institute, Cary, NC, USA), was used for statistical analysis. A 3-step process was used to establish a final multivariate model. In the first step, a series of bivariate models tested the association of each correlate. Chi-square and Fisher exact tests were used for categorical/binary variables. Logistic regression models were used for continuous variables. In the second step, 3 separate multivariate logistic regression analyses were conducted to test the effects of 3 groups of correlates significant in step 1: (a) substance use variables, (b) living arrangement variables, and (c) sexual behavior variables. These models used forward stepwise entry controlling for race/ethnicity. Finally, significant variables from step 2 were entered into a final multivariate logistic regression model.
Patient Consent
The study was approved by the Cook County Health institutional review board, which oversees approval for enrollment of Cook County Jail detainees, and the Rush University Medical Center institutional review board; verbal consent was obtained. Approval from the Office for Human Research Protections was obtained to enroll current detainees.
RESULTS
The Study Population
We enrolled 245 individuals (250 incarcerations); 70% were African American, and 15% were Hispanic. Recidivism was high; 70% of women previously had been in jail, 21% in the prior 6 months. The mean number of prior jail incarcerations (SD) ever was 4.8 (8.4), while 23% of women had previously been in prison. Of unique individuals, 240 (98%) had 1 and 5 (2%) had 2 incarcerations during the study. Illicit drug use was common; 74% of enrollees reported use in the past year. Unstable or temporary housing was also common; 41% reported being homeless, couch surfing, or residing in a substance abuse center in the prior year.
Prevalence of CA-MRSA Colonization at Entrance to the Jail
Fifty (20%) females were colonized with MRSA at entrance. Nares (11.6%), throat (10%), and inguinal (10.8%) colonization were all common. Exclusive extranasal colonization was present in 21 females (42% of colonized and 8.4% of all subjects). Colonization occurred for 25 (50%) at 1 body site, 19 (38%) at 2 body sites, and 6 (12%) at all 3 body sites. MRSA colonization was similar for those enrolled once (49/240, 20.4%) vs more than once (1/5, 20%).
MRSA Colonization Patterns During Incarceration
There were 36 and 31 women who underwent MRSA surveillance at days 15 and 30, respectively (Table 1; Supplementary Figure 2). Of 36 participants who were negative for MRSA at admission and tested for MRSA at day 15 and/or day 30, 3 were positive for MRSA. By day 15, of 32 who were negative at intake, 1 (3%) female who was negative at enrollment had acquired MRSA. By day 30, of 26 who were negative at intake, 2 females who were negative at enrollment had acquired MRSA (8%). All 5 females who screened positive for MRSA at enrollment and were tested at day 30 were positive at day 30.
Prevalence of MRSA at Entrance to the Jail, Day 15 Into Incarceration, and Day 30 Into Incarceration
| Intake | Day 15 | Day 30 | |||||
|---|---|---|---|---|---|---|---|
| Admission Result | n = 245 | Total Screened | MRSA Colonized | MRSA Negative | Total Screened | MRSA Colonized | MRSA Negative |
| MRSA-colonized | 50 (20) | 4a | 4 (100) | 0 | 5 | 5 (100) | 0 |
| MRSA-negative | 195 (80) | 31 | 1 (3) | 30 (97) | 26 | 2 (8) | 24 (92) |
Values represent No (%). Follow-up percentages are based on the number of study participants evaluated at that follow-up study visit.
Abbreviation: MRSA, methicillin-resistant Staphylococcus aureus.
One female who was MRSA-colonized at admission and remained MRSA-colonized at the day 30 study visit did not have a sample collected at day 15.
Predictors of MRSA Colonization at Admission to the Jail
On univariate analysis (Table 2), significant predictors of MRSA colonization in females at jail entry were illicit drug use in past year, using needles for illicit drugs in the past year, unstable housing in the past year, engaging in anal sex in the prior 3 months, and current exchange of sex for drugs or money. An increased mean number (SD) of sexual partners in the prior 3 months (4 [9.8] vs 1.6 [3.8]) was significantly associated with MRSA colonization (P = .04).
Univariate and Multivariate Analysis of Predictors of MRSA Colonization at Admission to the Jail in Females
| Univariate Analysis | Multivariate Analysis | |||||||
|---|---|---|---|---|---|---|---|---|
| Epidemiologic Factor | MRSA (n = 50), No. (%) | No MRSA (n = 195), No. (%) | OR | 95% CI | P Value | OR | 95% CI | P Value |
| Race/ethnicity | ||||||||
| African American | 32 (64.0) | 140 (71.8) | 0.6 | 0.3–1.4 | .25 | 1.3 | 0.4–3.8 | .86 |
| Hispanic | 8 (16.0) | 28 (14.4) | 0.8 | 0.3–2.2 | .63 | 1.8 | 0.5–6.5 | .34 |
| White/other | 10 (20.0) | 27 (13.8) | ||||||
| Age, mean (SD), y | 33.2 (11.8) | 34.1 (11.5) | 1.0 | 1.0–1.0 | .60 | |||
| Cocaine use in the past year | 20 (40.0) | 50 (25.6) | 1.9 | 1.0–3.7 | .04 | |||
| Heroin use in the past year | 15 (30.0) | 32 (16.4) | 2.2 | 1.1–4.5 | .03 | |||
| Other narcotic use in the past year | 9 (18.0) | 17 (8.7) | 2.3 | 1.0–5.5 | .06 | |||
| Illicit benzodiazepine use in the past year | 15 (30.0) | 26 (13.3) | 2.8 | 1.3–5.8 | <.01 | |||
| Taking prescription drugs to get high | 6 (12.0) | 9 (4.6) | 2.8 | 1.0–8.3 | .09a | |||
| Ecstasy or psychedelic use | 9 (18.0) | 32 (16.4) | 1.1 | 0.5–2.5 | .79 | |||
| Illicit inhalant use | 1 (2.0) | 2 (1.0) | 2.0 | 0.2–22.2 | .50a | |||
| Marijuana use | 32 (64.0) | 121 (62.1) | 1.1 | 0.6–2.1 | .80 | |||
| Injection drug use in the past year | 9 (18.0) | 8 (4.1) | 5.1 | 1.9–14.1 | <.01a | 4.1 | 1.1–5.7 | .04 |
| Previous incarceration in jail | 39 (78.0) | 133 (68.2) | 1.7 | 0.8–3.4 | .18 | |||
| Times in jail before, mean (SD) | 6.3 (10.4) | 4.4 (7.8) | 1.0 | 1.0–1.1 | .17 | |||
| Release from jail in the prior 3 mo | 7 (14.0) | 20 (10.3) | 1.4 | 0.6–3.6 | .45 | |||
| Release from jail in the prior 6 mo | 15 (30.0) | 36 (18.5) | 1.9 | 0.9–3.8 | .07 | |||
| Previous incarceration in prison | 13 (26.0) | 43 (22.1) | 1.2 | 0.6–2.5 | .55 | |||
| Release from prison in the prior 3 mo | 0 (0.0) | 1 (0.5) | ||||||
| Release from prison in the prior 6 mo | 1 (2.0) | 2 (1.0) | 2.0 | 0.2–22.2 | .50a | |||
| Homeless or unstable housing in the past year | 23 (46.0) | 59 (30.3) | 2.0 | 1.0–3.7 | .04 | 1.5 | 0.7–3.0 | .75 |
| Substance abuse center in the past year | 7 (14.0) | 11 (5.6) | 2.7 | 1.0–7.4 | .06a | |||
| Current skin infection | 3 (6.0) | 6 (3.1) | 2.0 | 0.5–8.3 | .39a | |||
| ER visit in the past year | 28 (56.0) | 92 (47.2) | 1.4 | 0.8–2.7 | .27 | |||
| Skin or MRSA infection in the past year | 0 (0.0) | 6 (3.1) | ||||||
| Hospitalized in the past year | 12 (24.0) | 50 (25.6) | 0.9 | 0.4–1.9 | .81 | |||
| HIV-infected | 3 (6.0) | 5 (2.6) | 2.4 | 0.6–10.5 | .21a | |||
| Reports sex with men | 46 (92.0) | 171 (87.7) | 1.6 | 0.5–4.9 | .39 | |||
| Reports sex with women | 8 (16) | 49 (25.1) | 0.6 | 0.2–1.3 | .17 | |||
| Ever diagnosed with a sexually transmitted disease | 28 (56.0) | 87 (44.6) | 1.6 | 0.8–3.0 | .15 | |||
| Ever diagnosed with gonorrhea | 12 (24.0) | 28 (14.4) | 1.9 | 0.9–4.0 | .10 | |||
| Ever diagnosed with chlamydia | 18 (36.0) | 57 (29.2) | 1.4 | 0.7–2.6 | .35 | |||
| Ever diagnosed with trichomonas | 9 (18.0) | 19 (9.7) | 2.0 | 0.9–4.8 | .10 | |||
| Ever diagnosed with syphilis | 4 (8.0) | 6 (3.1) | 2.7 | 0.7–10.1 | .12a | |||
| Oral sex in the past 3 mo | 34 (68.0) | 128 (65.6) | 1.1 | 0.6–2.2 | .75 | |||
| Anal sex in the past 3 mo | 8 (16.0) | 12 (6.2) | 2.9 | 1.1–7.6 | .04a | |||
| Lubricant use during sex in the past 3 mo | 13 (26.0) | 26 (13.3) | 2.3 | 1.1–4.9 | .03 | |||
| Use of sex toys in the past 3 mo | 12 (24.0) | 39 (20.0) | 1.3 | 0.6–2.6 | .53 | |||
| Use of vaginal douching products in the past 3 mo | 14 (28.0) | 44 (22.6) | 1.3 | 0.7–2.7 | .42 | |||
| Has menses | 34 (68.0) | 150 (76.9) | 0.6 | 0.3–1.3 | .19 | |||
| Current exchange of sex for drugs or money | 9 (18.0) | 11 (5.6) | 3.7 | 1.4–9.4 | <.01a | 2.2 | 0.7–6.4 | .73 |
| No. of sex partners in the past 3 mo, mean (SD) | 4.0 (9.8) | 1.6 (3.8) | 1.1 | 1.0,1.1 | .04 | |||
| Always used a condom in past 3 mo | 17 (34.0) | 40 (20.5) | 2.0 | 1.0–3.9 | .04 | |||
| Kids ≤5 at home | 15 (30.0) | 45 (23.1) | 1.4 | 0.7–2.8 | .31 | |||
| Exercised in the gym in the past 3 mo | 5 (10.0) | 38 (19.5) | 0.5 | 0.2–1.2 | .12 | |||
Abbreviations: ER, emergency room; MRSA, methicillin-resistant Staphylococcus aureus.
Indicates that the P value is based on the Fisher exact test.
In the second step in the process for building the multivariable model, only 1 variable in each of the categories of predictors (ie, substance use, living arrangement, and sexual behavior) was entered into the model (ie, controlling for race/ethnicity). In the final multivariable analysis with adjustment for race/ethnicity, injection drug use in the past year (odds ratio, 4.1; 95% CI, 1.1–15.7; P = .04) was a significant predictor of MRSA colonization at entrance.
Genomic Epidemiology of MRSA Strains Isolated at Entrance to the Jail
Five individuals were colonized with multiple strains at intake (3 with 2 distinct USA300 isolates and 2 with USA300 and non-CC8). Most intake colonization isolates were identified as USA300 (n = 47), others as non-CC8 (eg, USA100; n = 8). In contrast to what was observed with male detainees [14], no USA500 colonization was detected in females (Supplementary Table 2). Intake USA300 colonization isolates in females were diverse (range, 0–174 SNVs). Five clusters (ranging in size from 2 to 4 individuals) of intake colonization isolates that were <20 SNVs apart from other isolates in that cluster were detected among females (Figure 1).
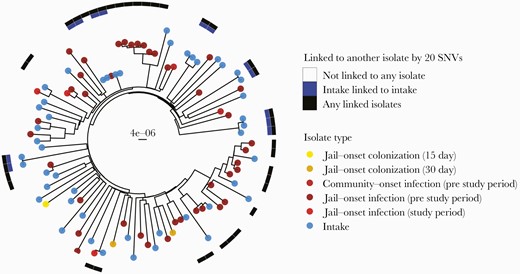
Phylogeny of female USA300 MRSA colonization and clinical isolates. Tips are labeled by isolate type. Surrounding heatmap indicates if the female isolate is linked to another female isolate within 20 SNVs; blue indicates a female intake isolate linked to another female intake isolate, and black indicates any female isolate linked to any other female isolate. Tree includes female infections occurring from 2011 to 2018. Scale bar indicates substitutions per site. Abbreviations: MRSA, methicillin-resistant Staphylococcus aureus; SNV, single nucleotide variant.
We examined whether epidemiologic factors were associated with being in a USA300 intake cluster in females. Nares colonization was significantly associated with not being included in a genomic cluster (18.8% vs 78.6%; P < .001), so, conversely, exclusive extranasal colonization was associated with being in a cluster (81% vs 21%; P < .001) (Table 3; Supplementary Table 3). Engaging in oral sex in the last 3 months was significantly associated with being in a genomic cluster (94% vs 57%; P = .02). Illicit drug use was more common among individuals included in a genomic cluster, but the association did not attain significance (94% vs 68%; P = .07).
Epidemiologic Factors Associated With Inclusion in a USA300 Genomic Cluster Among Females at Entrance to the Jail
| Epidemiologic Factor | Included in Genomic Cluster (n = 16), No. (%) | Not Included in Genomic Cluster (n = 28), No. (%) | OR | 95% CI | P Value |
|---|---|---|---|---|---|
| African American | 11 (68.75) | 18 (64.29) | 1.22 | 0.33–4.53 | 1 |
| Hispanic | 2 (12.5) | 7 (25) | 0.44 | 0.08–2.37 | .45 |
| Site of MRSA colonization | |||||
| Nares colonization detected at intake | 3 (18.75) | 22 (78.57) | 0.07 | 0.01–0.3 | <.001 |
| Throat colonization detected at intake | 8 (50) | 12 (42.86) | 1.32 | 0.39–4.58 | .76 |
| Inguinal colonization detected at intake | 9 (56.25) | 17 (60.71) | 0.84 | 0.24–2.89 | 1 |
| Exclusive extranasal colonization at intake | 13 (81.25) | 6 (21.43) | 14.62 | 3.39–74.58 | <.001 |
| Illicit drug use | |||||
| Illicit drug use in past year | 15 (93.75) | 19 (67.86) | 6.85 | 0.81–62.48 | .07 |
| Marijuana use reported in past year | 14 (87.5) | 14 (50) | 8.08 | 1.34–36.69 | .02 |
| Cocaine use in past year | 6 (37.5) | 13 (46.43) | 0.7 | 0.2–2.43 | .75 |
| Heroin use in past year | 5 (31.25) | 9 (32.14) | 0.96 | 0.26–3.6 | 1 |
| Injection drug use in past year | 4 (25) | 5 (17.86) | 1.52 | 0.35–6.79 | .7 |
| Benzodiazepine use in past year | 6 (37.5) | 7 (25) | 1.78 | 0.48–6.77 | .5 |
| Sexual or health behaviors | |||||
| Females reporting a sexual preference of females | 6 (37.5) | 1 (3.57) | 15.09 | 1.73–151.85 | .006 |
| Engaging in oral sex in last 3 mo | 15 (93.75) | 16 (57.14) | 10.74 | 1.3–97.37 | .02 |
| Use of a vaginal douche or deodorant product in last 3 mo | 1 (6.25) | 11 (39.29) | 0.11 | 0.01–0.89 | .03 |
| Use of sex toys in last 3 mo | 7 (43.75) | 3 (10.71) | 6.17 | 1.37–30.61 | .02 |
| Engaging in anal sex in last 3 mo | 3 (18.75) | 4 (14.29) | 1.37 | 0.27–7.15 | .69 |
| Engaging in vaginal sex in last 3 mo | 14 (87.5) | 22 (78.57) | 1.88 | 0.34–10.82 | .69 |
| Current exchange of sex for drugs or money | 3 (18.75) | 6 (21.43) | 0.85 | 0.18–3.97 | 1 |
| Always used condoms in last 3 mo | 5 (31.25) | 11 (39.29) | 0.71 | 0.19–2.58 | .75 |
| Reports menstruating still | 13 (81.25) | 17 (60.71) | 2.74 | 0.65–12.15 | .2 |
| STD history | |||||
| Trichomonas | 1 (6.25) | 8 (28.57) | 0.17 | 0.02–1.48 | .12 |
| Chlamydia | 4 (25) | 13 (46.43) | 0.39 | 0.1–1.49 | .21 |
| Gonorrhea | 3 (18.75) | 7 (25) | 0.7 | 0.15–3.16 | .72 |
| Incarceration history | |||||
| Been to prison in the past | 7 (43.75) | 4 (14.29) | 4.48 | 1.1–19.85 | .04 |
| Been to jail in the past | 13 (81.25) | 22 (78.57) | 1.18 | 0.25–5.55 | 1 |
| Housing factors | |||||
| Reside in a zip code with high detainee release | 3 (18.75) | 11 (39.29) | 0.36 | 0.08–1.55 | .2 |
| Unstable housing in past year | 8 (50) | 12 (42.86) | 1.32 | 0.39–4.58 | .76 |
| Health care factors | |||||
| Been to an emergency room in past year | 7 (43.75) | 18 (64.29) | 0.44 | 0.12–1.51 | .22 |
| Hospitalized in past year | 2 (12.5) | 7 (25) | 0.44 | 0.08–2.37 | .45 |
Genomic cluster was defined as an MRSA isolate genetically linked to another isolate by ≤20 SNVs. Comparator isolates include those from male detainees from an accompanying study [15]. Odds ratio, 95% Wald confidence interval, and P value from the Fisher exact test are reported from the epitools package in R. Results are similar when restricting to female–female pairs (Supplementary Table 3).
Abbreviations: MRSA, methicillin-resistant Staphylococcus aureus; OR, odds ratio; SNV, single nucleotide variant; STD, sexually transmitted disease.
We compared intake colonization USA300 isolates from male detainees from a parallel project [15] to put female USA300 MRSA transmission networks at jail entrance into context. There was more clustering of intake colonization isolates among females than among males, although the difference did not reach significance (34% vs 21%; P = .10) (Supplementary Figure 3). A similar proportion of jail-onset infections within genomic clusters occurred for females compared with males (P = .55).
In an assessment of epidemiological factors associated with male–female transmission networks at intake, nares colonization was significantly associated with not being in a genomic cluster (Supplementary Table 4, Supplementary Figure 4). In addition, illicit and injection drug use were associated with being in a genomic cluster among males (Supplementary Table 5) and when male and female transmission networks were combined (Supplementary Table 4), though it did not attain significance.
Genomic Epidemiology of MRSA Strains Isolated During Incarceration
The 3 jail-onset MRSA colonization isolates were all USA300 strains. There were 7 females colonized at intake who remained colonized at follow-up. WGS revealed that colonizing strains changed among 2 individuals during incarceration. One female colonized at intake remained colonized at day 30 but with a genomically different strain (396 SNV differences from intake). Another female who was colonized with USA300 in the anterior nares and a genomically distinct USA300 strain in the throat at intake maintained this profile at day 15 but was colonized with only 1 of the strain types (nares and throat) on day 30. There were 4 females who were persistently colonized with the same USA300 strain type, and 1 persistently colonized with a ST5/USA100 strain.
There were 48 clinical MRSA isolates from female detainees—3 during the study that were jail-onset and 45 from before the study (2011 through study start). Infections before the study were mostly jail-onset (n = 42/45). Most clinical isolates (n = 45) were identified as USA300; 3 were ST5/USA100 (Supplementary Table 2). All but 1 were from skin infections.
None of the 3 jail-onset colonization isolates were within 20 SNVs of another study isolate. However, 48.8% of jail-onset USA300 infection isolates were within 20 SNVs of another isolate; 14% were genomically like intake USA300 colonization strains, and 39.5% were genomically similar to another jail-onset clinical isolate.
Genomic Epidemiology of MRSA Colonization and Infection Strains in Female vs Male Detainees
When male and female intake colonization and clinical isolates were combined, 11 genomic clusters of USA300 strains that included isolates from both sexes, ranging in size from 2 to 13 individuals, were identified (Figure 2; Supplementary Table 6). Within these 11 genomic clusters, there were 57 male–female pairs of USA300 isolates within 20 SNVs of each other (Supplementary Table 6). Two genomic clusters were solely colonization isolates collected at intake for male and female detainees. Two other clusters also were predominantly colonization isolates from males and females at intake (83% and 80% of isolates in clusters were from intake). The remaining genomic clusters included a combination of intake and clinical isolates (Supplementary Table 6).
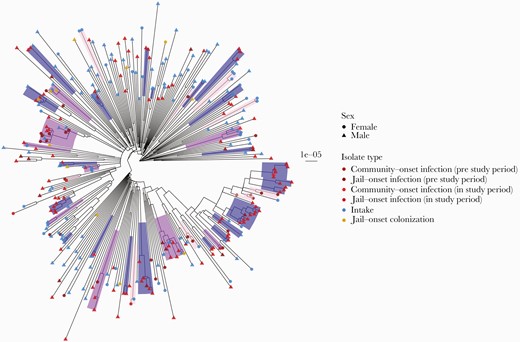
Phylogeny of male and female USA300 colonization and clinical isolates. Clusters of isolates within 20 SNVs are highlighted and colored by pure male, pure female, or mixed male/female clusters. Tip labels indicate sex and are colored by isolate type. To be consistent with male study period, female infections were restricted to 2015–2018. Scale bar indicates substitutions per site. One tip with a long branch was dropped for visualization purposes. Abbreviation: SNV, single nucleotide variant.
DISCUSSION
A high proportion of females (20%) entered a large urban jail colonized with MRSA, a prevalence comparable to that in a parallel study of male detainees (19%) [14]. Entrance colonization risk factors—illicit drug use, unstable housing, high-risk sexual behaviors—suggest that high-risk activities or venues in the community exist. Using phylogenetic analysis, we noted a similar pattern to that seen previously among males entering the jail—diversity in USA300 strains with occasional clustering, suggesting transmission networks in the community before jail intake [14]. While several epidemiologic factors associated with being in a genomic cluster differed for males and females, illicit drug use was a common theme for inclusion in a cluster.
Overall, our results demonstrate significant MRSA burden in at-risk females and suggest that reported sex disparities in MRSA [9] may not apply to high-risk populations. We previously documented increased colonization burden of MRSA in males admitted to the major public hospital in Chicago [23]. Our prior work at a public HIV clinic in Chicago noted a prevalence of MRSA of 12.2% in HIV-infected females, nearly 50% of whom had prior incarceration [23]. In a study in a Texas prison from 1999 to 2001, female detainees had nearly twice the incidence of MRSA infection compared with male detainees [28]. We speculate that females in correctional facilities have a risk for MRSA that is similar to that for males and might warrant enhanced prevention interventions.
We observed that exchange of sex for drugs or money and greater number of recent sexual partners were associated with MRSA risk. Miko et al. [29] suggested that S. aureus colonization among individuals seeking care at STD clinics is frequent and that these individuals are part of larger community reservoirs of MRSA. In addition, CA-MRSA may mimic a sexually transmitted infection (STI), for example, transmission due to close person-to-person contact. We noted that regular condom use was associated with MRSA risk and speculate that condom use may be linked to other factors, for example, increased number of partners and exchanging sex for drugs or money. In fact, individuals reporting exchanging sex for drugs or money were significantly more likely to always use condoms (45% vs 21%; P = .03). Further work examining overlap between networks of spread of STDs and MRSA might delineate how MRSA is transmitted readily among at-risk community groups.
Colonization patterns might also affect spread of MRSA in the community, particularly relating to sexual activity. Engaging in anal sex was a significant risk factor for MRSA on univariate analysis, consistent with prior reports in males [8]. Our finding that recent oral sex was associated with being in a genomic cluster suggests that certain networks and behaviors could facilitate MRSA spread in high-risk groups. Exclusive extranasal colonization was significantly associated with being in a genomic cluster, suggesting that this colonization pattern could predispose individuals to exogenous MRSA acquisition. In support of this, nares colonization was negatively associated with being in a genomic cluster and could represent mostly endogenous colonization [30]. Whether absence of nares colonization increases risk for MRSA acquisition in general among at-risk individuals is unclear, but our findings suggest that nasal colonization may serve a controller role in limiting exogenous acquisitions.
Consistent with prior work [5, 6, 31, 32], illicit drug use remains a major risk factor for MRSA. Surveillance data from the Centers for Disease Control and Prevention’s Emerging Infections Program demonstrated that the risk for developing an invasive MRSA infection is >16-fold higher among illicit drug users, underscoring the intersection of the opioid and MRSA epidemics [33]. We similarly observed a 4-fold higher risk of MRSA colonization in females at jail entrance among injection drug users, and 15 out of 16 females epidemiologically linked in a genomic cluster reported illicit drug use in the past year. Illicit drug use is common among females entering correctional facilities [34, 35] and likely represents a potential, although difficult, intervention target.
Our study has limitations. We did not assess rectal colonization for MRSA, which reduces our ability to fully characterize the association observed between engaging in anal sex and having MRSA colonization. Second, we did not perform social network analysis and cannot more precisely characterize the MRSA transmission networks observed. Third, we included male detainees in the analysis to put into context isolates collected from females, despite a shorter study period and proportionally more females sampled at intake relative to the larger number of males that enter the jail.
In conclusion, the prevalence of MRSA colonization among females (20%) entering a large inner-city jail is high and comparable to that observed in male detainees [14]. Entrance colonization risk factors and phylogenetic analysis suggest that high-risk community activities may contribute to MRSA spread. While the extent to which MRSA behaves like a traditional STD remains unclear, our findings support how MRSA could be spread among certain sexual networks. As demonstrated previously [33], illicit drug use and MRSA continue to overlap and highlight the urgent need to address the opioid epidemic. In conclusion, our study supports the importance of bringing MRSA prevention efforts to the community and how some might need to be sex-specific.
Acknowledgments
We wish to thank Emma Richardson (Rush University Medical Center) for providing content expertise for the project and Lisa Diep with the Collaborative Research Unit at Cook County Health for her assistance with data collection. We wish to thank Dr. Bala Hota and Dr. Mary Hayden at Rush University Medical Center for their assistance with the early development of this study. We wish to thank Dr. Connie Mennella, chair of correctional health at Cermak Health Services, for her assistance in the early planning of the project.
Financial support. The project described was supported by Grant Number R01AI114688 (PI: K.J.P.) and a Supplement for Research on the Health of Women of Underrepresented, Understudied and Underreported Populations from the National Institute of Allergy and Infectious Diseases. The content is solely the responsibility of the authors and does not necessarily represent the official views of the National Institute of Allergy and Infectious Diseases or the National Institutes of Health. S.N.T. was supported by the Molecular Mechanisms in Microbial Pathogenesis training grant (NIH T32 AI007528).
Potential conflicts of interest. No conflicts of interest to disclose for any of the authors. All authors have submitted the ICMJE Form for Disclosure of Potential Conflicts of Interest. Conflicts that the editors consider relevant to the content of the manuscript have been disclosed.


Comments