


Abstract
Previous studies have shown gender differences in tuberculosis (TB) incidence; however, gender disparity has not been well documented across granular categorizations of anatomic sites affected by TB and in the presence of human immunodeficiency virus (HIV) coinfection, largely due to small sample size for less common TB clinical presentations and lack of detailed clinical data.
The study population included TB cases aged ≥15 years (n = 41, 266) diagnosed in Harare, Zimbabwe. This cross-sectional study estimated male-to-female ratio (M/F ratio) for (1) age-specific TB incidence, (2) age-specific HIV prevalence among incident TB cases, and (3) 9 types of TB defined by affected anatomic site.
Males were at a 53% higher risk of TB compared to females (risk ratio [RR] = 1.53; 95% confidence interval [CI], 1.12–2.09). Based on adjusted odds ratios (aORs) from multinomial logistic regression model, the odds of abdominal TB (aOR = 0.51; 95% CI, .39–.68), TB bones/joints/spine (aOR = 0.63; 95% CI, .45–.90), and “other” extrapulmonary TB sites (aOR = 0.69; 95% CI = .59–.81) versus pulmonary TB were lower among males compared to females. The risk of TB-HIV coinfection among males was 17% (RR = .83; 95% CI, .74–.93) and 8% (RR = 0.92; 95% CI, .88–.95) lower in the 15- to 24-year and 25- to 44-year age groups, respectively.
This study revealed a nuanced role of gender across finer categorizations of TB, indicating the need for future research to delineate underlying mechanisms driving gender disparities in TB. The finding that women had a greater likelihood of severe forms of TB and TB-HIV coinfection compared to men has important implications for women's health in TB-HIV high-burden settings.
Tuberculosis (TB) has remained a major cause of global mortality and is the single leading infectious killer only second to coronavirus disease 2019 [1, 2]. Although the TB epidemic affects all regions of the world, its burden is disproportionately shared by 30 countries that accounted for approximately 86% of the total estimated incident TB cases in 2020 [1]. In addition to global disparities across countries, the risk posed by TB varies across subpopulations defined by various sociodemographic characteristics including gender, age, race/ethnicity, immigration status, income level, and occupation in a given country [3, 4]. Existing disparities serve as an impediment to the World Health Organization's (WHO) End TB Strategy goals and the progress towards global TB elimination. Without targeted interventions for high-risk groups, existing TB disparities will likely be magnified, and hence identification of high-risk groups is the first step towards a proequity policy [5].
Biological sex is an important determinant of health because sex differences in genetic, hormonal, and epigenetic regulation alter prevalence, manifestation, and treatment of disease [6]. However, biology alone does not explain the globally observed gender disparities because these differences also arise from the social construction of gender [6, 7]. Prescribed gender roles, expectations, and norms may result in differences in access to material resources (prestige, power, nutrition), health-related behaviors (eg, smoking and drinking), and exposure to psychosocial stressors (eg, discrimination and violence) [6–9]. Current literature on gender epidemiology of TB demonstrates gender differences in prevalence/notification rate, disease manifestation, progression to disease, case-fatality rate, response to treatment, and along the continuum of TB pathogenesis and care [10–13].
Health inequalities defined across different strata of a single factor such as gender discount the actual context of people's lives where multiple identities/processes and their intersectionality together produce population health [14]. From previous studies, we know that gender interacts with sociodemographic factors such as age to modify the risk of TB [12, 15]. These effects may be further modified by the presence of other risk factors such as human immunodeficiency virus (HIV), which is associated with an increased risk of new Mycobacterium tuberculosis infection, reactivation of latent TB infection, and reinfection [16]. The risk of TB infection is approximately 20 times higher among HIV-infected individuals, and the case-fatality rate is 2 times higher compared to HIV-negative individuals, worsening the progress towards TB elimination in high-burden settings [16, 17].
Although many studies have already called for recognizing and targeting men as a high-risk group for TB interventions, the role of gender can be more nuanced across different contexts and populations. In this Zimbabwe-based study, we resolved gender differences in TB incidence over time, by age, by TB clinical presentation defined by affected anatomic site and in the presence of HIV coinfection to better understand the effect of gender on TB in different sociodemographic and clinical contexts. As reported below, our multidimensional and intersectional approach to understanding gender disparity and mapping risk groups provides a more precise and pragmatic characterization of gender disparity, which can be useful for designing equity-driven policies, improved diagnosis, and targeted interventions.
METHODS
Study Setting and Population
The setting of the current study, Zimbabwe, has been placed by the WHO on the global TB watch list and is among the top 30 high-burden countries for TB-HIV coinfection, requiring continued surveillance of the TB epidemic in the country [1]. The study sample included adult TB cases, 15 years and over, who were diagnosed (n = 41 266) in Harare, the capital city of Zimbabwe, during 2008 to 2017. The rate of sputum smear-positive cases among TB cases diagnosed in Harare in 2011 was 106.9 per 100 000, which was higher than the national average of 86.7 per 100 000 at the same time [18]. The cases diagnosed in Harare during that time included TB cases from both Harare city and its neighboring city, Chitungwiza.
Study Design and Data Collection
We conducted a time trend ecological analysis of (1) TB incidence during 2008–2017 and (2) HIV prevalence among incident TB cases during 2011–2017. A cross-sectional analysis was also conducted to examine gender disparity in TB clinical presentation defined by affected anatomic site.
Based on data availability, we retrospectively accessed 2 types of TB surveillance data for Harare city: (1) aggregated TB surveillance data for the period of 2008–2010 (n = 16 989) and (2) individual-level data on TB patients for the period 2011–2017 from the Harare City Health Department (n = 24 277). Both, aggregated and individual TB surveillance data, had information on sociodemographics and TB treatment history. Individual-level data additionally included information on HIV serostatus and other clinical variables. For population size estimates, the population projections calculated by the Zimbabwe National Statistics Agency (ZimStat) based on 2012 population census data were used [19].
Data Analysis
The study estimated (1) overall and age stratified male to female ratio (M/F ratio) for TB incidence and HIV prevalence among incident TB cases, (2) trend of TB incidence and HIV prevalence among incident TB cases, and (3) M/F ratio for various TB clinical presentations.
Male to Female Ratio Calculation
We used negative binomial or Poisson regression models with gender as the explanatory variable to calculate the male to female risk ratio. We calculated overall and age-stratified M/F ratio for TB incidence using data between 2008 and 2017 for TB and M/F ratio for HIV prevalence among incident TB cases using data between 2011 and 2017. Age was categorized into 4 groups: 15–24 years, 25–44 years, 45–64 years, and ≥65 years. We used a goodness-of-fit test to choose between negative binomial and Poisson models. For some cases, we used Poisson regression because the negative binomial model failed to converge.
Trend of Tuberculosis (TB) Incidence and Human Immunodeficiency Virus Prevalence Among Incident TB Cases
First, we examined the overall time trend for (1) TB incidence during 2008–2017 and (2) HIV prevalence among incident TB cases during 2011–2017 for Harare city. The TB incidence was calculated as incident cases of TB diagnosed in a given year per 100 000 population. Medium population projections based on 2012 Census data were used because they are considered to be most probable [19]. Because projections were only available for 2012 and onwards, we used the 2012 population estimate for years between 2008 and 2011. The HIV prevalence among incident TB cases was calculated as the percentage of HIV-positive TB patients among incident TB cases who had a documented HIV test result for a given year. The HIV data were not available for years between 2008 and 2010. To calculate annual percentage change (APC), we used negative binomial and Poisson regression models with year of diagnosis included in a linear form. In instances in which the negative binomial model failed to converge we used Poisson regression.
Second, we stratified overall time trends by gender to examine gender disparity in TB incidence and HIV prevalence among incident TB cases over time. Third, we studied gender-specific trends for each age group separately to observe the effect of age on observed gender disparity. To examine gender disparity, gender, year of diagnosis, and an interaction term between gender and year of diagnosis were included in the overall and age-stratified models.
Male to Female Ratio for Tuberculosis Clinical Presentations
To examine gender disparity for various TB clinical presentations, we used a multinomial logistic regression. The outcome variable, TB clinical presentation based on affected anatomic site, had 9 categories and was regressed on gender to obtain unadjusted male to female odds ratio (OR) (Table 1). Pulmonary tuberculosis (PTB) was used as the reference category for the outcome variable. For the adjusted model, year of diagnosis, healthcare setting, age group, treatment history, and HIV status were added as categorical variables to the model. Tuberculosis treatment history was dichotomized by collapsing cases with a treatment history of relapse, failed treatment, or loss to follow up as previously treated versus new cases with no treatment history.
Characteristics of TB Cases (n = 24 277) Diagnosed in Harare, Zimbabwe During 2011–2017
| Patient Characteristic | No (%a) |
|---|---|
| Gender | … |
| Male | 14 206 (58.5) |
| Female | 10 071 (41.5) |
| Age Group | … |
| 15–24 years | 2797 (11.5) |
| 25–44 years | 15 659 (64.5) |
| 45–64 years | 4772 (19.7) |
| ≥ 65 years | 1049 (4.3) |
| Treatment History | … |
| New case | 21 984 (90.6) |
| Previously treated | 2293 (9.5) |
| Healthcare Settingb | … |
| BRIDH | 15 160 (62.5) |
| WIDH | 6781 (27.9) |
| Other clinics | 2336 (9.6) |
| HIV Serological Status | … |
| Positive | 16 545 (68.2) |
| Negative | 5994 (24.7) |
| Unknown | 1738 (7.2) |
| TB Disease Site | … |
| PTB | 19 968 (82.3) |
| Abdominal TBc | 210 (0.9) |
| Lymphadenitis | 453 (1.9) |
| Miliary TB | 507 (2.1) |
| Other EPTB | 671 (2.8) |
| Pericarditis | 216 (0.9) |
| Pleural effusion | 1774 (7.3) |
| TB bones/joints/spine | 129 (0.5) |
| TB meningitis | 349 (1.4) |
Abbreviations: BRIDH, Beatrice Road Infectious Disease Hospital; EPTB, extrapulmonary tuberculosis; HIV, human immunodeficiency virus; PTB, pulmonary tuberculosis; TB, tuberculosis; WIDH, Wilkins Infectious Diseases Hospital.
Due to rounding, percentage may not add up to100.
BRIDH, WIDH, or other clinics (ie, other clinics throughout Harare).
Includes peritonitis and adenitis TB.
Patient Consent Statement
This study used deidentified patient data and was approved by the University of Michigan's Health Sciences and Behavioral Sciences Institutional Review Board (IRB-HSBS). This study was determined unregulated by University of Michigan IRB-HSBS.
Data Availability
The data used in this article were accessed through paper records of Harare City Health Department for use at the University of Michigan. Upon reasonable request, these data can be shared with prior approval from the Harare City Health Department and relevant data providers.
RESULTS
Characteristics of the Study Population
As described under Methods, we used data available from 2 different sources—aggregated and individual-level data—to conduct this study. Individual-level data were available for 24 277 TB cases diagnosed in Harare between 2011 and 2017 (Table 1). A majority of TB cases were male (58.5%) and between the productive age of 25 and 44 years (64.5%). New cases with no prior treatment history for TB accounted for approximately 91% of the study population. Among those with a prior treatment history for TB, 64.8% were men and 61.3% were in the 25- to 44-year age category. Although data on age, gender, treatment history, and diagnosis center were complete, approximately 7% of the study population did not have a documented HIV test result. The HIV seropositivity rate among those who had a documented test result for HIV was as high as 73.4%. Most of the TB patients presented with PTB (82.3%).
Overall and Age-Specific Gender Disparity in (1) Tuberculosis (TB) Incidence and (2) Human Immunodeficiency Virus Prevalence Among Incident TB Cases
Overall, the risk of TB was 53% higher among males compared to females (risk ratio [RR] = 1.53; 95% confidence interval [CI], 1.12–2.09) (Table 2). The risk in younger age groups did not differ significantly, but the point estimate of M/F ratio consistently increased with age and the ≥65-year age group had the highest risk among males (RR = 1.92; 95% CI, 1.23–3.00). The overall risk of HIV prevalence among incident TB cases did not differ between males and females (RR = 0.95; 95% CI, .81–1.12). When stratified by age, males experienced 17% and 8% lower risk of HIV prevalence in 15- to 24-year and 25- to 44-year age groups, respectively (RR = 0.83, 95% CI = .74–.93 and RR = 0.92, 95% CI = .88–.95). With increase in age, the gender disparity in HIV prevalence reduced, putting males and females at comparable risk.
Age-Stratified Male to Female Ratio (M/F Risk Ratio) for TB Incidence During 2008–2017 and Prevalence of HIV Among Incident TB Cases During 2011–2017 in Harare, Zimbabwe Calculated Using Poisson and Negative Binomial Regression
| Age Group | TB Incidence M/F Ratio (95% CI) | HIV Prevalence M/F Ratio (95% CI) |
|---|---|---|
| Overall | 1.53 (1.12–2.09) | 0.95 (.81–1.12) |
| 15–24 years | 1.14 (.79–1.65) | 0.83 (.74–.93) |
| 25–44 years | 1.25 (.78–2.01) | 0.92 (.88–.95) |
| 45–64 years | 1.61 (.98–2.62) | 1.02 (.94–1.10) |
| ≥65 years | 1.92 (1.23–3.00) | 1.10 (.86–1.40) |
Abbreviations: CI, confidence interval; HIV, human immunodeficiency virus; TB, tuberculosis.
Trend of Age-Specific Gender Disparity in Tuberculosis Incidence Over Time
The TB incidence in Harare declined from 364 cases per 100 000 population in 2008 to 121 cases per 100 000 population in 2017 with an annual percentage decline of 14% (95% CI, −18.6% to −10.1%) (Figure 1) and a similar rate of decline (P value for interaction = .9) among males and females. In addition, TB incidence declined for both males and females across all age groups; however, females experienced a higher rate of decline for age groups between 15 and 64 years, although the difference was not statistically significant (P value for interaction > .05) (Figure 2).
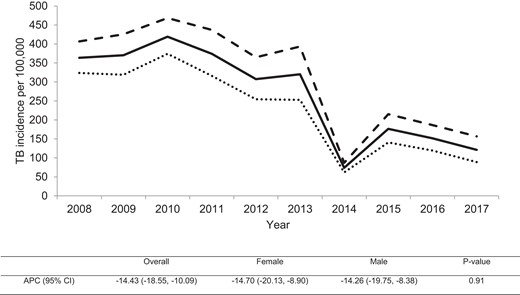
Trend of tuberculosis (TB) incidence in Harare, Zimbabwe during 2008–2017. Solid line, the overall TB incidence; dashed line, TB incidence among males; dotted line, TB incidence among females. The table below shows the overall and gender-stratified annual percentage change (APC) for TB incidence with P value for testing difference in the rate of decline between males and females. CI, confidence interval.
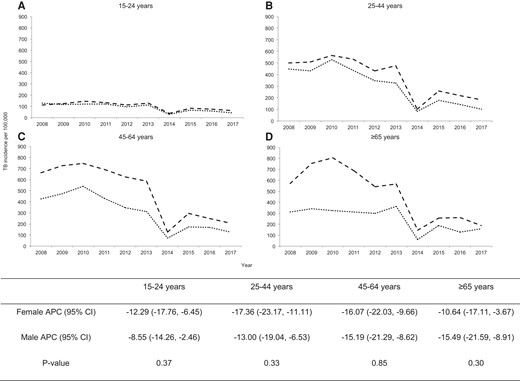
Age-stratified gender disparity in tuberculosis (TB) incidence in Harare, Zimbabwe during 2008–2017: (A) among 15–24 years; (B) among 25–44 years; (C) among 45–64 years; (D) among ≥65 years. The dashed line and dotted lines show the trend of TB incidence among males and females, respectively. The table below shows the gender-stratified annual percentage change (APC) of TB incidence for each age group and P values for testing difference in the rate of decline between females and males. CI, confidence interval.
Trend of Age-Specific Gender Disparity in Human Immunodeficiency Virus Prevalence Among Incident Tuberculosis Cases Over Time
Overall, the trend of HIV prevalence stayed stagnant among incident TB cases in Harare. It declined from 73% to 69% between 2011 and 2017 with an annual percentage decline of 0.5% (95% CI, −4.5% to 3.74%). The HIV prevalence increased by 0.08% per year among males (95% CI, −5.53 to 6.04) and declined by 0.95% per year among females (95% CI, −6.52 to 4.97) (Figure 3). In addition, HIV prevalence did not change significantly for either males or females across all age groups (P value for interaction > .05) (Figure 4).
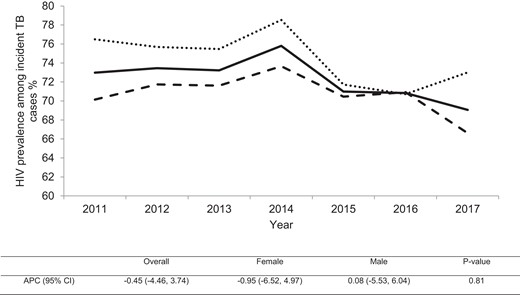
Trends of human immunodeficiency virus (HIV) prevalence among incident tuberculosis (TB) cases in Harare, Zimbabwe during 2011–2017. Solid line, the overall HIV prevalence among incident TB cases; dashed line, HIV prevalence among incident male TB cases; dotted line, HIV prevalence among incident female TB cases. The table below shows the overall and gender-stratified annual percentage change (APC) for HIV prevalence among incident TB cases with P value for testing the difference in the change of prevalence over time between females and males. CI, confidence interval.
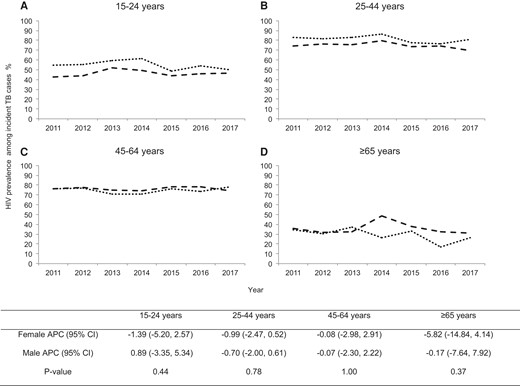
Age-stratified gender disparity in human immunodeficiency virus (HIV) prevalence among incident TB cases in Harare, Zimbabwe during 2011–2017: (A) among 15–24 years; (B) among 25–44 years; (C) among 45–64 years; (D) among ≥65 years. The dashed and dotted lines show the trend of HIV prevalence among males and females, respectively. The table below shows the gender-stratified annual percentage change (APC) of HIV prevalence for each age group and P value for testing the difference in the change of prevalence over time between females and males. CI, confidence interval.
Gender Disparity in Tuberculosis Clinical Presentation
The odds of presenting with TB at any of the 3 disease sites (abdominal TB, TB bones/joints/spine, and other extrapulmonary tuberculosis [EPTB]) compared to the reference category, PTB, were higher among females than males in the unadjusted model (Table 3), as shown by corresponding M/F ORs < 1. There was no significant gender difference for other TB subtypes.
Gender-Specific Distribution of TB Clinical Presentation Defined by Affected Anatomic Site and Male to Female Odds Ratio (M/F Risk Ratio) for Each Anatomic Site Based on the Analysis of 24 277 TB Patients Diagnosed in Harare, Zimbabwe During 2011–2017 Using Multinomial Logistic Regression
| Female (%) | Male (%) | Unadjusted M/F Odds Ratio (95% CI) | aAdjusted M/F Odds Ratio (95% CI) | |
|---|---|---|---|---|
| PTB | 8189 (41.0) | 11 779 (59.0) | Ref | Ref |
| Abdominal TB | 121 (57.6) | 89 (42.4) | 0.51 (.39–.67) | 0.51 (.39–.68) |
| Lymphadenitis | 202 (44.6) | 251 (55.4) | 0.86 (.72–1.04) | 0.88 (.73–1.07) |
| Miliary TB | 212 (41.8) | 295 (58.2) | 0.97 (.81–1.16) | 0.95 (.79–1.14) |
| Other EPTB | 340 (50.7) | 331 (49.3) | 0.68 (.58–.79) | 0.69 (.59–.81) |
| Pericarditis | 98 (45.4) | 118 (54.6) | 0.84 (.64–1.10) | 0.84 (.64–1.10) |
| Pleural Effusion | 694 (39.1) | 1080 (60.9) | 1.08 (.98–1.20) | 1.06 (.96–1.17) |
| TB Bones/Joints/Spine | 65 (50.4) | 64 (49.6) | 0.69 (.48–.97) | 0.63 (.45–.90) |
| TB Meningitis | 150 (43.0) | 199 (57.0) | 0.92 (.75–1.14) | 1.00 (.80–1.24) |
Abbreviations: CI, confidence interval; EPTB, extrapulmonary tuberculosis; HIV, human immunodeficiency virus; PTB, pulmonary tuberculosis; TB, tuberculosis.
Adjusted for year of diagnosis, HIV status, healthcare setting, age group, and treatment history.
The adjusted model yielded similar results. The odds of abdominal TB versus PTB were lower among males compared to females after adjusting for year of diagnosis, age group, HIV serological status, treatment history, and healthcare setting (aOR = 0.51; 95% CI, .39–.68). The adjusted odds of TB bones/joints/spine (aOR = 0.63; 95% CI, .45–.90) and other EPTB (aOR = 0.69 95% CI = .59–.81) were lower among males compared to females.
DISCUSSION
A gap-focused approach to address health inequity not only reduces the absolute level of ill health but also aims to increase the rate of improvement among the disadvantaged group relative to the more advantaged group [9]. Given the communicable nature of TB, equitable improvements for all groups are key to reducing the overall burden of disease in a population. Without gender-stratified analysis, studies often leave out important information that can potentially accelerate our understanding of sex-specific pathogenesis, treatment, and prevention [20]. In this report, we characterize various dimensions of gender disparities related to the TB epidemic in a TB-HIV high-burden setting, Harare in Zimbabwe, during 2008 to 2017.
Our study found that males were at an increased risk of TB compared to females and the risk among males increased with age. Females were more likely to have EPTB at various sites including abdominal TB, TB bones/joints/spine, and other EPTB. The risk of TB-HIV coinfection was higher among females than among males in age groups: 15–24 years and 25–44 years. Although statistically insignificant, males and females experienced unequal rates of change in TB incidence and TB-HIV prevalence during the study period. Although men are widely known as a high-risk group for TB, our study suggests that it is important for TB prevention/control efforts to recognize the high burden of EPTB and TB-HIV coinfection among females.
The higher risk of TB among men in this study is corroborated by current literature that shows that generally men are twice as likely to be diagnosed with TB than women, which is possibly explained by behavioral and biological hypotheses [10, 11, 21]. Men tend to have a higher number of social contacts, work in high-risk occupations such as mining, and engage in high-risk behaviors such as smoking [21]. The biological hypothesis argues for increased genetic susceptibility to TB among men and immune responses modulated by sex hormones as possible explanations for observed gender differences [21].
There are only a few studies from high-burden or resource-limited settings that study gender differences in TB clinical presentation defined by granular categorizations of affected anatomic sites, often lacking sufficient sample size and relevant statistical analysis [22–24]. Many studies report M/F ratio among a sample of bacteriologically confirmed or smear-positive TB patients, which is likely to overrepresent PTB patients because it is the most prevalent and relatively easy to diagnose compared to EPTB [11]. We report M/F ratio specific to 9 different anatomical TB sites that showed that females were at a significantly higher risk of presenting with TB in bones/joints/spine, abdomen, and in sites captured by the “other EPTB” category compared to their risk of PTB relative to men. A recent study from Ghana, also a TB-HIV high-burden country, did not find significant differences between proportion of adult males and females affected by TB in spine, bones/joint, or abdomen, whereas a Pakistan-based study found all forms of EPTB, including abdomen, lymphatic, and osteoarticular spine TB, to be more common among females [25, 26]. This study provides a reasonably large sample size to study gender differences across multiple sites of EPTB, but we remain cautious regarding misclassification bias resulting from under- or misdiagnosis of EPTB in this resource-deficient setting.
Although men are at an increased risk of TB, women in 15- to 24-year and 25- to 44-year age groups had a greater likelihood of presenting with TB-HIV coinfection. A study from sub-Saharan Africa found women in the 25- to 29-year age group to be twice as likely to be coinfected and 5 times more likely to be HIV infected compared to men [27]. Another previous study has also found that low CD4+ cell count (<100) among EPTB-HIV-coinfected patients is associated with “severe” disease sites such as central nervous system (CNS), meningeal, or disseminated TB [28]. The higher likelihood of various forms of EPTB among females in our study may be attributable to higher HIV prevalence and low CD4+ cell count. Based on our findings, targeted and earlier access to antiretroviral therapy for young women in Harare could be crucial for controlling the TB epidemic. Although the exact cause of increased likelihood of EPTB among women remains elusive, previous studies suggest that endocrinal factors in relation to menopause may explain the increased susceptibility to EPTB among women [29–31]. Apart from biological explanations, the increased likelihood of EPTB among women may be a result of undertreatment or underdiagnosis owing to structural and social factors that impede women's access to TB care, especially in male-dominated societies [32, 33].
Based on traditional gender roles, women are generally primary caregivers and are involved in unpaid essential economic labor often involving subsistence farming in Africa [34]. The prevalence of TB-HIV coinfection among women of childbearing age poses risk of antenatal transmission and increase in child mortality trends. The disparate burden of TB-HIV coinfection among women is also a grim reflection of the prevalence of cultural, socioeconomic, behavioral, and structural risk factors that increase women's vulnerability to HIV in Africa [35]. In addition to gender inequality that limits women's access to resources such as healthcare, education, and wealth, patriarchal norms result in heightened social stigma and violent sexual practices against women that are associated with increased risk of HIV. The effect of TB-HIV coinfection burden among productive age women extends beyond their own health and affects families, communities, and the broader development of the country.
In addition to providing important information on how disease patterns evolve in a population, epidemiological trends over time can be useful in evaluating the performance of existing disease control/prevention programs. The sudden drop in TB notification in 2014 likely suggests missed cases or data reporting error that can have serious implications for public health. After removing the 2014 data point in our sensitivity analysis, the APC for TB incidence did not significantly change (APC = −13.2%; 95% CI, −9.0% to 17.2%). This high-burden population provides a unique opportunity to investigate stratified associations due to the availability of a large sample. We are limited in our ability to make inferences related to TB and HIV temporality due to the cross-sectional study design. In addition, notification data from passive surveillance does not always truly represent disease incidence and is impacted by sample selection bias.
CONCLUSIONS
Men are well recognized as a high-risk group for TB, but disaggregated gender differences reveal that women are a high-risk group for various forms of EPTB and TB-HIV coinfection. Public health strategies for TB control/prevention must recognize that women are more likely to develop severe forms of TB and TB-HIV coinfection, which may result in worse outcomes for women. Future studies should attempt to delineate the underlying drivers of these observed gender differences. Although these gender differences may be partly explained by differences in biological susceptibility, they also reflect the role of social, structural, and historical factors that drive gender inequality in Africa.
Acknowledgments
We thank Clayton DesJardin for the assistance in retrieving the study data from the TB surveillance database of Zimbabwe. We also thank the Harare City Health Department for providing access to the data used in this study. Moreover, we thank the staff, data collectors, and nurses at Beatrice Road Infectious Diseases Hospital, Wilkins Infectious Diseases Hospital, and other clinics in Harare for their contribution to the collection of patient data.
Author contributions. M. H. contributed to the study design, data analysis, interpretation of results, and drafting of the manuscript. J. C., I. M., and H. A. M. contributed to the data collection. W.Y. contributed to the data analysis. Z. Y. contributed to the study design, directed the conduction of the study, and the contributed to development of the manuscript. All the authors contributed to the revision of the manuscript and approved the final manuscript.
Financial support. This work was funded by the University of Michigan.
References
Author notes
Potential conflicts of interest. All authors: No reported conflicts of interest. All authors have submitted the ICMJE Form for Disclosure of Potential Conflicts of Interest.


Comments