


Abstract
We applied a target trial emulation framework to estimate the association between early and delayed initiation of remdesivir (RDV) with mortality in hospitalized adults between May 1, 2020, and July 31, 2024, with varying coronavirus disease 2019 (COVID-19) clinical severity.
Using electronic health records in the National COVID Cohort Collaborative (N3C) database, we emulated a sequence of randomized target trials initiated on each of the first 7 days of hospitalization. We identified 373 226 eligible person-trial hospitalizations, of which 53 959 were initiators and 319 267 were noninitiators of RDV treatment. Patients were divided into clinical severity subgroups based on baseline oxygenation, which included no supplemental oxygen (NSO), noninvasive supplemental oxygen (NISO), or invasive ventilation (IV). In each trial, initiators were matched with replacement to noninitiators receiving the same oxygenation type. Trials beginning on days 1–3 and days 4–7 of hospitalization were pooled separately to evaluate the effects of early and delayed initiation of RDV, respectively. Cox proportional hazards regression was used to estimate the marginal hazard ratio for mortality between initiators and noninitiators within each treatment delay.
Across trials, 53 449 initiators were matched to 26 600 unique noninitiators. Early, but not delayed, RDV treatment was associated with a reduction in 60-day mortality in the NSO (hazard ratio [HR], 0.89; 95% CI, 0.84–0.95) and NISO subgroups (HR, 0.91; 95% CI, 0.84–0.99), but not in those receiving IV. Results were consistent across sensitivity analyses.
Early treatment with RDV is associated with reduced mortality risk in hospitalized COVID-19 patients either not on supplemental oxygen or receiving noninvasive supplemental oxygen.
Randomized trials suggest that the antiviral remdesivir (RDV) does not lower mortality risk in adults hospitalized with coronavirus disease 2019 (COVID-19) overall [1–6] but is potentially effective in patients with certain levels of COVID-19 disease severity. The Solidarity trial reported that RDV reduced mortality risk in unventilated patients receiving supplemental oxygen, but not in patients who were ventilated or breathing room air [1]. The Adaptive COVID-19 Treatment Trial (ACTT-1) subdivided patients on supplemental oxygen into those receiving low-flow and high-flow oxygen and found reduced mortality in the low-flow oxygen group only [3].
Observational studies, in contrast, have reported that RDV was related to decreased risk of death in patients receiving mechanical ventilation [7–10], high-flow oxygen [9, 10], or no supplemental oxygen [9, 10], in addition to low-flow oxygen [9–12] at baseline. Interestingly, these studies did not explicitly apply target trial emulation principles, increasing the possibility of bias influencing results and producing findings inconsistent with randomized trials [13, 14].
Although it is recommended that RDV be administered within 7 days of symptoms [15], it is not yet known whether early treatment (ie, within the first 3 days) is equally or more effective than delayed treatment (between days 4 and 7) in this period. Wong et al. [16] showed that RDV within 2 days of admission lowered the risk of in-hospital death, although the impact of delayed treatment was not explored. Garcia et al. [17] reported larger reductions in mortality risk when RDV was given sooner (≤3 days) vs later (ie, 4 or more days) following symptom onset, although their analysis was descriptive. In another descriptive study, Paranjape et al. [18] reported lower odds of death in patients initiating RDV within 3 vs 4+ days following a positive severe acute respiratory syndrome coronavirus 2 (SARS-CoV-2) test, although the effectiveness of RDV was not tested within each interval. Importantly, no studies examined whether the impact of treatment delay on RDV effectiveness varied depending on patients’ clinical severity.
In the present study, we implemented a sequential target trial emulation (TTE) using data from the National COVID Cohort Collaborative (N3C) to examine whether early (within 3 days) or delayed treatment (between days 4 and 7) with RDV following admission was related to reduced mortality in patients hospitalized with COVID-19 with varying degrees of severity of COVID-19 illness, as determined by their supplemental oxygen needs at the time of treatment.
METHODS
Target Trial Specification
We emulated a randomized target trial that evaluated whether treatment with RDV initiated on the first day of hospitalization with COVID-19 was effective in reducing death at 60 days compared with no treatment in adults with varying levels of COVID-19 clinical severity and no prior treatment with RDV. We emulated this target trial using data from the N3C enclave. Supplementary Table 1 describes the key components of the target trial protocol.
For this target trial, baseline was the day of hospitalization. Patients were divided into clinical severity subgroups based on the type of supplemental oxygen being received at baseline, which included (i) no supplemental oxygen (NSO), (ii) noninvasive supplemental oxygenation (NISO), and (iii) invasive ventilation (IV).
The treatment strategy was defined as initiation or noninitiation of RDV treatment at baseline. The target outcome was mortality in the 60-day follow-up period beginning at baseline. The causal contrast of interest was the intention-to-treat (ITT) effect, or the comparative effect of initiating vs not initiating RDV treatment at baseline on mortality risk, irrespective of whether patients adhered to their assigned treatment strategy, and it was measured using hazard ratios. The ITT effect was estimated separately within each subgroup.
The Infectious Disease Society of America recommends treatment with RDV within 7 days of symptoms [15]. This implies that patients are eligible for treatment for 6 additional days following symptom onset. We therefore emulated the above trial for each of the next 6 days of COVID-19 hospitalization, creating a sequence of 7 “pseudo-trials” [19]. The baseline for each trial was reset to begin on the corresponding day of hospitalization (Supplementary Figure 1). We applied the above target trial design to each pseudo-trial.
Data Source
Our cohort was compiled from N3C (version 132)—a large, centralized, harmonized, and highly granular repository of electronic health records (EHRs) capturing detailed information on clinical encounters for >7.5M COVID-19-positive patients (and nearly 12M matched COVID-19-negative patients) from 75+ institutions across the United States [20]. Records in N3C are aggregated across participating clinical institutions in the United States, harmonized using the Observational Medical Outcomes Partnership (OMOP) data model, and subjected to quality review and checks.
Patient Consent
Use of N3C data for this study did not involve human subjects (45 CFR 46.102) as determined by the National Institutes of Health (NIH) Office of Institutional Review Board (IRB) Operations. Thus, this study did not include factors necessitating patient consent.
Eligibility Criteria
During our defined study period of May 1, 2020 (the Emergency Use Authorization [EUA] date for RDV), to July 30, 2024, we identified patients who were hospitalized with COVID-19, defined as having a positive SARS-CoV-2 reverse transcription polymerase chain reaction (RT-PCR) or rapid antigen detection test result within 24 hours of hospitalization and a confirmed diagnosis of COVID-19 based on the International Classification of Diseases, 10th Revision, Clinical Modification COVID-19 diagnosis code U07.1 after the positive test [21]. The day of the positive SARS-CoV-2 test was used as a proxy for symptom onset. We limited the interval between testing and hospitalization to 24 hours to minimize the number of days patients experienced symptoms before hospitalization. In so doing, we wanted to ensure that “early” or “delayed” treatment was primarily relative to when patients were hospitalized and was not confounded by patients delaying their own treatment after receiving a positive test.
Patients were excluded if they died or were discharged within 24 hours of baseline or had a recorded prescription for RDV in the EHR before baseline. We further excluded patients if they were from a health care center that shifted patients’ visit dates by >31 days, had a high proportion of missing lab data (Supplementary Data), or did not have a single patient treated with RDV during hospitalization (leaving 36 health care centers for analysis). Finally, we excluded patients who had been in their health system for <365 days prehospitalization, lacked date of birth or sex data, or did not have at least 60 days of follow-up data from baseline. These eligibility criteria were applied at baseline for each of the 7 pseudo-trials. Figure 1 displays the flow of eligible person-trials in this study.
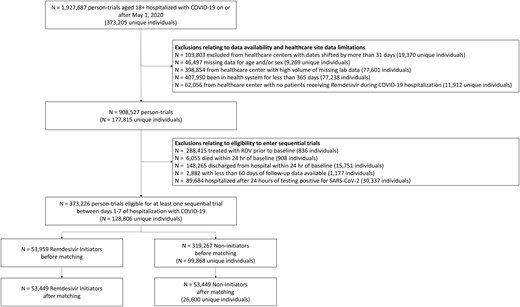
Flow diagram illustrating the eligibility of patients included in the analysis. Abbreviations: COVID-19, coronavirus disease 2019; RDV, remdesivir; SARS-CoV-2, severe acute respiratory syndrome coronavirus 2.
Treatment, Follow-up, and Outcome
For each pseudo-trial, eligible patients were classified as either initiators, who had a record of RDV prescription, or noninitiators, who had no record of RDV prescription at baseline. Treatment initiation was categorized as “early” or “delayed” relative to the day of hospitalization. Initiators who began treatment on days 1–3 of hospitalization (ie, trials 1–3) and initiators who began treatment on days 4–7 of hospitalization (ie, trials 4–7) were “early” and “delayed” initiators, respectively. In each trial, patients were followed from baseline for 60 days or until the occurrence of the primary outcome, whichever came first. The primary outcome was death, which was identified using a combination of the EHR and linked records including obituaries and government records (eg, death certificates).
Severity Subgroups
Within a given trial, patients were subdivided into clinical severity subgroups based on the type of supplemental oxygen recorded at baseline. The subgroups, in increasing severity, were (i) no supplemental oxygen, determined as the absence of any record of receiving supplemental oxygen [22]; (ii) noninvasive supplemental oxygen, based on recorded receipt of low-flow or high-flow oxygen, or noninvasive ventilation; and (iii) invasive ventilation, based on recorded receipt of mechanical ventilation and/or extracorporeal membrane oxygenation (ECMO). If a patient received multiple types of oxygenation at baseline, he or she was assigned to the more intensive type.
Sequence of Pseudo-Trials
Our emulated target trial evaluated whether noninitiation vs initiation of RDV on hospital admission day was effective in reducing death at 60 days in adults with varying degrees of clinical severity. We emulated the aforementioned trial for each of the next 6 days of COVID-19 hospitalization, producing a sequence of 7 nonrandomized pseudo-trials. Each pseudo-trial emulated the eligibility criteria and specifications of the target trial. The start of follow-up (ie, baseline) for each pseudo-trial was reinitialized to begin on the corresponding day of COVID-19 hospitalization (Supplementary Figure 1). Patients could enter each subsequent pseudo-trial if they met eligibility criteria, were still at risk, and had not initiated treatment previously [19]. Eligibility criteria for at least 1 pseudo-trial were met by 128 806 unique patients. Of these, there were 16 488 unique deaths, and 112 318 unique patients were administratively censored. After pooling patients across all trials, there were 373 226 “person-trials,” consisting of 53 959 initiators and 319 267 noninitiators, with 56 310 person-trial deaths (Supplementary Table 2).
Statistical Analysis
In a randomized trial, the ITT effect would compare mortality risk between patients assigned to receive treatment compared with no treatment using an effect measure such as the hazard ratio (HR). To estimate the observational analog of the ITT effect of receiving RDV vs no treatment among patients with different levels of COVID-19 disease severity from our sequence of pseudo-trials, we used a matched cohort design to emulate the balance achieved through randomization. As described, a new pseudo-trial began on each of the first 7 days of COVID-19 hospitalization. Noninitiators were selected as matches for initiators within a given trial if at baseline they met eligibility criteria, were still alive, had not yet received RDV, and had the most similar distribution of background characteristics as the initiator.
To achieve this, we implemented longitudinal matching [19, 23, 24]. This involved first fitting a propensity score model using discrete time survival analysis [25–27], which estimated patients’ propensity of receiving RDV on each day of hospitalization through day 7. The model included a range of time-invariant and time-varying covariates based on prior research and clinical expertise, including demographics, comorbidities, medications, COVID-19 variant (based on the date of patients’ positive SARS-CoV-2 test), and relevant lab measurements (Supplementary Data). We performed extensive preprocessing of the lab data due to missing values and implemented variable selection to ensure that only relevant confounders were included in the propensity score model (Supplementary Data) [28, 29]. After fitting the model, we obtained predicted hazard probabilities for each patient-day, which we converted to log odds.
We then applied longitudinal matching using sequential 1:1 greedy matching with replacement and a caliper of 0.1 SDs [30] using the Matchit package in R (version 4.5.4). Within each trial, eligible initiators were matched 1-to-1 with eligible noninitiators having the most similar log odds of initiating RDV at baseline for that trial (Supplementary Data). Matching with replacement allowed noninitiators to be matched to multiple initiators within a given trial. During the matching process, we applied a constraint where initiators and noninitiators were exact-matched on the supplemental oxygen type they received at baseline, which enabled subgroup analyses. Balance on baseline covariates before and after matching was evaluated using absolute standardized mean differences (SMDs) [31].
After matching, we used univariate Cox regression to estimate the ITT effect of early and delayed RDV treatment on the risk of mortality in each subgroup. To estimate the ITT effect of early treatment, we pooled pseudo-trials 1–3 where treatment was initiated on days 1–3 of hospitalization. To estimate the ITT effect of delayed treatment, we pooled pseudo-trials 4–7, where treatment was initiated between days 4 and 7 of hospitalization. We additionally pooled pseudo-trials 1–7 to examine the overall ITT effect of receiving RDV within the first 7 days of hospitalization. Univariate Cox regressions were fit within each combination of subgroup and treatment delay. Standard errors were adjusted to account for replacement [29].
Sensitivity Analyses
We first repeated the main analysis treating time to 30-day mortality as the outcome. We then performed 8 sensitivity analyses to test the robustness of results to variations in study parameters. First, we examined the impact of using nearest-neighbor matching without a caliper to test sensitivity of results to the matching approach. In the second, third, and fourth sensitivity analyses, we excluded the following: patients who were in the health system for <180 days (vs 365 days), patients from health care centers with shifted dates, and patients from health care centers with <10 patients treated, respectively. Fifth, we included all patients in the analysis who were hospitalized up to 14 days following a positive SARS-CoV-2 test [21]. Sixth, we recoded clinical severity as a nonreversible step function, meaning that once a patient received a form of supplemental oxygen, he or she was assumed to remain on that oxygen type if there was no change. Seventh, we modified the severity subgroups to match the Solidarity trial [1], whereby patients receiving noninvasive ventilation were transferred from the NISO to the IV subgroup. In the final analysis, we excluded patients on renal replacement therapy at baseline given the lack of a label for RDV in this population until 2023 [32].
RESULTS
Patients
In the analysis cohort, we identified 53 959 eligible person-trial initiators of RDV treatment and 319 267 eligible person-trial noninitiators. Before matching, the average age (SD) of initiators was 67.9 (16.2) years, compared with 65.0 (18.3) years among noninitiators. Sex was similarly distributed between treatment groups.
From the eligible pool of person-trials, 53 449 RDV initiators (31 167 NSO, 19 992 NISO, 2290 NIV) were matched to the same number of noninitiators (26 600 unique patients) (Figure 1). A total of 47 989 matched pairs (27 216 NSO, 18 598 NISO, and 2175 MV-ECMO) entered Trials 1–3 (ie, early treatment), and the remaining 5460 matched pairs (3951 NSO, 1394 NISO, and 115 MV-ECMO) entered trials 4–7 (ie, delayed treatment). Baseline characteristics before and after matching are displayed in Table 1 for the overall cohort and in Supplementary Table 3A–C for each subgroup. For all subgroups, the absolute standardized mean differences (SMDs) for all covariates were <0.1 after matching (Supplementary Figure 2).
Characteristics of Patients and Standardized Mean Differences for Baseline Covariates Before and After Propensity Score Matching
| Before Matching | After Matching | |||||
|---|---|---|---|---|---|---|
| Variable | Noninitiators | Initiators | SMD | Noninitiators | Initiators | SMD |
| Treatment group | 319 267 (100) | 53 959 (100) | 53 449 (100) | 53 449 (100) | ||
| Died | 48 320 (15.13) | 7990 (14.81) | 8428 (15.77) | 7871 (14.73) | ||
| Invasive ventilation | 6503 (2.04) | 2358 (4.37) | 2290 (4.28) | 2290 (4.28) | ||
| Noninvasive supplemental oxygen | 41 094 (12.87) | 21 586 (40) | 21 187 (39.64) | 21 310 (39.87) | ||
| Invasive ventilation | 6503 (2.04) | 2358 (4.37) | 2290 (4.28) | 2290 (4.28) | ||
| Female | 161 285 (50.52) | 26 888 (49.83) | 0.014 | 26 608 (49.78) | 26 655 (49.87) | 0.002 |
| Age at admission, y | 64.95 (18.3) | 67.91 (16.21) | 0.182 | 68.07 (16.22) | 67.91 (16.22) | 0.01 |
| Race/ethnicity | ||||||
| Native Hawaiian and Pacific Islander | 2494 (0.78) | 476 (0.88) | 0.011 | 375 (0.7) | 474 (0.89) | 0.02 |
| White | 195 696 (61.3) | 34 680 (64.27) | 0.062 | 34 129 (63.85) | 34 349 (64.27) | 0.009 |
| Hispanic or Latino | 30 329 (9.5) | 5180 (9.6) | 0.003 | 5188 (9.71) | 5145 (9.63) | 0.003 |
| American Indian and Alaska native | 2090 (0.65) | 428 (0.79) | 0.016 | 476 (0.89) | 426 (0.8) | 0.011 |
| Black | 65 541 (20.53) | 9697 (17.97) | 0.067 | 9911 (18.54) | 9584 (17.93) | 0.016 |
| Asian | 8855 (2.77) | 1752 (3.25) | 0.027 | 1637 (3.06) | 1733 (3.24) | 0.01 |
| Total visits at health care center | 77.98 (92.95) | 95.44 (116.44) | 0.15 | 96.63 (116.25) | 95.12 (116.13) | 0.013 |
| Total hospitalizations | 2.77 (3.78) | 2.55 (3.95) | 0.057 | 2.58 (3.94) | 2.54 (3.93) | 0.011 |
| Days in health system | 1142.47 (444.76) | 1168.44 (473.29) | 0.055 | 1175.26 (473.68) | 1168.09 (473.93) | 0.015 |
| CCI score | 3.71 (3.2) | 3.89 (3.18) | 0.056 | 3.96 (3.17) | 3.88 (3.18) | 0.026 |
| Vaccinated | 84 257 (26.39) | 14 199 (26.31) | 0.002 | 14 020 (26.23) | 14 020 (26.23) | <0.001 |
| Vaccine dose number | 0.63 (1.16) | 0.63 (1.18) | 0.006 | 0.63 (1.17) | 0.63 (1.18) | 0.004 |
| Prebaseline exposure to low-flow oxygen | 42 828 (13.41) | 11 036 (20.45) | 0.174 | 10 788 (20.18) | 10 870 (20.34) | 0.004 |
| Prebaseline exposure to high-flow oxygen | 71 176 (22.29) | 18 306 (33.93) | 0.246 | 18 189 (34.03) | 18 042 (33.76) | 0.006 |
| Prebaseline exposure to invasive ventilation | 28 786 (9.02) | 4134 (7.66) | 0.051 | 4049 (7.58) | 4057 (7.59) | <0.001 |
| Prebaseline exposure to noninvasive supplemental oxygen | 84 546 (26.48) | 21 166 (39.23) | 0.261 | 20 816 (38.95) | 20 865 (39.04) | 0.002 |
| Prebaseline exposure to invasive ventilation | 28 786 (9.02) | 4134 (7.66) | 0.051 | 4049 (7.58) | 4057 (7.59) | <0.001 |
| BMI category | ||||||
| Underweight | 10 583 (3.31) | 1536 (2.85) | 0.028 | 1562 (2.92) | 1520 (2.84) | 0.005 |
| Normal weight | 59 532 (18.65) | 9311 (17.26) | 0.037 | 9274 (17.35) | 9234 (17.28) | 0.002 |
| Overweight | 65 083 (20.39) | 12 116 (22.45) | 0.05 | 12 173 (22.77) | 11 984 (22.42) | 0.008 |
| Obese | 73 506 (23.02) | 15 517 (28.76) | 0.127 | 15 329 (28.68) | 15 352 (28.72) | <0.001 |
| Obese class 3 | 28 356 (8.88) | 6763 (12.53) | 0.11 | 6857 (12.83) | 6701 (12.54) | 0.009 |
| Missing BMI | 82 207 (25.75) | 8716 (16.15) | 0.261 | 8254 (15.44) | 8658 (16.2) | 0.021 |
| Multisystem inflammatory syndrome in children | 78 (0.02) | <20a | 0.006 | <20 | <20 | 0.006 |
| Pneumonia due to COVID-19 | 51 324 (16.08) | 11 896 (22.05) | 0.144 | 11 201 (20.96) | 11 661 (21.82) | 0.021 |
| Obesity | 158 453 (49.63) | 31 312 (58.03) | 0.17 | 31 256 (58.48) | 30 992 (57.98) | 0.01 |
| Pregnancy | 11 864 (3.72) | 847 (1.57) | 0.173 | 846 (1.58) | 838 (1.57) | 0.001 |
| Tobacco smoker | 61 901 (19.39) | 11 007 (20.4) | 0.025 | 11 132 (20.83) | 10 903 (20.4) | 0.011 |
| Renal replacement therapy | 2849 (0.89) | 352 (0.65) | 0.03 | 363 (0.68) | 350 (0.65) | 0.003 |
| Solid organ or blood stem cell transplant | 4136 (1.3) | 1199 (2.22) | 0.063 | 1300 (2.43) | 1186 (2.22) | 0.014 |
| Cardiomyopathies | 38 820 (12.16) | 6881 (12.75) | 0.018 | 7062 (13.21) | 6800 (12.72) | 0.015 |
| Cerebrovascular disease | 51 309 (16.07) | 9248 (17.14) | 0.028 | 9130 (17.08) | 9136 (17.09) | <0.001 |
| Chronic lung disease | 118 183 (37.02) | 23 848 (44.2) | 0.145 | 23 798 (44.52) | 23 590 (44.14) | 0.008 |
| Congestive heart failure | 76 489 (23.96) | 14 127 (26.18) | 0.051 | 14 207 (26.58) | 13 960 (26.12) | 0.011 |
| Coronary artery disease | 88 610 (27.75) | 16 565 (30.7) | 0.064 | 16 701 (31.25) | 16 373 (30.63) | 0.013 |
| Dementia | 37 361 (11.7) | 5996 (11.11) | 0.019 | 5930 (11.09) | 5931 (11.1) | <0.001 |
| Depression | 86 762 (27.18) | 14 667 (27.18) | <0.001 | 14 607 (27.33) | 14 511 (27.15) | 0.004 |
| Diabetes mellitus–complicated | 105 102 (32.92) | 18 113 (33.57) | 0.014 | 18 198 (34.05) | 17 907 (33.5) | 0.012 |
| Diabetes mellitus–uncomplicated | 127 848 (40.04) | 22 237 (41.21) | 0.024 | 22 427 (41.96) | 22 002 (41.16) | 0.016 |
| Down syndrome | 82 (0.03) | <20 | 0.004 | <20 | <20 | <0.001 |
| Asthma | 40 179 (12.58) | 8011 (14.85) | 0.064 | 8083 (15.12) | 7921 (14.82) | 0.009 |
| Chronic kidney disease | 105 190 (32.95) | 17 773 (32.94) | <0.001 | 18 556 (34.72) | 17 559 (32.85) | 0.04 |
| Hematologic cancer | 11 515 (3.61) | 2706 (5.01) | 0.065 | 2683 (5.02) | 2675 (5) | <0.001 |
| Heart failure | 95 752 (29.99) | 17 507 (32.45) | 0.052 | 17 516 (32.77) | 17 302 (32.37) | 0.009 |
| Hemiplegia or paraplegia | 20 901 (6.55) | 3242 (6.01) | 0.023 | 3266 (6.11) | 3204 (5.99) | 0.005 |
| HIV infection | 3562 (1.12) | 503 (0.93) | 0.019 | 490 (0.92) | 500 (0.94) | 0.002 |
| Hypertension | 225 584 (70.66) | 40 491 (75.04) | 0.101 | 40 575 (75.91) | 40 079 (74.99) | 0.021 |
| Kidney disease | 112 052 (35.1) | 18 852 (34.94) | 0.003 | 19 664 (36.79) | 18 623 (34.84) | 0.041 |
| Malignant cancer | 58 891 (18.45) | 11 900 (22.05) | 0.087 | 11 795 (22.07) | 11 759 (22) | 0.002 |
| Metastatic solid tumor cancers | 4971 (1.56) | 996 (1.85) | 0.021 | 954 (1.78) | 983 (1.84) | 0.004 |
| Mild liver disease | 39 566 (12.39) | 6323 (11.72) | 0.021 | 6240 (11.67) | 6260 (11.71) | 0.001 |
| Moderate to severe liver disease | 17 087 (5.35) | 2152 (3.99) | 0.07 | 2197 (4.11) | 2120 (3.97) | 0.007 |
| Myocardial infarction | 52 084 (16.31) | 9278 (17.19) | 0.023 | 9328 (17.45) | 9164 (17.15) | 0.008 |
| Other immuno-compromised condition | 64 014 (20.05) | 12 617 (23.38) | 0.079 | 12 776 (23.9) | 12 442 (23.28) | 0.015 |
| Peptic ulcer | 14 917 (4.67) | 2463 (4.56) | 0.005 | 2578 (4.82) | 2428 (4.54) | 0.013 |
| Peripheral vascular disease | 47 507 (14.88) | 8421 (15.61) | 0.02 | 8331 (15.59) | 8313 (15.55) | <0.001 |
| Psychosis | 17 062 (5.34) | 1576 (2.92) | 0.144 | 1583 (2.96) | 1553 (2.91) | 0.003 |
| Pulmonary embolism | 17 470 (5.47) | 3286 (6.09) | 0.026 | 3405 (6.37) | 3237 (6.06) | 0.013 |
| Rheumatologic disease | 47 085 (14.75) | 9287 (17.21) | 0.065 | 9863 (18.45) | 9182 (17.18) | 0.034 |
| Sickle cell disease | 2027 (0.63) | 308 (0.57) | 0.009 | 239 (0.45) | 304 (0.57) | 0.016 |
| Stroke | 39 823 (12.47) | 6134 (11.37) | 0.035 | 6009 (11.24) | 6070 (11.36) | 0.004 |
| Substance abuse | 36 740 (11.51) | 4009 (7.43) | 0.155 | 4088 (7.65) | 3968 (7.42) | 0.009 |
| Thalassemia | 544 (0.17) | 102 (0.19) | 0.004 | 104 (0.19) | 101 (0.19) | 0.001 |
| Tuberculosis | 768 (0.24) | 137 (0.25) | 0.003 | 150 (0.28) | 136 (0.25) | 0.005 |
| Adalimumab | 1310 (0.41) | 240 (0.44) | 0.005 | 234 (0.44) | 238 (0.45) | 0.001 |
| Anakinra | 200 (0.06) | 40 (0.07) | 0.004 | 54 (0.1) | 38 (0.07) | 0.011 |
| Antibiotics | 227 214 (71.17) | 40 371 (74.82) | 0.084 | 40 326 (75.45) | 39 926 (74.7) | 0.017 |
| Anticoagulants | 157 982 (49.48) | 27 474 (50.92) | 0.029 | 27 547 (51.54) | 27 131 (50.76) | 0.016 |
| Azithromycin | 76 366 (23.92) | 15 838 (29.35) | 0.119 | 15 565 (29.12) | 15 624 (29.23) | 0.002 |
| Baricitinib | 2316 (0.73) | 89 (0.16) | 0.138 | 85 (0.16) | 85 (0.16) | <0.001 |
| Bebtelovimab | 722 (0.23) | 52 (0.1) | 0.042 | 91 (0.17) | 49 (0.09) | 0.026 |
| Benzodiazepines | 91 536 (28.67) | 15 213 (28.19) | 0.011 | 14 994 (28.05) | 15 015 (28.09) | <0.001 |
| Bupropion | 15 539 (4.87) | 2696 (5) | 0.006 | 2561 (4.79) | 2654 (4.97) | 0.008 |
| Casirivimab/imdevimab | 990 (0.31) | 125 (0.23) | 0.016 | 133 (0.25) | 119 (0.22) | 0.006 |
| Certolizumab | 95 (0.03) | 31 (0.06) | 0.012 | 26 (0.05) | 31 (0.06) | 0.004 |
| Chlorpromazine | 1946 (0.61) | 224 (0.42) | 0.03 | 206 (0.39) | 220 (0.41) | 0.004 |
| Citalopram | 12 276 (3.85) | 2049 (3.8) | 0.002 | 2174 (4.07) | 2026 (3.79) | 0.014 |
| Corticosteroids | 161 781 (50.67) | 32 533 (60.29) | 0.197 | 32 589 (60.97) | 32 139 (60.13) | 0.017 |
| Dexamethasone | 95 658 (29.96) | 19 921 (36.92) | 0.144 | 19 435 (36.36) | 19 631 (36.73) | 0.008 |
| Dextromethorphan | 24 764 (7.76) | 5065 (9.39) | 0.056 | 5067 (9.48) | 4982 (9.32) | 0.005 |
| Infliximab | 645 (0.2) | 141 (0.26) | 0.012 | 112 (0.21) | 138 (0.26) | 0.01 |
| Escitalopram | 20 412 (6.39) | 3313 (6.14) | 0.011 | 3170 (5.93) | 3269 (6.12) | 0.008 |
| Etanrecept | 429 (0.13) | 101 (0.19) | 0.012 | 131 (0.25) | 99 (0.19) | 0.014 |
| Evusheld | 550 (0.17) | 239 (0.44) | 0.041 | 227 (0.42) | 238 (0.45) | 0.003 |
| Fluoxetine | 13 026 (4.08) | 1892 (3.51) | 0.031 | 1950 (3.65) | 1879 (3.52) | 0.007 |
| Fluphenazine | 695 (0.22) | 42 (0.08) | 0.05 | 52 (0.1) | 42 (0.08) | 0.007 |
| Fluvoxamine | 398 (0.12) | 62 (0.11) | 0.003 | 62 (0.12) | 60 (0.11) | 0.001 |
| Glucocorticoids | 182 591 (57.19) | 35 835 (66.41) | 0.195 | 35 768 (66.92) | 35 419 (66.27) | 0.014 |
| Golimumab | 104 (0.03) | 26 (0.05) | 0.007 | 32 (0.06) | 26 (0.05) | 0.005 |
| Haloperidol | 35 668 (11.17) | 5798 (10.75) | 0.014 | 5801 (10.85) | 5724 (10.71) | 0.005 |
| Heparin | 119 676 (37.48) | 21 225 (39.34) | 0.038 | 21 429 (40.09) | 20 951 (39.2) | 0.018 |
| Hydrocortisone | 18 402 (5.76) | 3623 (6.71) | 0.038 | 3637 (6.8) | 3577 (6.69) | 0.004 |
| Hydroxychloroquine | 4983 (1.56) | 1006 (1.86) | 0.022 | 999 (1.87) | 996 (1.86) | <0.001 |
| Hydroxyzine | 37 241 (11.66) | 5246 (9.72) | 0.066 | 5228 (9.78) | 5182 (9.7) | 0.003 |
| Immunosuppressants | 38 723 (12.13) | 8735 (16.19) | 0.11 | 8906 (16.66) | 8620 (16.13) | 0.015 |
| Ivermectin | 1085 (0.34) | 208 (0.39) | 0.007 | 245 (0.46) | 207 (0.39) | 0.011 |
| Methylprednisolone | 58 203 (18.23) | 12 472 (23.11) | 0.116 | 12 631 (23.63) | 12 334 (23.08) | 0.013 |
| Molnupiravir | 486 (0.15) | 95 (0.18) | 0.006 | 100 (0.19) | 94 (0.18) | 0.003 |
| Paroxetine | 5396 (1.69) | 891 (1.65) | 0.003 | 819 (1.53) | 880 (1.65) | 0.009 |
| Paxlovid | 2411 (0.76) | 330 (0.61) | 0.018 | 425 (0.8) | 324 (0.61) | 0.024 |
| Pentazocine | <20 | <20 | 0.006 | <20 | <20 | 0.004 |
| Perphenazine | 371 (0.12) | 27 (0.05) | 0.03 | 32 (0.06) | 26 (0.05) | 0.005 |
| Pimozide | 22 (0.01) | <20 | <0.001 | <20 | <20 | 0.009 |
| Prednisone | 76 893 (24.08) | 17 053 (31.6) | 0.162 | 17 317 (32.4) | 16 873 (31.57) | 0.018 |
| Quinolones | 72 778 (22.8) | 14 231 (26.37) | 0.081 | 14 373 (26.89) | 14 069 (26.32) | 0.013 |
| Sarilumab | 96 (0.03) | <20 | 0.015 | <20 | <20 | 0.016 |
| Sertaline | 28 026 (8.78) | 4463 (8.27) | 0.018 | 4547 (8.51) | 4413 (8.26) | 0.009 |
| Selective norepinephrine reuptake inhibitors | 32 491 (10.18) | 5724 (10.61) | 0.014 | 5755 (10.77) | 5666 (10.6) | 0.005 |
| Sotrovimab | 374 (0.12) | 40 (0.07) | 0.016 | 33 (0.06) | 38 (0.07) | 0.004 |
| Systemic corticosteroids | 168 575 (52.8) | 33 725 (62.5) | 0.2 | 33 668 (62.99) | 33 329 (62.36) | 0.013 |
| Tamoxifen | 712 (0.22) | 150 (0.28) | 0.01 | 129 (0.24) | 149 (0.28) | 0.007 |
| Tocilizumab | 2082 (0.65) | 180 (0.33) | 0.055 | 203 (0.38) | 175 (0.33) | 0.009 |
| Tofacitinib | 429 (0.13) | 93 (0.17) | 0.009 | 78 (0.15) | 92 (0.17) | 0.006 |
| Tricyclic antidepressants | 14 414 (4.51) | 2651 (4.91) | 0.018 | 2635 (4.93) | 2636 (4.93) | <0.001 |
| Trifluoperazine | 58 (0.02) | <20 | <0.001 | <20 | <20 | 0.008 |
| Upadacitinib | 127 (0.04) | <20 | 0.004 | 20 (0.04) | <20 | 0.002 |
| Vasopressors | 94 817 (29.7) | 18 292 (33.9) | 0.089 | 18 236 (34.12) | 18 043 (33.76) | 0.008 |
| Lab values | ||||||
| White blood cells–high | 55 843 (17.49) | 7283 (13.5) | 0.117 | 7291 (13.64) | 7196 (13.46) | 0.005 |
| White blood cells–low | 45880 (14.37) | 7310 (13.55) | 0.024 | 7098 (13.28) | 7191 (13.45) | 0.005 |
| White blood cells–normal | 194 476 (60.91) | 34 340 (63.64) | 0.057 | 34 265 (64.11) | 34 044 (63.69) | 0.009 |
| Lymphocytes–high | 118 532 (37.13) | 19 634 (36.39) | 0.015 | 19 754 (36.96) | 19 336 (36.18) | 0.016 |
| Lymphocytes–low | 2499 (0.78) | 512 (0.95) | 0.017 | 397 (0.74) | 511 (0.96) | 0.022 |
| Lymphocytes–normal | 161 570 (50.61) | 27 001 (50.04) | 0.011 | 26 778 (50.1) | 26 809 (50.16) | 0.001 |
| Albumin–high | 165 (0.05) | 20 (0.04) | 0.008 | <20 | 20 (0.04) | 0.006 |
| Albumin–low | 111 488 (34.92) | 12 510 (23.18) | 0.278 | 12 372 (23.15) | 12 312 (23.04) | 0.003 |
| Albumin–normal | 173 297 (54.28) | 34 186 (63.36) | 0.188 | 34 282 (64.14) | 33 903 (63.43) | 0.015 |
| Alanine aminotransferase–high | 31 013 (9.71) | 3621 (6.71) | 0.12 | 3505 (6.56) | 3565 (6.67) | 0.004 |
| Alanine aminotransferase–low | 10 182 (3.19) | 1248 (2.31) | 0.058 | 1264 (2.36) | 1236 (2.31) | 0.003 |
| Alanine aminotransferase–normal | 250 516 (78.47) | 41 916 (77.68) | 0.019 | 41 941 (78.47) | 41 502 (77.65) | 0.02 |
| Estimated glomerular filtration rate–low | 45 827 (14.35) | 5290 (9.8) | 0.153 | 5733 (10.73) | 5236 (9.8) | 0.031 |
| Estimated glomerular filtration rate–normal | 232 042 (72.68) | 40 147 (74.4) | 0.039 | 39 499 (73.9) | 39 719 (74.31) | 0.009 |
| Platelets–high | 9247 (2.9) | 1096 (2.03) | 0.061 | 1118 (2.09) | 1088 (2.04) | 0.004 |
| Platelets–low | 65 088 (20.39) | 9921 (18.39) | 0.052 | 10 039 (18.78) | 9771 (18.28) | 0.013 |
| Platelets–normal | 227 509 (71.26) | 37 798 (70.05) | 0.026 | 37 341 (69.86) | 37 454 (70.07) | 0.005 |
| Creatinine–high | 8268 (2.59) | 825 (1.53) | 0.086 | 923 (1.73) | 815 (1.52) | 0.016 |
| Creatinine–low | 11 294 (3.54) | 1279 (2.37) | 0.077 | 1227 (2.3) | 1257 (2.35) | 0.004 |
| Creatinine–normal | 274 616 (86.01) | 46 859 (86.84) | 0.024 | 46 451 (86.91) | 46 390 (86.79) | 0.003 |
| Hemoglobin–high | 3951 (1.24) | 1074 (1.99) | 0.054 | 905 (1.69) | 1064 (1.99) | 0.021 |
| Hemoglobin–low | 168 567 (52.8) | 22 609 (41.9) | 0.221 | 22 763 (42.59) | 22 340 (41.8) | 0.016 |
| Hemoglobin–normal | 123 724 (38.75) | 25 250 (46.79) | 0.161 | 24 876 (46.54) | 25 028 (46.83) | 0.006 |
Abbreviations: BMI, body mass index; CCI, Charlson comorbidity index; COVID-19, coronavirus disease 2019; RDV, remdesivir; SMD, standardized mean difference.
aAs per N3C policy, counts <20 have been concealed to preserve patient privacy.
Main Findings
Marginal hazard ratios (and 95% CIs) for 60-day mortality between initiators and matched noninitiators in each group for early and delayed treatment and corresponding mortality counts are displayed in Table 2. For early treatment, the risk of 60-day mortality was lower in initiators than noninitiators for the NSO (HR, 0.89; 95% CI, 0.84–0.95) (Figures 2A and 3A) and NISO (HR, 0.91; 95% CI, 0.84–0.99) (Figures 2A and 3B) subgroups, but not the IV subgroup (HR, 0.96; 95% CI, 0.85–1.090 (Figures 2A and 3C). For delayed treatment, there was no significant difference in the risk of mortality between initiators and noninitiators in any subgroup (Figures 2B and 3A–C).

Hazard ratios and 95% CIs adjusted for matching with replacement from subgroup-specific univariate Cox proportional hazard models comparing 60-day mortality between noninitiators and initiators of (A) early treatment between days 1 and 3 of hospitalization, (B) delayed treatment between days 4 and 7 of hospitalization, and (C) treatment between days 1 and 7 of hospitalization. Abbreviations: IV, invasive ventilation; NISO, noninvasive supplemental oxygen; NSO, no supplemental oxygen.
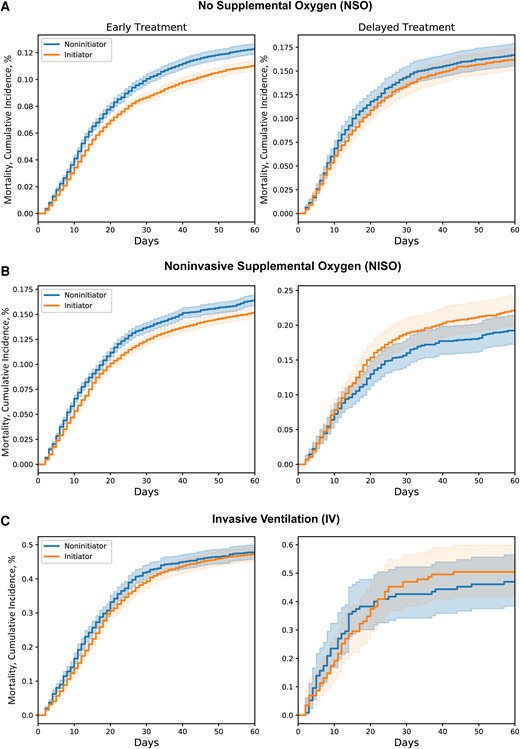
Cumulative incidence curves for 60-day mortality for noninitiators and initiators of early treatment between days 1 and 3 and delayed treatment between days 4 and 7 of hospitalization in patients requiring (A) no supplemental oxygen, (B) noninvasive supplemental oxygen, or (C) invasive ventilation at baseline.
Adjusted Hazard Ratios and 95% CIs for 60-Day Mortality From the Main Analysis and Corresponding Death Counts and Proportions
| Subgroup | Treatment Delay | Hazard Ratio; 95% CI | At Risk | Died | % | At Risk | Died | % |
|---|---|---|---|---|---|---|---|---|
| Initiators | Noninitiators | |||||||
| NSO | Early (days 1–3) | 0.89; 0.84–0.95a | 27 216 | 3010 | 11.1 | 27 216 | 3345 | 12.3 |
| Delayed (days 4–7) | 0.96; 0.85–1.08 | 3951 | 640 | 16.2 | 3951 | 660 | 16.7 | |
| Overall (days 1–7) | 0.9; 0.86–0.94a | 31 167 | 3650 | 11.7 | 31 167 | 4005 | 12.9 | |
| NISO | Early (days 1–3) | 0.91; 0.84–0.99a | 18 598 | 2825 | 15.2 | 18 598 | 3061 | 16.5 |
| Delayed (days 4–7) | 1.17; 0.98–1.4 | 1394 | 309 | 22.2 | 1394 | 269 | 19.3 | |
| Overall (days 1–7) | 0.93; 0.89–0.98a | 19 992 | 3134 | 15.7 | 19 992 | 3330 | 16.7 | |
| IV | Early (days 1–3) | 0.96; 0.85–1.09 | 2175 | 1029 | 47.3 | 2175 | 1039 | 47.8 |
| Delayed (days 4–7) | 1.07; 0.72–1.57 | 115 | 58 | 50.4 | 115 | 54 | 47.0 | |
| Overall (days 1–7) | 0.96; 0.89–1.05 | 2290 | 1087 | 47.5 | 2290 | 1093 | 47.7 | |
Abbreviations: IV, invasive ventilation; NIV, noninvasive supplemental oxygen; NSO, no supplemental oxygen.
aStatistically significant.
Pooled across trials (ie, RDV treatment on days 1–7 of hospitalization), the risk of mortality was lower for initiators than noninitiators in the NSO (HR, 0.9; 95% CI, 0.86–0.94) and NISO (HR, 0.93; 95% CI, 0.89–0.98) subgroups, but not the IV subgroup (HR, 0.96; 95% CI, 0.89–1.05) (Figure 2C). Results for 30-day mortality were consistent with the main findings above (Supplementary Table 4).
Sensitivity Analyses
The direction and magnitude of the above results were consistent across sensitivity analyses for all subgroups (Supplementary Table 4, Supplementary Figure 3A–C). There was 1 discrepant result, where early RDV treatment was associated with lower mortality for the IV subgroup when the analysis included patients who had been in their health systems for a minimum of 180 days.
DISCUSSION
Initiation of RDV within 3 days of hospitalization with COVID-19 was related to a lower risk of death at 60 days in adult patients either not on supplemental oxygen or on noninvasive supplemental oxygen (ie, low- or high-flow oxygen), but not in those receiving invasive ventilation at the time of treatment. Initiation of RDV between the fourth and seventh days of hospitalization, however, was unrelated to mortality in any clinical severity subgroup. The results were consistent for the vast majority of sensitivity analyses, indicating robustness of the obtained estimates.
Randomized studies have not explicitly reported greater reductions in mortality risk with early vs delayed treatment, although this may be due to pooling patients with varying degrees of clinical severity [2, 33]. On the other hand, observational studies have reported significant reductions in mortality risk attributable to RDV with early, but not delayed, treatment, although these studies were either descriptive or did not apply TTE principles [16–18, 34, 35]. Using the methodologically superior TTE approach, we found that early, but not delayed, RDV treatment was related to lower mortality in hospitalized COVID-19 patients receiving or not receiving supplemental oxygen at the time of treatment. Still unclear, however, is whether “early” or “delayed” treatment is in relation to symptom onset, admission, or both. Across randomized and observational studies, RDV has been shown to be associated with decreased mortality risk when administered within 12 days following symptom onset [1, 3, 16, 17, 34], and within 3 days of hospital admission [1, 3, 16]. Similarly, in the present study, early treatment occurred within the first 3 days of hospitalization, and all patients were admitted within 24 hours of a positive SARS-CoV-2 test, which typically occurs within 2 (range, 0–14) days following symptom onset [36]. Collectively, the findings suggest that RDV should be administered soon following symptom onset and even sooner following admission.
In terms of the effects of RDV within specific subgroups of patients, our results are broadly consistent with randomized trials. The Solidarity trial found that RDV was associated with lower mortality for patients on supplemental (ie, low- or high-flow) oxygen who were not ventilated, but not in patients receiving noninvasive or invasive (including mechanical) ventilation at study enrollment [1], a finding reinforced by a recent systematic review [37]. The ACTT-1 trial similarly reported lowered risk of mortality in treated vs untreated patients requiring low-flow oxygen and no treatment effect in patients receiving mechanical ventilation or ECMO at baseline [3]. They did not find, however, any benefit of RDV in a combined group of patients on high-flow oxygen or noninvasive ventilation. Together with our findings, this suggests that RDV received within the first 3 days of hospitalization may be effective for patients who require supplemental oxygen and are not in critical condition [33, 37].
Interestingly, we found that RDV was related to decreased mortality in patients not requiring supplemental oxygen at baseline, which diverges from randomized studies [37]. It could be that our NSO group was considerably large, and thus sufficiently powered to detect even small effect sizes in this group. Alternatively, our NSO subgroup may have been sicker than those in previous trials. Indeed, a certain percentage of our NSO cohort had prebaseline exposure to supplemental oxygen (Supplementary Table 3A), suggesting that their symptoms were sufficiently severe to warrant (and thus benefit from) RDV [37]. Further investigations are needed to determine if RDV is effective in patients not currently on, but who may have received, supplemental oxygen before treatment.
In line with randomized studies [33, 37], we found no benefit of early or delayed RDV treatment in patients receiving invasive oxygenation (ie, mechanical ventilation or ECMO). Several observational studies, however, reported that RDV lowered mortality risk among such patients [7–10]. Critically, none employed a TTE approach, meaning it is possible that results were influenced by selection and/or immortal time biases [38]. By applying a TTE method in the present study, we obtained results consistent with randomized trials, increasing confidence in our conclusion that RDV administration, whether early or delayed, is unlikely to prevent death among patients receiving invasive ventilation.
This study had several strengths. We examined the relationship between RDV and mortality in a large, diverse, and nationwide cohort of COVID-19 patients in N3C. Furthermore, we applied a TTE with longitudinal matching to minimize selection biases and applied a sequential trial approach to minimize immortal time biases. The use of sequential trials mitigates immortal time bias by ensuring that baseline, eligibility, and treatment ascertainment are all aligned [39]. Finally, we included a diverse range of clinically relevant covariates in the propensity score model, implemented variable selection to ensure that the model only included true confounders, and performed matching with replacement to minimize the number of treated patients who were discarded due to nonmatches.
There were, however, some limitations. First, the proportion of patients receiving delayed compared with early treatment was small (Supplementary Table 5); therefore, the nonsignificant results pertaining to delayed treatment may have been due to insufficient power, especially in the NISO and IV groups. This is not likely, however, for 3 reasons. First, within each subgroup, there were ≥200 patients included in the delayed treatment analysis. Second, the NSO group included >2000 delayed initiators, and no significant association between RDV and mortality was found. Finally, we performed a sensitivity analysis where we combined patients on noninvasive and invasive ventilation, which increased the number of delayed initiators in the IV group to 492, and still no significant association emerged.
We found a discrepant result where early RDV was associated with lower mortality in the IV subgroup when the analysis cohort included patients who had only been in their health system for a minimum of 6 months (vs 1 year), which equates to a shorter lookback period for capturing baseline health conditions. This may have led to insufficient adjustment of potential confounders, thus producing these discrepant results. This reinforces the importance of real-world studies having sufficient pretreatment covariate data to obtain unbiased results. Relatedly, we cannot completely rule out unobserved confounding even though we used a TTE method. As described, we found that RDV was associated with lower mortality in NSO patients, which, although consistent with several observational studies, was not reported in randomized trials. We attributed this to our NSO cohort perhaps having more severe illness than similar patients in previous studies. It is also possible, however, that we did not adjust for all important pretreatment confounders between initiators and noninitiators in this subgroup, which contributed to these discrepant results.
There are also limitations pertaining to the use of EHR as our data source. Date shifting and the carrying over of medications beyond treatment cessation may have introduced errors in how we captured treatment onset and background characteristics, and thus the matching process. Importantly, however, SMDs were <0.1 for all covariates in each subgroup, indicating that the matching process was able to balance treatment groups on all the key confounders, at least those that were captured in the EHR.
Relatedly, it is difficult to ascertain symptom onset using EHRs. We therefore used a positive SARS-CoV-2 test as a proxy for symptom onset and only included patients admitted within 24 hours of testing. We did this to minimize variability in pre-admission symptom duration and ensure (as much as possible) that patients were admitted to the hospital soon after experiencing symptoms so that “early” or “delayed” treatment was predominantly an inpatient medical decision, and not confounded by patients delaying their own treatment. The lag between symptom onset and testing, however, ranges between 1 and 14 days (2-day median) [36], implying that there likely remained considerable variation in patients’ pre-admission symptom durations. Despite this, we still observed lower mortality associated with early receipt of RDV in the NSO and NISO subgroups. This implies that early treatment with RDV after admission may still be effective even with delays of up to 14 days between symptom onset and admission and emphasizes the importance of patients receiving RDV as soon as possible following admission for it to be beneficial. Further research is needed to determine the maximum pre-admission symptom duration for which early treatment with RDV in the hospital remains effective.
Supplementary Data
Supplementary materials are available at Open Forum Infectious Diseases online. Consisting of data provided by the authors to benefit the reader, the posted materials are not copyedited and are the sole responsibility of the authors, so questions or comments should be addressed to the corresponding author.
Acknowledgments
We gratefully acknowledge the following core contributors to N3C: Adam B. Wilcox, Adam M. Lee, Alexis Graves, Alfred (Jerrod) Anzalone, Amin Manna, Amit Saha, Amy Olex, Andrea Zhou, Andrew E. Williams, Andrew Southerland, Anita Walden, Anjali A. Sharathkumar, Benjamin Amor, Benjamin Bates, Brian Hendricks, Brijesh Patel, Caleb Alexander, Carolyn Bramante, Cavin Ward-Caviness, Charisse Madlock-Brown, Christine Suver, Christopher Chute, Christopher Dillon, Chunlei Wu, Clare Schmitt, Cliff Takemoto, Dan Housman, Davera Gabriel, David A. Eichmann, Diego Mazzotti, Don Brown, Eilis Boudreau, Elaine Hill, Elizabeth Zampino, Emily Carlson Marti, Evan French, Farrukh M. Koraishy, Federico Mariona, Fred Prior, George Sokos, Greg Martin, Harold Lehmann, Heidi Spratt, Hemalkumar Mehta, Hongfang Liu, J. W. Awori Hayanga, Jami Pincavitch, Jaylyn Clark, Jeremy Richard Harper, Jessica Islam, Jin Ge, Joel Gagnier, Joel H. Saltz, Joel Saltz, Johanna Loomba, John Buse, Jomol Mathew, Joni L. Rutter, Julie A. McMurry, Justin Guinney, Justin Starren, Karen Crowley, Katie Rebecca Bradwell, Kellie M. Walters, Ken Wilkins, Kenrick Dwain Cato, Kimberly Murray, Kristin Kostka, Lavance Northington, Lee Allan Pyles, Leonie Misquitta, Lesley Cottrell, Lili Portilla, Mariam Deacy, Mark M. Bissell, Marshall Clark, Mary Emmett, Mary Morrison Saltz, Matvey B. Palchuk, Melissa A. Haendel, Meredith Adams, Meredith Temple-O’Connor, Michele Morris, Nabeel Qureshi, Nasia Safdar, Nicole Garbarini, Noha Sharafeldin, Ofer Sadan, Patricia A. Francis, Penny Wung Burgoon, Peter Robinson, Philip R. O. Payne, Rafael Fuentes, Randeep Jawa, Rebecca Erwin-Cohen, Rena Patel, Richard A. Moffitt, Richard L. Zhu, Rishi Kamaleswaran, Robert Hurley, Robert T. Miller, Saiju Pyarajan, Samuel Bozzette, Sandeep Mallipattu, Satyanarayana Vedula, Scott Chapman, Shawn T. O’Neil, Soko Setoguchi, Stephanie S. Hong, Steve Johnson, Tellen D. Bennett, Tiffany Callahan, Umit Topaloglu, Usman Sheikh, Valery Gordon, Vignesh Subbian, Warren A. Kibbe, Wenndy Hernandez, Will Beasley, Will Cooper, William Hillegass, Xiaohan Tanner Zhang. Details of the contributions are available at COVID.cd2h.org/core-contributors.
The N3C Consortium. Emily R. Pfaff, Richard A. Moffitt, Christopher G. Chute, Melissa A. Haendel.
Data partners with released data. The following institutions’ data are released or pending. Available: Advocate Health Care Network—UL1TR002389: The Institute for Translational Medicine (ITM) • Boston University Medical Campus—UL1TR001430: Boston University Clinical and Translational Science Institute • Brown University—U54GM115677: Advance Clinical Translational Research (Advance-CTR) • Carilion Clinic—UL1TR003015: iTHRIV Integrated Translational health Research Institute of Virginia • Charleston Area Medical Center—U54GM104942: West Virginia Clinical and Translational Science Institute (WVCTSI) • Children's Hospital Colorado—UL1TR002535: Colorado Clinical and Translational Sciences Institute • Columbia University Irving Medical Center—UL1TR001873: Irving Institute for Clinical and Translational Research • Duke University—UL1TR002553: Duke Clinical and Translational Science Institute • George Washington Children's Research Institute—UL1TR001876: Clinical and Translational Science Institute at Children's National (CTSA-CN) • George Washington University—UL1TR001876: Clinical and Translational Science Institute at Children's National (CTSA-CN) • Indiana University School of Medicine—UL1TR002529: Indiana Clinical and Translational Science Institute • Johns Hopkins University—UL1TR003098: Johns Hopkins Institute for Clinical and Translational Research • Loyola Medicine—Loyola University Medical Center • Loyola University Medical Center—UL1TR002389: The Institute for Translational Medicine (ITM) • Maine Medical Center—U54GM115516: Northern New England Clinical & Translational Research (NNE-CTR) Network • Massachusetts General Brigham—UL1TR002541: Harvard Catalyst • Mayo Clinic Rochester—UL1TR002377: Mayo Clinic Center for Clinical and Translational Science (CCaTS) • Medical University of South Carolina—UL1TR001450: South Carolina Clinical & Translational Research Institute (SCTR) • Montefiore Medical Center—UL1TR002556: Institute for Clinical and Translational Research at Einstein and Montefiore • Nemours—U54GM104941: Delaware CTR ACCEL Program • NorthShore University HealthSystem—UL1TR002389: The Institute for Translational Medicine (ITM) • Northwestern University at Chicago—UL1TR001422: Northwestern University Clinical and Translational Science Institute (NUCATS) • OCHIN—INV-018455: Bill and Melinda Gates Foundation grant to Sage Bionetworks • Oregon Health & Science University—UL1TR002369: Oregon Clinical and Translational Research Institute • Penn State Health Milton S. Hershey Medical Center—UL1TR002014: Penn State Clinical and Translational Science Institute • Rush University Medical Center—UL1TR002389: The Institute for Translational Medicine (ITM) • Rutgers, The State University of New Jersey—UL1TR003017: New Jersey Alliance for Clinical and Translational Science • Stony Brook University—U24TR002306 • The Ohio State University—UL1TR002733: Center for Clinical and Translational Science • The State University of New York at Buffalo—UL1TR001412: Clinical and Translational Science Institute • The University of Chicago—UL1TR002389: The Institute for Translational Medicine (ITM) • The University of Iowa—UL1TR002537: Institute for Clinical and Translational Science • The University of Miami Leonard M. Miller School of Medicine—UL1TR002736: University of Miami Clinical and Translational Science Institute • The University of Michigan at Ann Arbor—UL1TR002240: Michigan Institute for Clinical and Health Research • The University of Texas Health Science Center at Houston—UL1TR003167: Center for Clinical and Translational Sciences (CCTS) • The University of Texas Medical Branch at Galveston—UL1TR001439: The Institute for Translational Sciences • The University of Utah—UL1TR002538: Uhealth Center for Clinical and Translational Science • Tufts Medical Center—UL1TR002544: Tufts Clinical and Translational Science Institute • Tulane University—UL1TR003096: Center for Clinical and Translational Science • University Medical Center New Orleans—U54GM104940: Louisiana Clinical and Translational Science (LA CaTS) Center • University of Alabama at Birmingham—UL1TR003096: Center for Clinical and Translational Science • University of Arkansas for Medical Sciences—UL1TR003107: UAMS Translational Research Institute • University of Cincinnati—UL1TR001425: Center for Clinical and Translational Science and Training • University of Colorado Denver, Anschutz Medical Campus—UL1TR002535: Colorado Clinical and Translational Sciences Institute • University of Illinois at Chicago—UL1TR002003: UIC Center for Clinical and Translational Science • University of Kansas Medical Center—UL1TR002366: Frontiers: University of Kansas Clinical and Translational Science Institute • University of Kentucky—UL1TR001998: UK Center for Clinical and Translational Science • University of Massachusetts Medical School Worcester—UL1TR001453: The UMass Center for Clinical and Translational Science (UMCCTS) • University of Minnesota—UL1TR002494: Clinical and Translational Science Institute • University of Mississippi Medical Center—U54GM115428: Mississippi Center for Clinical and Translational Research (CCTR) • University of Nebraska Medical Center—U54GM115458: Great Plains IDeA-Clinical & Translational Research • University of North Carolina at Chapel Hill—UL1TR002489: North Carolina Translational and Clinical Science Institute • University of Oklahoma Health Sciences Center—U54GM104938: Oklahoma Clinical and Translational Science Institute (OCTSI) • University of Rochester—UL1TR002001: UR Clinical & Translational Science Institute • University of Southern California—UL1TR001855: The Southern California Clinical and Translational Science Institute (SC CTSI) • University of Vermont—U54GM115516: Northern New England Clinical & Translational Research (NNE-CTR) Network • University of Virginia—UL1TR003015: iTHRIV Integrated Translational Health Research Institute of Virginia • University of Washington—UL1TR002319: Institute of Translational Health Sciences • University of Wisconsin-Madison—UL1TR002373: UW Institute for Clinical and Translational Research • Vanderbilt University Medical Center—UL1TR002243: Vanderbilt Institute for Clinical and Translational Research • Virginia Commonwealth University—UL1TR002649: C. Kenneth and Dianne Wright Center for Clinical and Translational Research • Wake Forest University Health Sciences—UL1TR001420: Wake Forest Clinical and Translational Science Institute • Washington University in St. Louis—UL1TR002345: Institute of Clinical and Translational Sciences • Weill Medical College of Cornell University—UL1TR002384: Weill Cornell Medicine Clinical and Translational Science Center • West Virginia University—U54GM104942: West Virginia Clinical and Translational Science Institute (WVCTSI).
Submitted: Icahn School of Medicine at Mount Sinai—UL1TR001433: ConduITS Institute for Translational Sciences • The University of Texas Health Science Center at Tyler—UL1TR003167: Center for Clinical and Translational Sciences (CCTS) • University of California, Davis—UL1TR001860: UCDavis Health Clinical and Translational Science Center • University of California, Irvine—UL1TR001414: The UC Irvine Institute for Clinical and Translational Science (ICTS) • University of California, Los Angeles—UL1TR001881: UCLA Clinical Translational Science Institute • University of California, San Diego—UL1TR001442: Altman Clinical and Translational Research Institute • University of California, San Francisco—UL1TR001872: UCSF Clinical and Translational Science Institute. Pending: Arkansas Children's Hospital—UL1TR003107: UAMS Translational Research Institute • Baylor College of Medicine—none (voluntary) • Children's Hospital of Philadelphia—UL1TR001878: Institute for Translational Medicine and Therapeutics • Cincinnati Children's Hospital Medical Center—UL1TR001425: Center for Clinical and Translational Science and Training • Emory University—UL1TR002378: Georgia Clinical and Translational Science Alliance • HonorHealth—none (voluntary) • Loyola University Chicago—UL1TR002389: The Institute for Translational Medicine (ITM) • Medical College of Wisconsin—UL1TR001436: Clinical and Translational Science Institute of Southeast Wisconsin • MedStar Health Research Institute—UL1TR001409: The Georgetown-Howard Universities Center for Clinical and Translational Science (GHUCCTS) • MetroHealth—none (voluntary) • Montana State University—U54GM115371: American Indian/Alaska Native CTR • NYU Langone Medical Center—UL1TR001445: Langone Health's Clinical and Translational Science Institute • Ochsner Medical Center—U54GM104940: Louisiana Clinical and Translational Science (LA CaTS) Center • Regenstrief Institute—UL1TR002529: Indiana Clinical and Translational Science Institute • Sanford Research—none (voluntary) • Stanford University—UL1TR003142: Spectrum: The Stanford Center for Clinical and Translational Research and Education • The Rockefeller University—UL1TR001866: Center for Clinical and Translational Science • The Scripps Research Institute—UL1TR002550: Scripps Research Translational Institute • University of Florida—UL1TR001427: UF Clinical and Translational Science Institute • University of New Mexico Health Sciences Center—UL1TR001449: University of New Mexico Clinical and Translational Science Center • University of Texas Health Science Center at San Antonio—UL1TR002645: Institute for Integration of Medicine and Science • Yale New Haven Hospital—UL1TR001863: Yale Center for Clinical Investigation.
Financial support. This research was supported in part by the Intramural Research Program of the National Center for Advancing Translational Sciences, National Institutes of Health (Award Number: 75N95023D00001).
Disclaimer. The content of this publication does not necessarily reflect the views or policies of the Department of Health and Human Services, nor does mention of trade names, commercial products, or organizations imply endorsement by the US Government.
Author contributions. S.R.M. designed and conceptualized the study and contributed to data analysis, interpretation of the data, drafting the manuscript, and critical review of manuscript for intellectual content. K.H. designed and conceptualized the study and contributed to interpretation of the data, data analysis, and critical review of the manuscript for intellectual content. N.H. contributed to data acquisition, interpretation of the data, and critical review of the manuscript for intellectual content. A.T. contributed to interpretation of the data and critical review of the manuscript for intellectual content. H.S. designed and conceptualized the study and contributed to data analysis, interpretation of the data, and critical review of the manuscript for intellectual content. Authorship was determined using ICMJE recommendations.
Data availability. The analyses described in this publication were conducted with data or tools accessed through the NCATS N3C Data Enclave COVID.cd2h.org/enclave and supported by CD2H—The National COVID Cohort Collaborative (N3C) IDeA CTR Collaboration 3U24TR002306-04S2 NCATS U24 TR002306. This research was possible because of the patients whose information is included within the data from participating organizations (COVID.cd2h.org/dtas) and the organizations and scientists (COVID.cd2h.org/duas) who have contributed to the ongoing development of this community resource. Enclave data are protected and can be accessed for COVID-related research with an approved (1) IRB protocol and (2) Data Use Request (DUR). The approved DUR ID for this project is RP-42D046. Enclave and data access instructions can be found at https://COVID.cd2h.org/for-researchers; all code used to produce the analyses in this manuscript is available within the N3C Enclave to users with valid login credentials to support reproducibility.
IRB approval. The N3C data transfer to NCATS is performed under the Johns Hopkins University Reliance Protocol #IRB00249128 or individual site agreements with the NIH. The N3C Data Enclave is managed under the authority of the NIH; information can be found at https://ncats.nih.gov/n3c/resources. The content is solely the responsibility of the authors and does not necessarily represent the official views of the National Institutes of Health or the N3C program. Use of N3C data for this study does not involve human subjects (45 CFR 46.102) as determined by the NIH Office of IRB Operations.
References
Author notes
Potential conflicts of interest. All authors: no reported conflicts.


Comments