


Abstract
There are several clinical tools that have been developed to predict the likelihood of extended-spectrum β-lactamase producing Enterobacterales; however, the creation of these tools included few patients with cancer or otherwise immunosuppressed. The objectives of this retrospective cohort study were to develop a decision tree and traditional risk score to predict ceftriaxone resistance in cancer patients with Escherichia coli (E. coli) bacteremia as well as to compare the predictive accuracy between the tools.
Adults age ≥ 18 years old with E. coli bacteremia at The University of Texas MD Anderson Cancer Center from 1/2018 to 12/2019 were included. Isolates recovered within 1 week from the same patient were excluded. The decision tree was constructed using classification and regression tree analysis, with a minimum node size of 10. The risk score was created using a multivariable logistic regression model derived by using stepwise variable selection with backward elimination at level 0.2. The decision tree and risk score statistical metrics were compared.
A total of 629 E. coli isolates were screened, of which 580 isolates met criteria. Ceftriaxone-resistant (CRO-R) E. coli accounted for 36% of isolates. The machine learning-derived decision tree included 5 predictors whereas the logistic regression-derived risk score included 7 predictors. The risk score cutoff point of ≥ 5 points demonstrated the most optimized overall classification accuracy. The positive predictive value of the decision tree was higher than that of the risk score (88% vs 74%, respectively), but the area under the receiver operating characteristic curve and model accuracy of the risk score was higher than that of the decision tree (0.85 vs 0.73 and 82% vs 74%, respectively).
Figure 1. Clinical Decision Tree
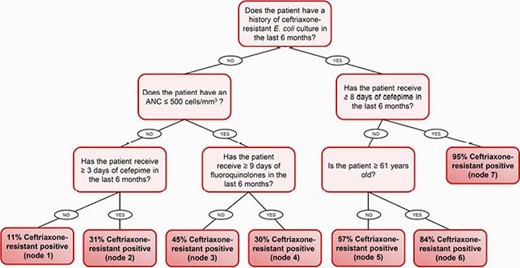
Table 1. Regression Model and Assigned Points for Clinical Risk Score
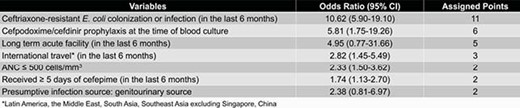
Table 2. Statistical Metrics of Clinical Decision Tree and Clinical Risk Score
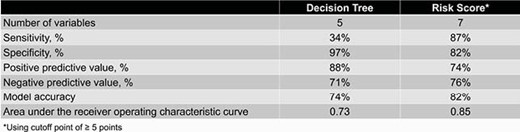
The decision tree and risk score can be used to determine the likelihood of whether a cancer patient with E. coli bacteremia has a CRO-R infection. In both clinical tools, the strongest predictor was a history of CRO-R E. coli colonization or infection in the last 6 months. The decision tree was more user-friendly, has fewer variables, and has a better positive predictive value in comparison to the risk score. However, the risk score has a significantly better discrimination and model accuracy than that of the decision tree.
Samuel L. Aitken, PharmD, MPH, BCIDP, Melinta Therapeutoics (Individual(s) Involved: Self): Consultant, Grant/Research Support


Comments