


Abstract
Households are a major setting for severe acute respiratory syndrome coronavirus 2 (SARS-CoV-2) infections, but there remains a lack of knowledge regarding the dynamics of viral transmission, particularly in the setting of preexisting SARS-CoV-2 immunity and evolving variants.
We conducted a prospective, case-ascertained household transmission study in the greater Boston area in March–July 2022. Anterior nasal swabs, along with clinical and demographic data, were collected for 14 days. Nasal swabs were tested for SARS-CoV-2 by polymerase chain reaction (PCR). Whole genome sequencing was performed on high-titer samples.
We enrolled 33 households in a primary analysis set, with a median participant age of 25 years (range, 2–66 years), 98% of whom had received at least 2 doses of a coronavirus disease 2019 (COVID-19) vaccine. Fifty-eight percent of households had a secondary case during follow-up and the secondary attack rate (SAR) for contacts was 39%. We further examined a strict analysis set of 21 households that had only 1 PCR-positive case at baseline, finding an SAR of 22.5%. Genomic epidemiology further determined that there were multiple sources of infection for household contacts, including the index case and outside introductions. When limiting estimates to only highly probable transmissions given epidemiologic and genomic data, the SAR was 18.4%.
Household contacts of a person newly diagnosed with COVID-19 are at high risk for SARS-CoV-2 infection in the following 2 weeks. This is, however, not only due to infection from the household index case, but also because the presence of an infected household member implies increased SARS-CoV-2 community transmission.
In March 2022, the severe acute respiratory syndrome coronavirus 2 (SARS-CoV-2) Omicron variant BA.2 and its descendants caused multiple outbreaks across the greater Boston area of Massachusetts [1]. A study examining the effects of lifting mask requirements in Boston-area schools also noted a significant rise in coronavirus disease 2019 (COVID-19) case rates and percent test positivity during this same time period [2]. Yet, >95% of the population of Massachusetts at that time had received at least 1 dose of a COVID-19 vaccine, and a large number of individuals had been infected with the Omicron BA.1 variant only a few months prior [1]. Despite this presence of partial population immunity, there were >200 000 new COVID-19 cases reported in Massachusetts between March and July 2022, coincident with the dropping of mask requirements in schools and a reduction in social distancing policies.
Throughout the COVID-19 pandemic, households have been a major setting for SARS-CoV-2 transmission [3]. A meta-analysis of 135 studies published in 2022 found that the secondary attack rate (SAR)—the risk of transmission from index case to household contact—of exposed household contacts was 30%–36% during the Alpha and Delta SARS-CoV-2 waves and 43% during the early (BA.1) Omicron period [3]. Factors associated with transmission risk were the vaccine status of the exposed contact, household density (ie, the number of people sleeping in the same room), and immunological factors such as the magnitude of cross-reactive memory T cells to SARS-CoV-2 antigens [4–6]. In general, the SARs reported in households, and other residential settings [7], have been far higher than those reported in other settings such as schools, where an SAR of 2.8% was reported for exposed students in 10 Massachusetts schools during the Delta wave [8].
Despite the large number of household studies performed to date, there remains a lack of precision regarding the dynamics of SARS-CoV-2 household transmission. Individual studies have been small in size, and most lack careful characterization on the genomic level. This uncertainty extends to the now common scenario where there is widespread preexisting SARS-CoV-2 immunity and continued emergence of new immune evasive variants. Knowing the risk of household transmission in this scenario, as well as identifying factors that can predict lower SARs, would enhance our ability to counsel patients appropriately and meaningfully reduce SARS-CoV-2 infections in households.
To address this research gap, we conducted a household SARS-CoV-2 transmission study in the greater Boston area in March–July 2022 in which we used clinical, demographic, viral kinetic, and genomic data for high-resolution analyses of SARS-CoV-2 transmission dynamics.
MATERIALS AND METHODS
We conducted a prospective, observational, case-ascertained household SARS-CoV-2 transmission study in the greater Boston area of Massachusetts in the United States. The primary recruitment pathway was via COVID-19 testing sites associated with Beth Israel Deaconess Medical Center (BIDMC).
Ethics
The BIDMC Institutional Review Board (IRB) approved the study protocol (number 2022P000021). All enrolled participants provided verbal informed consent or age-appropriate assent as applicable; informed consent was obtained from participants’ parent or legal guardian before any study-specific procedures were performed. Sequencing of SARS-CoV-2–positive specimens was covered under protocol number 1612793224, reviewed and approved by the Massachusetts Institute of Technology IRB.
Study Population
An index case was eligible for inclusion if they (1) had a positive SARS-CoV-2 test (rapid assay or reverse-transcription polymerase chain reaction [RT-PCR]) ≤5 days prior to enrollment and ≤5 days of acute respiratory illness symptoms prior to testing, (2) lived/planned to live in household for the upcoming 14 days, (3) had not been hospitalized since illness onset, and (4) were at least 2 years old. An index case was excluded if they did not live in a household, or if they reported that any other person in the household had an acute respiratory illness or tested positive for SARS-CoV-2 in the 7 days before index illness onset or positive test date.
Household contacts were eligible for inclusion if they (1) routinely slept (at least half of nights in last month) in the same household as the index case, (2) slept in the household at least once between 1 day prior to index illness onset or positive test date and the end of the follow-up period, (3) had plans to live in the household for the follow-up period, and (4) were at least 2 years old.
Respiratory Specimen Collection
Each enrolled index case and household member self-collected an anterior nasal swab (Rhinostics dry swab in a sterile tube; https://rhinostics.com/) for 14 days. A subset of participants who were treated with nirmatrelvir-ritonavir continued self-swabbing for an additional 7 days to monitor for potential virologic rebound [9].
Questionnaires
At enrollment, participants provided information on demographics, recent exposures to COVID-19, presence of high-risk conditions, prior and current symptoms of COVID-19, and COVID-19 vaccination status, in addition to household characteristics. An optional follow-up questionnaire was administered to participants on days 7 and 14.
SARS-CoV-2 Viral Load Quantification
Viral loads were measured with the Quaeris SARS-CoV-2 Assay, a real-time RT-PCR (rRT-PCR) test, using the Luna Probe One-Step RT-qPCR Kit (No ROX) (NEB E3007) [10]. The SARS-CoV-2 primer and probe set detects RNA from N1 and RdRP genes and uses the human RNase P gene as a positive control. Samples were rehydrated with 300 µL phosphate-buffered saline, inactivated at 65°C, and used directly as input for the Quaeris assay without extraction. rRT-PCR was performed on Applied Biosystem QuantStudio 7 (version 1.7). N1 gene cycle threshold (Ct) values are reported. Viral rebound was defined as at least 2 negative (Ct ≥35) PCR results followed by at least 2 positive (Ct <35) results.
SARS-CoV-2 Whole Genome Sequencing
Anterior nasal swabs that were positive for SARS-CoV-2 with Ct values of maximally 32 via the Quaeris assay were sequenced as previously described [11]. In brief, following inactivation with Buffer AVL, RNA was extracted using the MagMAX mirVana Total RNA Isolation Kit for the Kingfisher Flex (Thermo Fisher, catalog number A27828) according to the manufacturer's instructions. The ARTIC v4.1 primer set was used to amplify SARS-CoV-2 genetic material, from which Illumina DNA Prep sequencing libraries were prepared and sequenced on the NextSeq 550 [12].
SARS-CoV-2 Genomic Data Analysis
Sequencing reads were demultiplexed, filtered to remove adapter and contaminant sequences, depleted of reads mapping to the human genome, and assembled by alignment to reference sequence NC045512.2 via the viral-ngs v2.1.33 pipeline [13]. The following optional inputs were used with the assemble_refbased workflow to accommodate amplicon-based sequencing: major_cutoff = 0.5, min_coverage = 20, skip_mark_dupes = TRUE, and trim_coords_bed = “gs://pathogen-public-dbs/v1/amplicon_primers-ARTICv4.1_NC_045512.2.bed”.
Lineages were assigned to viral genomes using Pango v4.1.3 pango-data v1.17 [14]. Consensus single-nucleotide variants (SNVs) were determined after removing ambiguous sites and sites prone to amplicon sequencing error [15]. Intrahost single-nucleotide variants (iSNVs) were called using LoFreq and were filtered as follows: (1) masking of known problematic sites in SARS-CoV-2 genome, (2) site read depth of minimally 100, (3) allele frequency of minimally 3%, and (4) no evidence of strand bias (via Fisher exact test with P > .05) [12, 16]. Genomic data cleaning and analysis scripts are posted here: https://github.com/broadinstitute/sc2-household-transmission.
Transmission Analysis
To infer the relatedness of cases within a household, the most complete genome (ie, the genome with the highest percentage of unambiguous sites) was used for each person with a minimum unambiguous genome length of 15 000 bp. The genetic (SNV) distance between pairs of cases was used alongside the serial interval, viral kinetics, iSNV information, and test status of other individuals at baseline to classify households into transmission categories. All pairs of cases within each household were assessed, excluding those in which RT-qPCR data alone could rule out a transmission event (ie, an individual could not acquire SARS-CoV-2 from someone whose first positive test occurred later in time).
Transmissions were categorized as highly probable, possible, or unlikely. Pairs with a genetic distance of <2 SNVs and an iSNV in a putative donor that reached consensus in the putative recipient (ie, transmission of a minor variant through a tight transmission bottleneck) were considered highly probable [17, 18]. An index–contact pair in the strict analysis set (ie, from a household with a single infected participant and documented PCR-negative contacts at baseline) with a genetic distance of <3 SNVs and a serial interval of <7 days was also considered highly probable transmissions. Pairs with a genetic distance of <3 SNVs and a serial interval of <7 days, but without iSNV support, were categorized as a possible transmission, though we cannot rule out a nonhousehold recent common ancestor (ie, a shared exposure) [19, 20]. Pairs with a genetic distance of ≥3 SNVs or a serial interval of ≥7 days were considered unlikely. Highly probable and possible transmission links were plotted [21, 22].
Phylogenetic Analysis
Contextual genomes (10 BA.1 and 50 BA.2 sequences each from Massachusetts and the United States isolated between 01 February 2022 and 01 August 2022) were downloaded from GenBank (National Center for Biotechnology Information). These sequences, along with the most complete genome assembled per study participant (of minimally 15 000 bp), were aligned to the reference sequence (NC_045512.2) using Nextclade v.2.14.1 [23]. A phylogenetic tree was estimated using IQ-TREE v.2.2.2.6 [24] and was visualized and annotated using ggtree v.3.8.2 [25] in R v.4.3.1.
RESULTS
Screening, Enrollment, and Follow-up
Enrollment began on 3 March 2022 and continued until 9 July 2022, after local SARS-CoV-2 case counts had declined [1]. We enrolled 38 households containing 38 index cases and 77 household contacts (Figure 1). One household was subsequently found to be ineligible and 4 households did not complete follow-up. The remaining 33 households constituted our primary analysis set. Of these households, 3 had an index case that was PCR negative at the time of first research swab, and 9 had at least 1 contact that was PCR positive at the time of first swab. The remaining 21 households constituted our strict analysis set. The median number of persons per household in the primary analysis set was 3.5 (range, 2–5; Supplementary Table 1). The median house size was 1400 square feet (range, 740–3300 square feet).
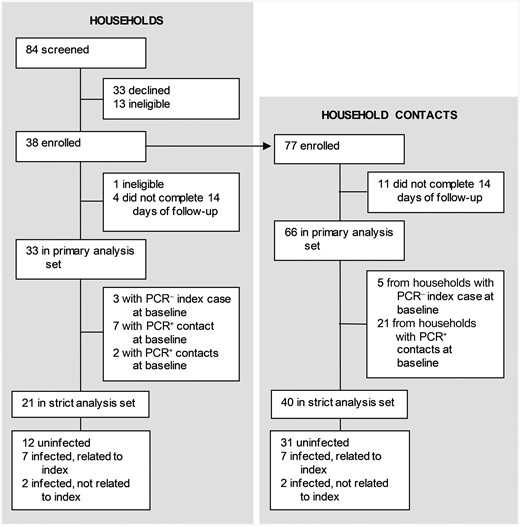
Trial profile. Abbreviations: PCR–, polymerase chain reaction negative; PCR+, polymerase chain reaction positive.
Study Population
Demographic and clinical characteristics of participants in the primary analysis set are shown in Table 1 and Supplementary Table 2. The median age was 25 years (range, 5–64 years) for index cases and 39 years (range, 2–66 years) for household contacts. Twenty-three percent of participants were children in elementary or middle school. Participants were predominantly White and non-Hispanic. Eighty-one percent of participants reported having no medical conditions, and 98% of participants received at least 2 vaccine doses. The median duration between most recent vaccination or most recent infection (prior to start of the study) and current infection onset was 160 days (range, 0–307 days).
Baseline Characteristics of the Study Population
| Characteristic | All Participants (N = 99) | Index Cases (n = 33) | Contacts (n = 66) |
|---|---|---|---|
| Age, y, median (Min–Max) | 27 (2–66) | 25 (5–64) | 39 (2–66) |
| Sex assigned at birth | |||
| Male | 44 (48.4) | 14 (43.8) | 30 (50.9) |
| Female | 47 (51.7) | 18 (56.3) | 29 (49.2) |
| Missing | 8 | 1 | 7 |
| Race | |||
| American Indian or Alaskan Native | 10 (11.0) | 3 (9.4) | 7 (11.9) |
| Asian | 2 (2.2) | 1 (3.1) | 1 (1.7) |
| Black or African American | 0 | 0 | 0 |
| Native Hawaiian or other Pacific Islander | 0 | 0 | 0 |
| White | 79 (86.8) | 28 (87.5) | 51 (86.4) |
| Multiple | 0 | 0 | 0 |
| Prefer not to report | 0 | 0 | 0 |
| Other | 0 | 0 | 0 |
| Missing | 8 | 1 | 7 |
| Ethnicity | |||
| Hispanic or Latino/Latinx | 3 (3.3) | 1 (3.1) | 2 (3.4) |
| Not Hispanic or Latino/Latinx | 88 (96.7) | 31 (96.9) | 57 (96.6) |
| Missing | 8 | 1 | 7 |
| BMI, kg/m2, median (Min–Max) | 22.9 (14.1–7.2) | 23.0 (16.1–37.1) | 22.7 (14.1–47.2) |
| Missing | 19 | 9 | 10 |
| Medical conditions | |||
| None | 69 (81.2) | 21 (72.4) | 48 (85.7) |
| Cancer | 0 | 0 | 0 |
| Diabetes | 1 (1.2) | 1 (3.5) | 0 |
| Asthma or wheezing | 10 (11.8) | 5 (17.2) | 5 (8.9) |
| COPD/emphysema | 0 | 0 | 0 |
| High blood pressure | 3 (3.5) | 1 (3.5) | 2 (3.6) |
| Coronary artery disease | 0 | 0 | 0 |
| Congestive heart failure | 0 | 0 | 0 |
| Peripheral artery disease | 0 | 0 | 0 |
| Othera | 2 (2.4) | 1 (3.5) | 1 (1.8) |
| Missing | 14 | 4 | 10 |
| Autoimmune or immune system disease, anyb | 7 (8.2) | 1 (3.7) | 6 (10.3) |
| Missing | 14 | 6 | 8 |
| Prior diagnosis of COVID-19 | 9 (9.5) | 1 (3.2) | 8 (12.5) |
| Missing | 4 | 2 | 2 |
| Days between most recent diagnosis and enrollment, median (Min–Max) | 59 (18–780) | 780 | 57 (18–462) |
| Hospitalized for COVID-19 (missing 1) | 0 | 0 | 0 |
| Prior receipt of a COVID-19 vaccine (missing 2) | 95 (97.9) | 32 (100) | 63 (96.9) |
| No. of doses, median (Min–Max) | 3 (2–4) | 3 (2–4) | 3 (2–4) |
| Days between most recent COVID-19 vaccination and enrollment, median (Min–Max) (missing 4) | 165 (1–308) | 165 (48–308) | 165 (1–307) |
| Days between most recent diagnosis or most recent COVID-19 vaccination (whichever is more recent) and enrollment, median (Min–Max)c | 160 (0–308) | 164.5 (0–308) | 160 (1–307) |
| Missing | 2 | 1 | 1 |
Data are presented as No. (%) unless otherwise indicated.
Abbreviations: BMI, body mass index; COPD, chronic obstructive pulmonary disease; COVID-19, coronavirus disease 2019.
aReported by participant: “heart aneurysm” (1); history of stroke (2).
bReported by participant: irritable bowel syndrome, eczema, and allergies (1); vitiligo (1); diverticulosis (1); Reynaud's disease (1).
cNote that 1 participant was boosted on day of positive COVID-19 test and therefore has 0 days’ duration.
SARS-CoV-2 Infections
Of the 33 households in the primary analysis set, 19 (58%) had a household contact who tested positive by PCR during follow-up (Figure 2A and Table 2). Of the 66 household contacts in the primary analysis set, 26 tested positive, indicating a putative SAR of 39%; 11 of these cases were detected on day 1 of swabbing. If limiting analysis to the 21 households in the strict analysis set, 9 (43%) households had a new incident infection during follow-up, corresponding to 9 infections out of 40 household contacts, or a putative SAR of 22.5%.
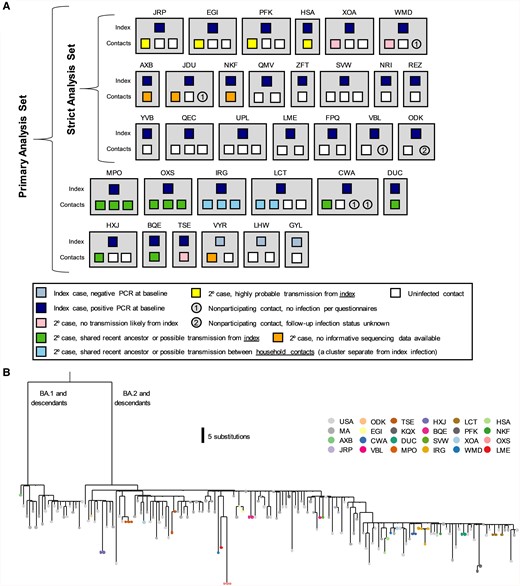
Household diagram. A, Individual households are labeled with a 3-letter identifier and represented with gray boxes. Households in both the primary and strict analysis sets are shown. Each member of the household is shown within the gray box, with their outcome color-coded as described in the legend. B, Phylogenetic tree of positive samples. Abbreviations: 2o, secondary; PCR, polymerase chain reaction.
Severe Acute Respiratory Syndrome Coronavirus 2 Secondary Attack Rates
| Set | Events, No. | Total Households, No. | Total Contacts, No. | Secondary Attack Rate, % |
|---|---|---|---|---|
| Primary analysis set | ||||
| Households with secondary cases | 19 | 33 | … | 57.6 |
| Individual secondary cases | 26 | … | 66 | 39.4 |
| Strict analysis set | ||||
| Households with secondary cases | 9 | 21 | … | 42.9 |
| Households with secondary cases, excluding households with outside infection | 7 | 19 | … | 36.8 |
| Individual secondary cases | 9 | … | 40 | 22.5 |
| Individual secondary cases, excluding individuals with outside infection | 7 | … | 38 | 18.4 |
In the primary analysis set of 33 households, the median minimal Ct—corresponding to peak viral load—was 25.65 for index cases and 23 for infected household contacts (Supplementary Table 3). Median duration of viral shedding was 6.5 days and 8 days for index cases and contacts, respectively (ie, index cases were detected later in the course of their infections). The majority of participants who became infected stopped shedding before the end of the 14-day follow-up period, with only 9 (9%) with a detectable Ct on day 14. The median time from index case diagnosis to swabbing of the household was 1 day in the strict analysis set and 2 days in the primary analysis set (Supplementary Table 4). The median time to positive SARS-CoV-2 test from index diagnosis date was 3 days. Eleven participants reported taking nirmatrelvir-ritonavir; 3 participants had viral rebound (Supplementary Figure 1A: MPO-02, BQE-01, and BQE-02) [9]. Of note, in 2 households (MPO and BQE), a household contact reported a history of a positive SARS-CoV-2 test in a follow-up survey that was not reported at enrollment; in these households the participants designated index and contacts were left as defined at enrollment.
SARS-CoV-2 Sequencing
For the primary analysis set, approximately 1300 total anterior nasal swab samples were collected and analyzed via the rRT-PCR Quaeris assay. One hundred eighty-one of these samples—that is, those with a diagnostic Ct <32 (mean, 30.1), and thus enough viral RNA to potentially yield useful sequencing data—were subject to genomic sequencing. One hundred forty-five of 181 (80.1%) samples, which originated from 44 individuals in 24 households, produced partial genomes of at least 15 000 bp in length (Supplementary Table 5). Fifteen of 24 (62.5%) of the households yielded partial genomes from >1 individual and thus were suitable for genomic interrogation of transmission.
We first used phylogenetics to study the relationship between our sequences and those contemporaneously circulating in Massachusetts and in the United States. Both the BA.1 and BA.2 clades of the Omicron variant were circulating (Figure 2B). In 3 of 15 (20.0%) households, at least 1 sequence generated from a member of the household was more closely related to a contextual sequence than to other sequences generated from the household, suggestive of multiple independent introductions of SARS-CoV-2 in these households (Figure 2B). We thus developed strict criteria to classify transmission events within households (Supplementary Table 6) and applied them to pairs of cohabitating individuals.
Focusing first on households yielding genetic data from >1 individual in the strict analysis set (n = 6), we found that 4 households had viral sequences that were either identical between index and secondary cases or differed by only 1–2 SNVs (Figure 3A, Supplementary Table 6). In these cases, transmission from index to secondary case was considered highly probable. In 2 households, we identified significant viral variation between sequences isolated from the index and secondary contacts, strongly suggesting that the secondary cases were independent introductions (Figure 3B). In household XOA, the index case was infected with a BA.2.13 variant, whereas the contact was infected with BA.2.12.1; there was a 13 SNV difference between sequences. In household WMD, the index case was infected with BA.2.12.1 and the contact was infected with BA.2; there was a 20 SNV difference between sequences. (Of the 3 remaining households with secondary cases in the strict analysis set (AXB, JDU, and NKF), sequences were not available or could not be analyzed; viral kinetic curves for these households are in Figure 3C. When excluding the 2 household contacts who were infected outside of the household, the SAR among individual household contacts in the strict analysis set was 18.4% (Table 2).
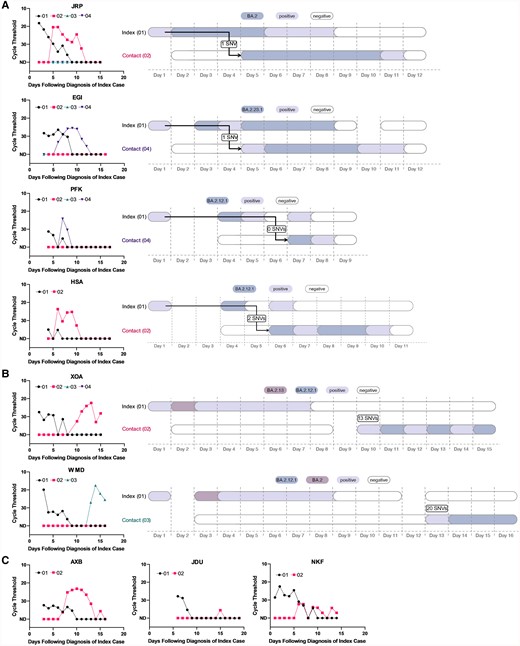
Viral load curves and transmission plots by household in the strict analysis set. A, Households where transmission was determined to be highly probable. B, Households where transmission was determined to be unlikely. C, Households that did not yield sufficient sequencing data. In A–C, colors indicate the viral variant that was ascertained via viral sequencing. Samples that were severe acute respiratory syndrome coronavirus 2 positive via reverse-transcription quantitative polymerase chain reaction but had insufficient viral loads for sequencing are depicted in lilac. Sequencing was not conducted on the index cases’ self-administered, primary diagnostic samples. Arrows denote the inferred direction, but not the precise timing, of viral transmission. Day 1 in the right panels corresponds to the first day of positive testing in the household. Abbreviation: SNV, single-nucleotide variant.
Analyzing transmission networks among households in the primary analysis set revealed several interesting patterns. In 5 households, there were clusters of infections (2–3 per household) that were all genetically linked to the index case (Figure 4A [a representative example] and Supplementary Figure 1A). In these households, there were 0 SNVs between index and contact sequences, but the close overlap in diagnosis dates suggests that either a shared common exposure or intrahousehold transmission was possible. In 3 households, there were 2 distinct clusters of infections detected (Figure 4B [a representative example] and Supplementary Figure 1B). In these households, the index case was infected with a virus that was 3–4 SNVs different than the viruses that circulated in the rest of the household, which is inconsistent with household transmission. In 1 household (Figure 4C), there was evidence that the index case was coinfected with 2 contemporaneously circulating strains (BA.2.1.12 and BA.2.10), whereas the contact was infected with solely BA.2.1.12; given the close diagnosis dates, the shared BA.2.1.12 variant may be explained by either a shared social network or household transmission of 1 of the 2 variants due to the transmission bottleneck.
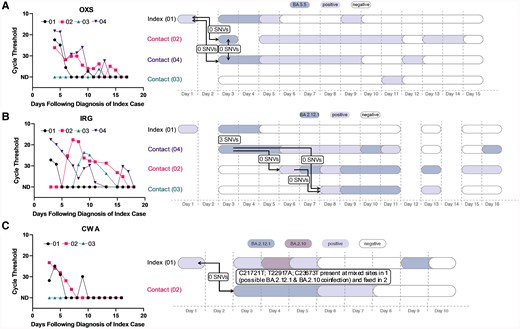
Representative viral load curves and transmission plots from the primary analysis set. A, A representative household where either a shared exposure (ie, social network) exists or within-household transmission has occurred, as all cases are genetically linked to the index case. B, A representative household where 2 separate infection clusters were identified. C, A household where a putative coinfection was identified in the index case. In A–C, colors indicate the viral variant that was ascertained via viral sequencing. Samples that were severe acute respiratory syndrome coronavirus 2 positive via reverse-transcription quantitative polymerase chain reaction but had insufficient viral loads for sequencing are depicted in lilac. Sequencing was not conducted on the index cases’ self-administered, primary diagnostic samples. Arrows denote the inferred direction, but not the precise timing, of viral transmission. Day 1 in the right panels corresponds to the first day of positive testing in the household. Abbreviation: SNV, single-nucleotide variant.
Potential Predictors of Transmission
The small sample size and homogeneity of many baseline variables (eg, vaccine history) limited the power of our analysis to detect predictors of transmission risk (Supplementary Tables 7 and 8). We examined the 7 household contacts where transmission from the index was highly likely compared to the 28 participating contacts who remained uninfected. Using Wilcoxon rank-sum and Fisher exact tests (Table 3), we found that there was no association between infection status and the contact's prior COVID-19 vaccination or infection history, age, or sex assigned at birth. There was also no association between infection status and the associated index case's prior COVID-19 vaccine status, minimum Ct value, or duration of SARS-CoV-2 shedding, and no association between infection status and the number of persons in the household or square footage.
Household Contact Characteristics by Infection Status (Strict Analysis Set), Excluding Secondary Cases With Outside Infections
| Characteristic | Infected Contact (n = 7) | Not Infected Contact (n = 28) | P Value |
|---|---|---|---|
| Characteristics of household contact | |||
| Age, y, median (Min–Max) | 46 (13–50) | 28.5 (10–64) | .76a |
| Male sex assigned at birth, No. (%) | 2 (33.3) | 13 (59.1) | .37b |
| Missing, No. | 1 | 6 | |
| No. of COVID-19 vaccines received, median (Min–Max) | 3 (2–3) | 3 (2–4) | 1.00b |
| Missing, No. | 0 | 1 | |
| Days from last infection/vaccination, median (Min–Max) | 146 (119–193) | 138 (−1 to 197) | .45a |
| Missing, No. | 0 | 6 | |
| Characteristics of associated index case | |||
| Lowest Ct value, median (Min–Max) | 27.8 (18.2–35) | 25 (15.9–33.9) | .19a |
| Duration of shedding, d, median (Min–Max) | 7 (3–9) | 8 (1–15) | .41a |
| Missing, No. | 0 | 0 | |
| Characteristics of associated household | |||
| No. of persons in household, median (Min–Max) | 4 (2–4) | 4 (2–4) | .10b |
| Missing, No. | 0 | 1 | |
| House size, square feet, median (Min–Max) | 1140 (740–3300) | 1000 (740–3300) | .59a |
| Missing, No. | 2 | 15 |
Abbreviations: COVID-19, coronavirus disease 2019; Ct, cycle threshold.
aWilcoxon rank-sum test.
bFisher exact test.
DISCUSSION
Here we studied the transmission dynamics of SARS-CoV-2 within households using prospective daily PCR surveillance, clinical and demographic data, and genomic epidemiology. Our study was conducted during a wave of Omicron BA.2 and its sublineages, and among a highly vaccinated population consisting primarily of families with children in elementary and middle school.
Our study found that the risk of SARS-CoV-2 in exposed households is very high, consistent with previous reports. In our primary analysis set, we found that 58% of enrolled households went on to have a second SARS-CoV-2 case in the household over the next 2 weeks. Nearly a third of households had a positive secondary case identified on the very first day of testing. At the individual level, we found that 39% of household contacts tested positive for SARS-CoV-2 during follow-up. Following the infection of a household contact, putatively negative household members must make decisions around travel and attending school or work. Here, we provide data that could inform this value-based decision.
We further aimed to more rigorously estimate the risk of SARS-CoV-2 transmission directly from an index case, performing a strict analysis including only households that had 1 confirmed PCR-positive index case and only PCR-negative household contacts at enrollment. In this analysis, we identified 9 cases among 40 household contacts, or an SAR of 22.5%. Using genomic epidemiology, we then excluded 2 cases as these were likely acquired outside of the household. We thus determined that the most rigorous SAR was 18.4%. Of note, our study was conducted when multiple BA.2 descendants were circulating, and this genetic diversity improved our ability to rule out putative transmission events.
Using genomic epidemiology, we found that the infectious source of secondary cases was varied. The most common source of infection was the index case, but other sources included imported cases, shared exposures with the index, or other infected contacts within the home. Our findings highlight that infection within a household serves as a proxy for broader risk for community transmission, emphasizing the importance of maintaining vigilant public health measures both inside and outside of the home.
SAR estimates have varied considerably across multiple studies, due to varying study designs, populations, and circulating SARS-CoV-2 variants. During the Alpha and Delta waves, the SAR for exposed household contacts was reported to be between 30% and 36%, rising to 43% during the early (BA.1) Omicron period [3]. Here we report that during a BA.2 wave (and its descendants), the SAR was 39% using a larger primary set of households, 22.5% with a strict set of households, and 18.4% when further incorporating genomic data. This lower estimate using genomic data is likely a more accurate reflection of the true risk of household exposure.
There are multiple limitations to our study. We utilized only self-collected anterior nasal swabs to obtain our specimens. Given that there are several methods for collection, we acknowledge that our final results could be different if different techniques were employed [26]. The maximum duration of shedding may also be an underestimate as some participants may have continued shedding after our observation period. In addition, case-finding in our analysis was driven by symptom onset or a self-reported positive SARS-CoV-2 test. While this methodology was used to simulate real-world community spread and awareness of infection, our process may overlook specific scenarios that could impact our SAR. For example, if an index case were asymptomatic and transmitted to members of the household who subsequently became symptomatic, our study would deem the symptomatic contact as the index case and either exclude the household given multiple members with a positive test on entry or fail to recognize the initial transmission. Index cases in these scenarios actually represent the middle or end of a household outbreak, underestimating our SAR. This is particularly relevant to our young, healthy, and vaccinated cohort that may be more likely to exhibit subclinical or asymptomatic infection. Additionally, there are 3 households (AXB, JDU, and NKF) without sequence data, which we included as probable transmissions given the viral kinetic curves of the household and the inability to exclude multiple household introductions using sequence data. Inclusion of these cases in our SAR calculation without sequencing confirmation of relationship to the index case may overestimate our SAR. Nevertheless, our SAR remains low even with this potential overestimation, further emphasizing that household status is a poor proxy for viral transmission when community spread is high. Our small sample size substantially limited our power to assess predictors of transmission, especially because prior COVID-19 vaccination was near universal in our study cohort. Given the complexity of estimating the magnitude of preexisting SARS-CoV-2 immunity by history alone, future household transmission studies would benefit from larger cohorts and baseline immunologic assessments of humoral, cellular, and mucosal immune responses. Finally, ascertaining SARS-CoV-2 transmission, even with daily sample collection and high-resolution genomic data, remains a challenge. Because the virus can transmit more rapidly than genetic diversity accrues, highly similar genetic sequences can be observed even among epidemiologically unlinked samples [27, 28]. In future household studies of SARS-CoV-2 transmission, we recommend that investigators categorize the likelihood of transmission in a probabilistic manner, particularly in the light of the virus’s now endemic nature.
In summary, we used high-resolution genomic epidemiology to determine that household exposure to SARS-CoV-2 remains an important source of viral spread. Further interventions to block household transmission should be studied, especially in the now common scenario when population immunity and vaccine coverage are high but immune-evasive viral variants continue to emerge.
Supplementary Data
Supplementary materials are available at Open Forum Infectious Diseases online. Consisting of data provided by the authors to benefit the reader, the posted materials are not copyedited and are the sole responsibility of the authors, so questions or comments should be addressed to the corresponding author.
Notes
Acknowledgments. We thank the participants and staff at the Center for Virology and Vaccine Research Clinical Trials Unit, the Harvard Catalyst Clinical Research Center, and the Beth Israel Deaconess Primary Care–Chelsea Clinic. We also thank Daniel J. Park for providing important feedback on the manuscript, and Janet Morgan for administrative support.
Author contributions. J. B.: Methodology, formal analysis, investigation, data curation, writing–original draft. T. B.-F.: Methodology, software, formal analysis, investigation, data curation, visualization, writing–original draft. B. A. P.: Methodology, software, formal analysis, investigation, data curation, visualization, writing–original draft, funding acquisition. E. Y. D. and A. T. L.: Investigation, data curation, project administration. S. T. D. and K. S. M.: Investigation, data curation. A. B. N., A. C., N. L., V. A.-D., S. D., G. K. M., and M. C.: Investigation. K. C. D.: Project administration. B. L. M.: Project administration, funding acquisition. M. S.: Conceptualization, methodology, investigation, resources, data curation, writing–review and editing, supervision, funding acquisition. P. C. S.: Conceptualization, methodology, software, formal analysis, investigation, resources, data curation, writing–review and editing, supervision, project administration, funding acquisition. K. E. S.: Conceptualization, methodology, formal analysis, investigation, resources, data curation, writing–original draft, visualization, supervision, project administration, funding acquisition.
Financial support. This study was supported by the Massachusetts Consortium for Pathogen Readiness (to K. E. S.); Beth Israel Deaconess Medical Center (to K. E. S.); the National Institutes of Health (R01-GM120122 to M. S.); Harvard Catalyst; the National Institute of General Medical Sciences (T32GM007753 and T32GM144273 to B. A. P.); the Broad MD-PhD Fellowship (to B. A. P.); a Centers for Disease Control and Prevention (CDC) Broad Agency Announcement (75D30120C09605 to B. L. M.); the CDC Pathogen Genomic Centers of Excellence (NU50CK000629 to B. L. M. and P. C. S.); the National Institute of Allergy and Infectious Diseases (U19AI110818 to P. C. S.); and Howard Hughes Medical Institute (P. C. S.).
References
Massachusetts Department of Public Health. COVID-19 dashboard. Available at: https://www.mass.gov/info-details/covid-19-reporting. Accessed 31 July 2024.
Emergency use authorization (EUA) summary: Quaeris SARS-CoV-2 assay. 2021. Available at: https://www.fda.gov/media/149445/download. Accessed 31 July 2024.
ARTICnetwork, Github. Available at: https://github.com/artic-network/artic-ncov2019/tree/master/primer_schemes/nCoV-2019/V4.1. Accessed 31 July 2024.
Github. Available at: https://github.com/W-L/ProblematicSites_SARS-CoV2/blob/master/problematic_sites_sarsCov2.vcf. Accessed 31 July 2024.
Author notes
J. B., T. B.-F., and B. A. P. contributed equally to this work.
Potential conflicts of interest. P. C. S. is a co-founder of, shareholder in, and scientific advisor to Sherlock Biosciences and Delve Bio; is a board member of and shareholder in Danaher Corporation; and has filed intellectual property related to genome sequencing and analysis. All other authors report no potential conflicts.


Comments