


Abstract
An improved understanding of oral Kaposi sarcoma–associated herpesvirus (KSHV) viral dynamics could provide insights into transmission risk and guide vaccine development.
We evaluated KSHV oral shedding dynamics in Ugandan adults stratified by Kaposi sarcoma (KS) and human immunodeficiency virus (HIV) status. Participants were followed for ≥4 weeks, with daily home oral swab collection to quantify KSHV using polymerase chain reaction. Shedding rates were defined by number of days with KSHV DNA detected divided by total days with swabs and compared by group using hurdle models.
Two hundred ninety-five participants were enrolled; median age was 35 years (range, 18–71 years), and 134 (45%) were male. KSHV was detected more frequently among participants with KS (HIV positive [HIV+]/KS+, 56/76 [74%]; HIV negative [HIV−]/KS+, 9/18 [50%]) than those without KS (HIV+/KS−, 36/125 [29%]; HIV−/KS−, 16/76 [21%]); odds of shedding did not differ significantly by HIV status. Among participants with KSHV detected, shedding rates did not differ significantly by group. Median per-participant viral loads among positive samples were lowest in HIV+/KS+ (3.1 log10 copies/mL) and HIV−/KS+ (3.3 log10 copies/mL) participants relative to HIV+/KS− (3.8 log10 copies/mL) and HIV−/KS− (4.0 log10 copies/mL) participants. All groups had participants with low viral load intermittent shedding and participants with high viral load persistent shedding. Within each group, individual KSHV shedding rate positively correlated with median KSHV log10 copies/mL, and episode duration positively correlated with peak viral load.
Oral KSHV shedding is highly heterogeneous across Ugandan adults with and without KS and HIV. Persistent shedding is associated with higher median viral loads regardless of HIV and KS status.
Kaposi sarcoma–associated herpesvirus (KSHV) is the etiologic agent of Kaposi sarcoma (KS), a common cancer in sub-Saharan Africa where KSHV seroprevalence is high. Several studies over the last 2 decades have shown that oral KSHV shedding is common in populations in sub-Saharan Africa, ranging from 15% to 48% of individuals tested [1–11]. KSHV shedding in saliva is more frequent and occurs at a higher quantity than in the genital tract and plasma, and behavior that includes exposure to saliva has been associated with KSHV infection [12]. Taken together, oral exposure may be an important driver of transmission [13, 14]. Oral shedding also predicts subsequent KSHV viremia, which may lead to infection of vascular or lymphatic endothelial cells and ultimately the development of KS [14].
There is wide heterogeneity in KSHV shedding phenotypes among people infected with KSHV, with 66% of shedding rate variance attributable to differences between individuals [8]. KSHV oral shedding frequency correlates with high median viral load [14, 15]; some individuals have brief, episodic, low-viral-load, oral shedding while others demonstrate persistent high viral loads [8]. KSHV shedding kinetics are at least partially modulated by the presence of KS and the degree of immunosuppression due to human immunodeficiency virus (HIV) coinfection. A previous study in Uganda demonstrated that oral KSHV shedding and viremia occur at higher frequency in adults with KS (KS+) versus without KS (KS–), with less substantial increases in KSHV shedding rate attributable to HIV infection [14].
The mucosal shedding patterns of other human herpesviruses have been characterized in greater detail than for KSHV and represent the interactions between viral replication and spread and local immune responses [16]. Whereas genital herpes simplex virus 2 (HSV-2) infection is characterized by frequent bursts of replication that are rapidly eliminated over hours [17–19], cytomegalovirus has considerably slower kinetics with oral viral expansion and contraction phases lasting for weeks and months [20, 21]. Epstein-Barr virus (EBV) oral shedding varies substantially between individuals with evidence of limited episodic and high viral load persistence [22, 23]. For HSV-2 and EBV, the degree of HIV-1–related CD4+ T-cell depletion inversely correlates with shedding rate, though only some variance in individual shedding rates can be attributed to an individual's CD4+ T-cell count [22, 24]. In this study, we aimed to evaluate individual-level KSHV viral kinetics to compare oral KSHV shedding rates, quantity, and episode characteristics among participants classified by HIV and KS status.
MATERIALS AND METHODS
Study Design
We evaluated data from an observational, prospective cohort study of Ugandan adults (aged ≥18 years) who were enrolled between October 2007 and May 2010. Individuals from 4 groups were invited to participate: HIV-1–seropositive individuals without KS (HIV+/KS−, Arm A); HIV-1–seronegative individuals without KS (HIV−/KS−, Arm B); HIV-1–seropositive individuals with KS (HIV+/KS+, Arm C); and HIV-1–seronegative individuals with KS (HIV−/KS+, Arm D). KS-negative participants (Arms A and B) were recruited from Voluntary Counseling and Testing Centers and HIV care centers in Kampala, Uganda. HIV+/KS− participants who reported antiretroviral therapy (ART) use at the time of enrollment were excluded. HIV+/KS+ participants were eligible despite ART use. At the time of the original study, ART was initiated based on CD4 level, and universal test and treat policies were not yet established. Participants with a new diagnosis of KS (Arms C and D) were recruited from the Infectious Disease Institute and oncology clinics and wards at the Uganda Cancer Institute in Kampala, Uganda.
The enrollment visit included a rapid HIV test to determine HIV status, a physical examination to determine KS status, and for those who were KS positive, a skin biopsy of a suspected KS lesion or histologic confirmation. No KSHV serology tests were performed. Participants from all arms were followed for at least 4 weeks, with 1 “session” of data collection consisting of 28 days of daily home oral swab collection and weekly clinic visits that included physical examinations, oral and anogenital mucosal swab collection, and plasma sample collection. HIV-positive individuals also had CD4 T-cell counts and HIV viral loads measured at the first follow-up visit. This monthly cycle of sample collection was repeated every 3 months for Arm A (HIV+/KS−) participants (up to 2 years) and Arm C (HIV+/KS+) participants (up to 1 year).
Patient Consent Statement
This study was approved by the Makerere University Research and Ethics Committee, the Fred Hutchinson Cancer Center Institutional Review Board (IRB), and the University of Washington IRB. All participants provided informed consent for study participation. In the event that participants were not able to read and understand the consent form, verbal consent was obtained in place of written consent.
Definitions and Laboratory Methods
A KSHV shedding episode was defined by a string of consecutive positive days, allowing for 1 or more instances of a single missing or negative day within the string of positives. Episodes with well-defined durations were those with episode starts preceded by 2 consecutive negatives and episode stops followed by 2 consecutive negatives.
Oral swab samples were evaluated for KSHV DNA by a quantitative, high-throughput fluorescent probe–based real-time polymerase chain reaction (PCR) assay (TaqMan assay, Applied Biosystems, Foster City, California) of the ORF73 gene at the Uganda Cancer Institute–Fred Hutchinson Cancer Center Laboratory in Kampala, Uganda, as described previously [13, 15]. Samples with >150 copies per mL of KSHV DNA were considered positive [25]. CD4 T-cell counts were measured by flow cytometry. HIV-1 RNA levels were measured with real-time reverse-transcription PCR; levels <400 copies/mL were considered undetectable.
Statistical Analysis
To ensure comparable sampling periods, data from the first 28-day session were used for comparisons between study arms. KSHV shedding rates were defined by the total number of days with KSHV DNA detected divided by the total days with swabs collected and were computed for each participant (per-participant rates) as well as among all days contributed by participants in a study arm (day-level rates). KSHV DNA quantity was computed among days with KSHV DNA detected and measured in log10 copies/mL. We used negative binomial hurdle models [26, 27], with an offset to account for differential follow-up time, to compare shedding rates by arm. These models accommodate excess zeros by including 2 components: (1) associations with zero shedding, where model estimates are presented as odds ratios with 95% confidence intervals (CIs), and (2) associations with the rate of shedding among those with at least 1 day with KSHV DNA detected, where model estimates are presented as incidence rate ratios with 95% CIs. Shedding quantity on the log10 scale was compared between arms using generalized estimating equations with the normal distribution, using methods to address informative cluster size [28], as detailed in the supplement; model estimates were presented as mean log10 differences with 95% CIs. Arm B (HIV−/KS−) was considered the reference category in all models. We reported unadjusted estimates as well as model estimates adjusted for sex, age, alcohol use, lifetime number of sexual partners, and a variable with the following categories, to capture the extent of protected sexual contacts in the 3 months prior to enrollment: no partners in past 3 months, 100% condom use with sexual partners in past 3 months, <100% condom use with sexual partners in past 3 months. Sex and age were chosen as basic demographic adjustment variables; the remaining variables were chosen as these, or similar behavioral variables have shown significant associations with oral KSHV shedding rate in previous studies [14].
We used descriptive statistics to characterize all KSHV episodes in each arm. We also characterized the episodes with the maximum observed duration for each participant; episode durations were compared by arm using survival methodology to treat those with episode duration not well-defined as censored observations, and maximum KSHV log10 copies/mL were compared using the Kruskal-Wallis test and subsequent pairwise tests that accounted for multiple comparisons. SAS, version 9.4 (SAS Institute, Cary, North Carolina) was used for all analyses.
RESULTS
Cohort Description
A total of 295 participants were enrolled: 125 were HIV+/KS−, 76 were HIV−/KS−, 76 were HIV+/KS+, and 18 were HIV−/KS+. Participant characteristics at enrollment are shown for the entire cohort and by study arm in Table 1. Overall, 134 (45%) were male and the median age was 35 years (range, 18–71 years). Those with KS had a higher proportion of males than those without KS, and the HIV−/KS+ group had a higher median age than the other groups. Among HIV-seropositive participants, CD4 counts were notably lower among individuals with KS (median, 161 [interquartile range {IQR}, 48–273] cells/μL) than those without KS (median, 411 [IQR, 277–598] cells/μL). The 2 HIV-seropositive groups had similar proportions of participants with detectable HIV viral load (68% for each), but among participants with detectable HIV RNA, the HIV+/KS+ group had higher HIV viral load (median, 5.0 [IQR, 4.3–5.5] log10 copies/mL) than the HIV+/KS− group (median, 4.5 [IQR, 4.2–5.0] log10 copies/mL). Thirty-five of 76 (46%) participants in the HIV+/KS+ group reported previous ART; however, no previous ART use was reported by the HIV+/KS− group participants.
Baseline Characteristics of Study Participantsa
| Characteristic | Total | HIV+/KS− | HIV−/KS− | HIV+/KS+ | HIV−/KS+ |
|---|---|---|---|---|---|
| No. of participants | 295 | 125 | 76 | 76 | 18 |
| Demographic factors | |||||
| Male sex | 134 (45) | 37 (30) | 29 (38) | 50 (66) | 18 (100) |
| Age, y, median (range) | 35 (18–71) | 35 (18–64) | 34 (18–64) | 36 (19–58) | 44 (24–71) |
| Clinical factors | |||||
| BMI <18.5 kg/m2 | 38 (13) | 13 (10) | 9 (12) | 13 (17) | 3 (17) |
| CD4 countb, cells/μL, median (IQR) | 305 (183–501) | 411 (277–598) | … | 161 (48–273) | … |
| Detectable HIV plasma RNAb | 134 (68) | 84 (68) | … | 50 (68) | … |
| HIV plasma RNAb, log10 copies/mL, median (IQR) | 4.6 (4.2–5.1) | 4.5 (4.2–5.0) | … | 5.0 (4.3–5.5) | … |
| KS any oral lesionc | 25 (27) | … | … | 25 (33) | 0 (0) |
| KS tumor stage T1c | 82 (87) | … | … | 66 (87) | 16 (89) |
| Received ART prior to session 1d | 36 (18) | 0 (0) | … | 35 (46) | … |
| Received ART concurrently with session 1d | 48 (24) | 8 (6) | … | 40 (53) | … |
| Received chemotherapy prior to session 1d | 8 (9) | … | … | 8 (11) | 0 (0) |
| Received chemotherapy concurrently with session 1d | 29 (31) | … | … | 24 (32) | 5 (28) |
| Behavioral factors | |||||
| Alcohol use | 111 (38) | 47 (38) | 34 (45) | 23 (30) | 7 (39) |
| Smoking status | |||||
| Current | 26 (9) | 8 (6) | 11 (14) | 5 (7) | 2 (11) |
| Past | 40 (14) | 17 (14) | 5 (7) | 17 (22) | 1 (6) |
| Never | 229 (78) | 100 (80) | 60 (79) | 54 (71) | 15 (83) |
| Lifetime sex partners, No., median (IQR) | 5 (3–10) | 5 (3–10) | 4 (2–6) | 6 (5–13) | 5 (4–8) |
| Any sex partners in past 3 mo | 160 (55) | 67 (54) | 53 (71) | 27 (36) | 13 (72) |
| Condom use last 3 mo | |||||
| All the time | 55 (34) | 31 (46) | 12 (23) | 12 (44) | 0 (0) |
| More than half the time | 21 (13) | 16 (24) | 4 (8) | 1 (4) | 0 (0) |
| Less than half the time | 18 (11) | 3 (4) | 9 (17) | 5 (19) | 1 (8) |
| Never | 66 (41) | 17 (25) | 28 (53) | 9 (33) | 12 (92) |
Data are presented as No. (%) unless otherwise indicated.
Abbreviations: ART, antiretroviral therapy; BMI, body mass index; HIV–, human immunodeficiency virus seronegative; HIV+, human immunodeficiency virus seropositive; IQR, interquartile range; KS–, without Kaposi sarcoma; KS+, with Kaposi sarcoma.
aNumbers may not add to totals due to missing data.
bAmong HIV-positive participants only. HIV plasma RNA log10 copies/mL only summarized among samples with detectable HIV plasma RNA. Maximum value (750 000 copies/mL) used for samples above the maximum limit of detection.
cAmong participants with KS only.
dSession 1 refers to the first period of 28 days of daily home oral swab collection.
KSHV Shedding Rates and Quantity by Study Arm
During session 1, oral swabs were collected for a median of 27–28 days for all study arms (Table 2). Twenty-six percent of KS-negative participants had KSHV DNA detected in at least 1 oral swab, whereas among KS+ participants, 50% of HIV−/KS+ participants and 74% of HIV+/KS+ participants had KSHV DNA detected in at least 1 oral swab. Correspondingly, participant-level shedding rates were higher among those with KS than those without KS (Figure 1A); among those with at least 1 day with KSHV DNA detected, the median shedding rate was 82% for the HIV−/KS+ group, 40% for the HIV+/KS+ group, 45% for the HIV−/KS− group, and 51% for the HIV+/KS− group (Figure 1B). Negative binomial hurdle models demonstrated that the higher proportion of days with KSHV DNA detected in oral swabs among KS+ participants was due to greater odds of any versus no shedding; among those with KSHV DNA detected in oral swabs on at least 1 day, there were no significant differences in frequency of KSHV shedding among study arms (Supplementary Figure 1). The models also showed that participants with KS had greater odds of any shedding regardless of HIV status, whereas no significant differences in odds of shedding between HIV-positive and HIV-negative participants were detected when comparing participants with the same KS status (Supplementary Figure 1). KSHV quantity among days with KSHV DNA detected was lower among participants with KS and HIV, compared to those without KS or HIV (Figure 1C and 1D, Supplementary Figure 2).
![A and B, Distribution of participant-level oral Kaposi sarcoma–associated herpesvirus (KSHV) shedding rate in session 1 by study arm for all participants (A) and participants with KSHV DNA detected orally on at least 1 day (B). Each data point represents a participant. Boxes represent the interquartile range, horizontal lines within boxes represent the medians, and whiskers extend to the minimum and maximum values. The absence of a box indicates that the 25th and 75th percentiles were both 0%. Numbers shown above the x-axis represent the number of participants contributing data in each arm. See Supplementary Figure 1 for significance testing. C and D, Distribution of oral KSHV log10 copies/mL by study arm. C, Among all days with KSHV DNA detected in session 1. Each data point represents a sample with KSHV DNA detected; participants may contribute multiple data points. D, Using the median value per participant among days with KSHV DNA detected in session 1. Boxes represent the interquartile range, horizontal lines within boxes represent the medians, and whiskers extend to the minimum and maximum values. The dashed horizontal reference line represents the limit of detection, 150 copies/mL. Sample size for each arm is shown just above the x-axis. See Supplementary Figure 2 for significance testing. E, Oral KSHV shedding rate by median KSHV log10 copies/mL, among positive days, for each study arm. Each data point represents a participant with at least 1 day with oral KSHV DNA detected: Arm A (human immunodeficiency virus [HIV] seropositive HIV+/without Kaposi sarcoma [KS−]), n = 36; Arm B (HIV seronegative [HIV−]/KS−), n = 16; Arm C (HIV+/with Kaposi sarcoma [KS+]), n = 56; Arm D (HIV−/KS+), n = 9. Data have been jittered to allow viewing of overlapping points. The dashed vertical reference line represents the limit of detection, 150 copies/mL. Spearman correlation coefficients and P values are shown for each arm; pairwise comparisons of correlations for each study arm did not show significant differences when adjusting for multiple comparisons.](https://oup.silverchair-cdn.com/oup/backfile/Content_public/Journal/ofid/11/10/10.1093_ofid_ofae548/14/m_ofae548f1.jpeg?Expires=1748035636&Signature=WcgT0t0lIXoFXkuGSMBEZY0CvdmhTcEBRjtA3VI07nYWsIB9foeqDSSClb1u4IOFKxN9QGTQLWTctv7tXNY0qBOcNw-s6Qr7LY79ckjFVUHqVrCBZaAb-WwRiTy8x5UjKubLvOo0GJkvaIZqaDsedIW3~Oey-Z4lg-u7DTsKj9JDJCQAskVP52W3n2QtJqDHinpPE14nsqbZLvdhwVg9ZfIqvu1Z~u~pMGr56oNSwly7gkYe66l6nf2UgzT4qIHkXJTeqIlTeMSyMqa3jJV0xu3-wgGg4IPyPQzPGRa8YrPUooN~O~rjnsn1Sh4U1A0R0lrdAT8bqYjIQTi6brMeTw__&Key-Pair-Id=APKAIE5G5CRDK6RD3PGA)
A and B, Distribution of participant-level oral Kaposi sarcoma–associated herpesvirus (KSHV) shedding rate in session 1 by study arm for all participants (A) and participants with KSHV DNA detected orally on at least 1 day (B). Each data point represents a participant. Boxes represent the interquartile range, horizontal lines within boxes represent the medians, and whiskers extend to the minimum and maximum values. The absence of a box indicates that the 25th and 75th percentiles were both 0%. Numbers shown above the x-axis represent the number of participants contributing data in each arm. See Supplementary Figure 1 for significance testing. C and D, Distribution of oral KSHV log10 copies/mL by study arm. C, Among all days with KSHV DNA detected in session 1. Each data point represents a sample with KSHV DNA detected; participants may contribute multiple data points. D, Using the median value per participant among days with KSHV DNA detected in session 1. Boxes represent the interquartile range, horizontal lines within boxes represent the medians, and whiskers extend to the minimum and maximum values. The dashed horizontal reference line represents the limit of detection, 150 copies/mL. Sample size for each arm is shown just above the x-axis. See Supplementary Figure 2 for significance testing. E, Oral KSHV shedding rate by median KSHV log10 copies/mL, among positive days, for each study arm. Each data point represents a participant with at least 1 day with oral KSHV DNA detected: Arm A (human immunodeficiency virus [HIV] seropositive HIV+/without Kaposi sarcoma [KS−]), n = 36; Arm B (HIV seronegative [HIV−]/KS−), n = 16; Arm C (HIV+/with Kaposi sarcoma [KS+]), n = 56; Arm D (HIV−/KS+), n = 9. Data have been jittered to allow viewing of overlapping points. The dashed vertical reference line represents the limit of detection, 150 copies/mL. Spearman correlation coefficients and P values are shown for each arm; pairwise comparisons of correlations for each study arm did not show significant differences when adjusting for multiple comparisons.
Kaposi Sarcoma–Associated Herpesvirus Frequency and Quantity Summaries
| Summary Measure | HIV+/KS− | HIV−/KS− | HIV+/KS+ | HIV−/KS+ |
|---|---|---|---|---|
| No. of participants | 125 | 76 | 76 | 18 |
| No. of swabs collected per participant, median (range) | 28 (7–44) | 28 (7–35) | 27 (6–42) | 28 (13–28) |
| Frequency of oral shedding | ||||
| Participants with at least 1 positive specimen | 36 (29) | 16 (21) | 56 (74) | 9 (50) |
| Per-participant KSHV shedding ratea, median (range) | 0 (0–100) | 0 (0–96) | 28 (0–100) | 2 (0–100) |
| Per-participant KSHV shedding rate among those with at least 1 positive daya, median (range) | 51 (4–100) | 45 (4–96) | 40 (3–100) | 82 (4–100) |
| Total specimens | 3396 | 2110 | 1893 | 470 |
| Specimens with KSHV DNA detected | 491 (14) | 217 (10) | 645 (34) | 144 (31) |
| Quantity of oral sheddingb | ||||
| Per-participantc KSHV log10 copies/mL, median (range) | 3.8 (2.6–6.2) | 4.0 (2.6–5.8) | 3.1 (2.2–6.1) | 3.3 (2.6–4.6) |
| Overall KSHV log10 copies/mL, median (range) | 4.6 (2.2–7.9) | 4.5 (2.3–7.7) | 3.4 (2.2–7.0) | 4.0 (2.2–6.1) |
Data are presented as No. (%) unless otherwise indicated.
Abbreviations: HIV–, human immunodeficiency virus seronegative; HIV+, human immunodeficiency virus seropositive; IQR, interquartile range; KS–, without Kaposi sarcoma; KS+, with Kaposi sarcoma; KSHV, Kaposi sarcoma–associated herpesvirus.
aDefined as the percentage of specimens with KSHV DNA detected, per participant.
bOnly calculated among samples with KSHV DNA detected.
cMedian value per participant.
KSHV Shedding Episode Characteristics by Study Arm, Among Those With KSHV DNA Detected
Participants had a total of 230 episodes of oral KSHV shedding, with a median of 1 episode per participant for all study arms except for the HIV+/KS+ arm, where the median was 2 episodes per participant (Table 3). Fewer than half of the episodes had a well-defined start and stop; thus, durations computed among observed data were likely underestimates. Using the observed data, the median durations among all episodes ranged from 2 days in the HIV+/KS+ arm, 5 days in the HIV+/KS− and HIV−/KS− arms, and 10 days in the HIV−/KS+ arm. One-day episodes were common and comprised anywhere from 23% of episodes among HIV−/KS+ participants to 40% of episodes among HIV+/KS+ participants. Median peak KSHV viral load per episode was highest in the HIV−/KS+ group (4.5 log10 copies/mL) and lowest in the HIV+/KS+ group (3.2 log10 copies/mL).
Kaposi Sarcoma–Associated Herpesvirus Episode Characteristics of Study Participantsa
| Episode Summary | Total | HIV+/KS− | HIV−/KS− | HIV+/KS+ | HIV−/KS+ |
|---|---|---|---|---|---|
| Total No. of episodesa | 230 | 59 | 29 | 129 | 13 |
| No. of episodes per participant, median (range) | 2 (1–6) | 1 (1–6) | 1 (1–5) | 2 (1–6) | 1 (1–2) |
| Episode-level summaries | |||||
| Episodes with well-defined durationb | 102 (44) | 23 (39) | 13 (45) | 63 (49) | 3 (23) |
| Episode duration, d (naivec), median (range) | 3 (1–35) | 5 (1–29) | 5 (1–28) | 2 (1–35) | 10 (1–28) |
| Episodes of 1-d duration | 83 (36) | 20 (34) | 8 (28) | 52 (40) | 3 (23) |
| Minimum log10 copies/mL per episode, median (IQR) | 2.6 (0.0–5.8) | 2.7 (0.0–5.8) | 2.8 (0.0–4.7) | 2.5 (0.0–5.1) | 2.7 (0.0–3.0) |
| Maximum log10 copies/mL per episode, median (IQR) | 3.7 (2.2–7.9) | 4.1 (2.3–7.9) | 4.1 (2.3–7.7) | 3.2 (2.2–7.0) | 4.5 (2.8–6.1) |
| Median log10 copies/mL per episode, median (IQR) | 3.1 (2.2–6.4) | 3.4 (2.3–6.4) | 3.6 (2.3–5.7) | 3.0 (2.2–6.1) | 3.4 (2.6–4.6) |
| Participant-level summaries, using episode with maximum observed duration per participant | |||||
| No. of participants | 117 | 36 | 16 | 56 | 9 |
| Episodes with well-defined durationb | 36 (31) | 9 (25) | 4 (25) | 22 (39) | 1 (11) |
| Episode duration, d (naivec), median (range) | 9 (1–35) | 10 (1–29) | 8 (1–28) | 8 (1–35) | 13 (1–28) |
| Episodes of 1-d duration | 21 (18) | 7 (19) | 3 (19) | 10 (18) | 1 (11) |
| Minimum log10 copies/mL per episode, median (IQR) | 2.5 (0.0–5.8) | 2.6 (0.0–5.8) | 1.3 (0.0–4.4) | 1.1 (0.0–4.9) | 2.7 (0.0–3.0) |
| Maximum log10 copies/mL per episode, median (IQR) | 4.5 (2.2–7.9) | 4.8 (2.6–7.9) | 5.0 (2.6–7.7) | 4.0 (2.2–7.0) | 4.8 (3.0–6.1) |
| Median log10 copies/mL per episode, median (IQR) | 3.4 (2.2–6.4) | 3.7 (2.5–6.4) | 3.7 (2.3–5.7) | 3.2 (2.2–6.1) | 3.5 (2.6–4.6) |
Data are presented as No. (%) unless otherwise indicated.
Abbreviations: HIV–, human immunodeficiency virus seronegative; HIV+, human immunodeficiency virus seropositive; IQR, interquartile range; KS–, without Kaposi sarcoma; KS+, with Kaposi sarcoma.
aIncludes only participants with Kaposi sarcoma–associated herpesvirus (KSHV) DNA detected in at least 1 oral swab. Episodes defined by consecutive positive days, allowing 1 or more instances of a single negative or missing value within the string of positives.
bWell-defined duration is defined by episode start preceded by 2 consecutive negatives and episode end followed by 2 consecutive negatives.
cIncluding episodes without well-defined duration, using observed durations. These are likely underestimates.
Selecting the episode with the maximum observed duration for each participant, we performed some additional comparisons among study arms. First, we grouped participants into 5 categories (maximum episode duration 1 day, 2–5 days, 6–10 days, >10 days with shedding rate <100%, and shedding rate = 100%) based on observed episode duration and shedding rate. Individual shedding patterns for participants within each category are shown in Supplementary Figure 3. Over the 28-day sampling period, we observed both episodic and continuous KSHV shedding patterns. All study arms had at least 1 participant with a maximum duration episode of only 1 day. Episodes lasting >10 days were more common among the HIV−/KS− arm, although unlike the other study arms, there were no participants in that arm with continuous shedding during the sampling period. Next, we used survival methodology to compare episode duration among study arms, while treating episode durations that were not well-defined as censored observations; there was no significant difference in episode duration among the 4 study arms (P = .26, log-rank test). Maximum KSHV copy number among these episodes of maximum duration per participant appeared lowest among the HIV+/KS+ group (Kruskal-Wallis P = .054 for differences among the 4 arms; individual pairwise comparisons accounting for multiple comparisons not statistically significant).
Relationship Between Shedding Rate, Quantity, and Episode Characteristics, Among Those With KSHV DNA Detected
Among participants with KSHV DNA detected on at least 1 day, per-participant oral KSHV shedding rate correlated with median oral KSHV log10 copies/mL among positive days, for all groups (Figure 1E). When selecting the longest episode per participant, peak KSHV log10 copies/mL correlated with duration such that brief, single, or recurrent 1- to 10-day episodes generally had lower peak viral loads than episodes lasting >10 days, for all study arms (Supplementary Figures 3 and 4). All groups had episodes of both long and short durations, and episodes lasting <10 days with peak viral loads <4 log10 copies/mL were common among the 4 groups: HIV+/KS+ (23/56 [41%] participants), HIV+/KS− (12/36 [33%]), HIV−/KS− (5/16 [31%]), and HIV−/KS+ (2/9 [22%]).
Among individual shedders in all 4 groups, high-frequency shedders typically had high median viral loads among positive samples whereas shedding rates <60% were usually associated with lower median viral loads (Figure 1E and Figure 2). Considerable variability was noted in viral load within individuals as well with viral loads occasionally varying over several orders of magnitude (Figure 2).
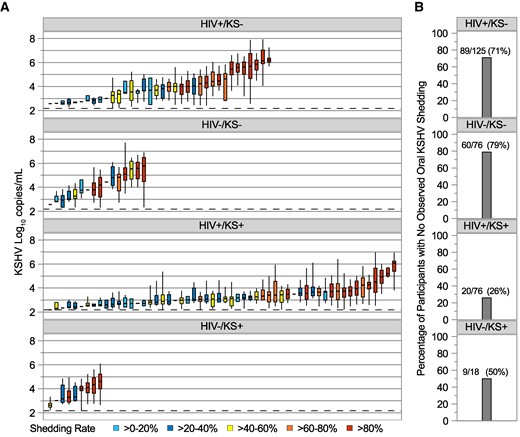
A, Distribution of oral Kaposi sarcoma–associated herpesvirus (KSHV) viral loads for individual participants, using session 1 data only, by study arm. Each boxplot shows data from a participant; boxes represent interquartile range (IQR), horizontal lines within boxes represent medians, and whiskers extend to minimum and maximum values. Participants with only a median bar and no box had too few positive samples to generate an IQR. The dashed horizontal reference line represents the limit of detection, 150 copies/mL. Participants are sorted along the x-axis by median KSHV log10 copies/mL and boxes are color coded according to shedding rate among all session 1 samples. B, Percentage of participants with no observed oral KSHV DNA during session 1, by study arm. Numbers atop the bars show the number of participants with no observed shedding over the total number of participants in each arm and computed percentage. See Supplementary Figures 1 and 2 for significance testing. Abbreviations: HIV–, human immunodeficiency virus seronegative; HIV+, human immunodeficiency virus seropositive; KS–, without Kaposi sarcoma; KS+, with Kaposi sarcoma; KSHV, Kaposi sarcoma–associated herpesvirus.
Within-Person Correlation in KSHV Shedding Over Longer Follow-up Among HIV+/KS− Persons
Among the 125 HIV+/KS− participants, 92 collected oral swabs in >1 defined time category from the start of session 1 and thus contributed data to evaluate shedding patterns over a longer period (Supplementary Methods). The 92 individuals contributed a median of 5 time categories each (range, 2–6) over a median of 15.8 months of follow-up (range, 3.6–25.4 months). The time categories were comprised of a median of 28 oral swabs collected (range, 7–60). Supplementary Figure 5 shows oral KSHV shedding rates by time category for these participants. Though some participants displayed high variability in shedding rates, the majority (71/92 [77%]) demonstrated ≤30% absolute change in shedding rates, compared to the initial time category. Correlations between shedding rates in later time categories and the initial shedding rate were generally high (Supplementary Figure 6). However, model estimates adjusted for CD4 count and HIV viral load showed significantly lower shedding rates in days 210 to <330 compared to the initial shedding rate, which generally did not persist (Supplementary Figure 7).
Patterns in median oral KSHV copies/mL among 28 HIV+/KS− participants contributing >1 time category with at least 1 day with KSHV DNA detected are shown in Supplementary Figure 8. Of the 28 participants, 13 (46%) had follow-up median copy number vary <1 log10 compared to the initial median copy number. Moderate correlations were observed between the initial and subsequent median log10 copy number (Supplementary Figure 9). Similar to shedding rates, adjusted model estimates showed that KSHV quantity in days 210 to <330 was lower than the initial KSHV quantity, but this decrease did not persist (Supplementary Figure 10).
DISCUSSION
We describe the general pattern of KSHV oral shedding in a cohort of Ugandan adults. This cohort builds on past studies of KSHV oral shedding by specifically considering viral load and by differentiating episodic versus persistent shedding patterns at the individual level. We found that the presence of any shedding was more common in individuals with KS, regardless of HIV status, but all types of viral kinetics—including no shedding, low viral load intermittent shedding, and persistent high viral load shedding—were noted in all 4 groups. Oral shedding rate was similar between the 4 groups when only shedders were analyzed but viral load was lower by 0.9 log10 among HIV+/KS+ individuals compared to HIV−/KS− individuals. This difference in viral loads was also reported in a previous, smaller study that measured KSHV shedding among Ugandan individuals grouped by KS and HIV status [13]; compared to that study, our larger study also found similar estimates of oral KSHV shedding rates within groups defined by presence of KS and HIV. We found a positive correlation between shedding rate and median viral load in all 4 groups. Overall, these results show deep variability in shedding kinetics among individuals, and these differences are only partially explained by KS or HIV coinfection. However, our study demonstrates that distinct shedding “phenotypes” of low versus high frequency and copy number oral KSHV shedding appear to persist over time, at least among HIV+/KS− individuals. Persons with persistent high-level KSHV shedding may be particularly important targets for interventions to reduce oral KSHV replication to prevent the development of KS in these individuals or to limit KSHV transmission to others.
These results raise several important unanswered questions that our study was not able to address. First, what drives the distinct observed shedding patterns other than HIV status and KS status? One key unmeasured variable in our study is the time of initial KSHV infection, as shedding frequency or quantity may be higher closer to primary infection. In Uganda, most persons are infected during adolescence, however, so we expect that most of our participants had primary KSHV infection for several years before study enrollment [29, 30]. Our longitudinal analyses of shedding rates and quantity also suggest that these outcomes are somewhat stable over time within individuals with some exceptions, raising the unanswered question of whether a shedding “set point” may be established soon after primary infection. Other potential key unmeasured variables in this current study are inoculum dose at the time of acquisition, viral strain, host immune parameters, recent reinfection, and other medical comorbidities. In addition, because we did not perform serologic testing, we cannot be certain whether the KS-negative participants who did not demonstrate viral shedding were infected with KSHV. However, given the high seroprevalence of KSHV in Uganda [31–33], it is likely that most of these participants were infected. We also note that HIV care recommendations have changed since the enrollment period for this study, when ART was initiated based on CD4-T-cell count rather than universally at HIV diagnosis. However, the later initiation of ART among people with HIV at that time allowed us to describe KSHV shedding patterns without potential confounding from ART use.
Our findings also suggest several avenues for future research. An important future focus will be on understanding how systemic and local immune responses influence viral shedding, including whether tissue-resident immune responses are responsible for the rapid elimination of local shedding in individuals whose infection manifests only as periodic low viral load blips. Prospective cohorts that follow low and high shedders without KS over prolonged periods could help determine if persistent, high copy number oral KSHV shedding is predictive of tumor development. If so, novel strategies directed at KSHV to prevent KS should be considered, including anti-KSHV antiviral therapies or KSHV vaccination. Oral valganciclovir lowers KSHV shedding rate, though it remains unknown whether antiviral therapy has a role in preventing KSHV-associated tumors [14]. Similarly, among individuals with KS, further research is needed to establish whether changes in oral viral shedding could serve as a biomarker for therapeutic response. Finally, another key area of future research is understanding the role of KSHV viral load in driving KSHV transmission. We have demonstrated in previous studies that household levels of cytomegalovirus and human herpesvirus 6 are predictive of subsequent acquisition [34, 35]. To discern whether similar transmission dynamics are relevant for KSHV would require detailed household cohort studies that attempt to capture incident infection in young children.
In conclusion, we demonstrate substantial variability in KSHV oral shedding among Ugandan adults regardless of HIV and KS status, though individuals with KS are more likely to have detectable oral KSHV shedding. However, some individuals may have stable phenotypes of intermittent, low copy number shedding versus persistent, high copy number shedding. Understanding the biological mechanisms underpinning these differences could help guide the development of new biomarkers, strategies to reduce KSHV transmission, and ultimately the development of a new preventive or therapeutic KSHV vaccine or other immune-based therapeutic approaches.
Supplementary Data
Supplementary materials are available at Open Forum Infectious Diseases online. Consisting of data provided by the authors to benefit the reader, the posted materials are not copyedited and are the sole responsibility of the authors, so questions or comments should be addressed to the corresponding author.
Notes
Acknowledgments. We are grateful to the study participants and the study team, whose commitment made this study possible.
Author contributions. E. M. K. assisted in the study design, performed the statistical analyses, interpreted results, and wrote the manuscript. J. T. S., C. C., and W. P. designed the study and provided funding for the work. W. P. and J. T. S. interpreted the results, provided clinical input, and wrote the manuscript. I. M., J. N., and F. O. acquired data and reviewed the manuscript. D. A. S. interpreted results and reviewed the manuscript. C. C. and J. O. reviewed the manuscript.
Financial support. This work was supported by the National Cancer Institute at the National Institutes of Health (grant numbers R01 CA239593 to W. P., J. T. S., and J. O.; K23 CA150931 to W. P.; U54 CA190146 and P30 CA015704 to C. C.) and the National Institute of Allergy and Infectious Diseases at the National Institutes of Health (grant number P30 AI027757 to C. C.).
References
Author notes
Presented in part: 25th International Conference on Kaposi Sarcoma Herpesvirus and Related Agents, Dar es Salaam, Tanzania, 19–23 June 2023.
W. P. and J. T. S. contributed equally to this work.
W. P. and J. T. S. contributed equally to this work.
Potential conflicts of interest. J. T. S. received consulting fees from Pfizer for advising on SARS-CoV-2 therapeutics and GlaxoSmithKline for advising on HSV vaccines. C. C. receives fees for consulting from Recordati Rare Disease, fees for sitting on the scientific advisory board of Viracta Therapeutics, and research funding from ImmunityBio and Janssen. All other authors report no potential conflicts.


Comments