


Abstract
The association between early-life respiratory syncytial virus (RSV) infections and later respiratory morbidity is well established. However, there is limited evidence on factors that influence this risk. We examined sociodemographic and perinatal factors associated with later childhood respiratory morbidity requiring secondary care following exposure to a laboratory-confirmed RSV episode in the first 2 years.
We used a probabilistically linked whole-of-population-based birth cohort including 252 287 children born in Western Australia between 2000 and 2009 with follow-up to the end of 2012. Cox proportional hazards models estimated adjusted hazard ratios (aHRs) of the association of various risk factors with the first respiratory episode for asthma, wheezing, and unspecified acute lower respiratory infection beyond the age of 2 years.
The analytic cohort included 4151 children with a confirmed RSV test before age 2 years. The incidence of subsequent respiratory morbidity following early-life RSV infection decreased with child age at outcome (highest incidence in 2–<4-year-olds: 41.8 per 1000 child-years; 95% CI, 37.5–46.6), increased with age at RSV infection (6–<12-month-olds: 23.6/1000 child-years; 95% CI, 19.9–27.8; 12–<24-month-olds: 22.4/1000 child-years; 95% CI, 18.2–22.7) and decreasing gestational age (50.8/1000 child-years; 95% CI, 33.5–77.2 for children born extremely preterm, <28 weeks gestation). Risk factors included age at first RSV episode (6–<12 months: aHR, 1.42; 95% CI, 1.06–1.90), extreme prematurity (<28 weeks: aHR, 2.22; 95% CI, 1.40–3.53), maternal history of asthma (aHR, 1.33; 95% CI, 1.04–1.70), and low socioeconomic index (aHR, 1.76; 95% CI, 1.03–3.00).
Our results suggest that in addition to preterm and young infants, children aged 12–<24 months could also be potential target groups for RSV prevention to reduce the burden of later respiratory morbidities associated with RSV.
Respiratory syncytial virus (RSV) is one of the major pathogens associated with acute lower respiratory infections (ALRIs), a major contributor of global infectious disease burden in children. In 2019, an estimated 33.0 million episodes of RSV-associated ALRIs and 3.6 million hospital admissions occurred in children aged <5 years [1, 2]. In Australia, for every 100 000 hospitalized children aged <5 years, an estimated 418 have RSV [3]. However, the true disease burden is likely to be much greater and not restricted to hospital admissions for a number of reasons, including health care provider discretion and clinical decision-making, differences in coding and viral testing practices, and patient presentation. Our group recently reported that current estimates of RSV hospitalization rates may underestimate the true burden by 32%–57% [4]. Using population-based data in Western Australia (WA), we have also reported that up to 32% of emergency department (ED) presentations in children aged <5 years were all-cause ALRI-related [2].
It has been hypothesized that early-life RSV infection is associated with impaired lung function and an increased risk of respiratory morbidity including wheezing, asthma, and unspecified ALRI in later childhood. Numerous small and larger studies have been conducted to establish whether this association is causal, examined comprehensively in a systematic review by Brunwasser et al. [5]. More recently, 2 studies have examined this association in RSV-positive and RSV-negative children, with contrasting results [6, 7].
Although there is a well-established link between RSV-ALRI and subsequent respiratory morbidity [5, 8] and data exist on the high burden of RSV infection in certain subgroups of children, limited evidence exists as to how factors such as age at first RSV exposure and gestational age influence the subsequent risk of later respiratory morbidity for children who were exposed to RSV infections during their early life. Understanding the sociodemographic and perinatal factors contributing to later respiratory morbidity following early-life RSV exposure allows the identification of risk groups that can be targeted for RSV prevention measures. Such measures include maternal vaccines in late phase 3 trials [9] and a single-dose monoclonal antibody (nirsevimab) that has recently shown 62.1% efficacy against RSV-ALRI hospitalization up to 150 days postinjection in healthy term infants [10].
Using established record linkage infrastructure in WA [11], we examined sociodemographic and perinatal factors associated with later respiratory morbidity requiring secondary care following early-life laboratory-confirmed RSV episodes.
METHODS
Data Sources
We conducted a whole-of-population-based cohort study using probabilistically linked administrative data of all births in WA between 2000 and 2009 with follow-up to December 31, 2012. Data sources include the Midwives Notifications System, which comprises state-wide perinatal information on >99% of births in WA [12], birth and death registries, hospital morbidity data collection, ED data collection, and routine respiratory pathogen testing from the state's sole public pathology provider, PathWest (Figure 1). Data were probabilistically linked using best practice protocols through Data Services at the WA Department of Health [11]. Probabilistic linkage compares groups of records using complex nonunique identifiers or field matching algorithms [13]. These algorithms compare common fields, such as given name, surname, date of birth, and other relevant fields (dependent on the contents and context of the data set) [14] and provide a similarity weighting index that is positively associated with the likelihood that 2 or more records belong to the same individual [13]. Clerical review is required to assess potential nonmatched records; this process has been shown to reduce the error rate of matching to <0.1% [15].
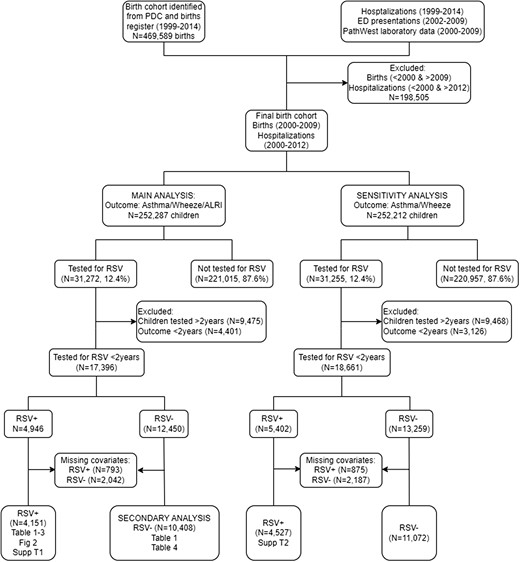
Flow diagram of cohort selection. Abbreviation: RSV, respiratory syncytial virus.
We defined our analytical cohort as children who presented with their first laboratory-confirmed RSV episode from birth to 2 years of age (the “exposure”) using hospitalizations and ED presentations linked to laboratory data. Hospitalization records with an admission and discharge date between January 1, 2000, and December 31, 2012, were included to match the same time period when routine laboratory data were available. ED presentations were restricted to those between January 1, 2002, and December 31, 2009, due to data availability. We included all state-wide admissions/presentations in children aged <16 years with any diagnosis using International Statistical Classification of Diseases and Related Health Problems,10th Revision, Australian Modification (ICD-10-AM) codes.
Our primary outcome of interest was the first respiratory morbidity episode beyond the age of 2 years after an initial RSV-confirmed episode. We defined later respiratory morbidity episodes as follows: ED presentations with diagnostic codes associated with wheeze (ICD-10-AM codes R06.2, R05, symptom codes CH, CC) or asthma (ICD-10-AM codes J45, J46, symptom code SQA) or unspecified ALRI (ICD-10-AM codes J22, symptom code SQD); or a hospital admission with principal or co-diagnosis associated with wheeze (ICD-10-AM codes R06.2, R05), asthma (ICD-10-AM codes J45, J46), or unspecified ALRI (ICD-10-AM code J22). Our focus was on noninfectious later chronic respiratory morbidity following an RSV infection, rather than acute respiratory morbidity. These were combined into a primary composite outcome measure. As per previous analyses, interhospital transfers were collapsed [16, 17]. For hospitalizations, all principal and 20 co-diagnoses were used. For ED presentations, a previously published hierarchy of coding was applied whereby the principal diagnosis was used in preference over other free-text diagnosis and symptom codes [2]. From herein, we refer to hospital admissions and ED presentations as secondary care episodes.
We extracted respiratory specimen testing records with a specimen collection date between January 1, 2000, and December 31, 2009. Where tested for RSV, positive and negative RSV results from polymerase chain reaction (PCR; employed in later years) and/or immunofluorescence (IF; employed in the earlier years of this cohort) were included [2]. We temporally linked RSV laboratory testing records with secondary care episodes of children with a specimen collection date within 48 hours of hospital admission or ED presentation, also described previously [16, 17].
A sensitivity analysis used only wheezing and asthma secondary care episodes as a secondary outcome.
Children were excluded if they had asthma, wheeze, or unspecified ALRI before follow-up commenced (ie, before 2 years of age). We also excluded children with a diagnosis of asthma, wheeze, or ALRI within 30 days of an RSV-positive test result.
We included sociodemographic, maternal, and child risk factors based on published literature [8, 18–20]. Maternal and sociodemographic variables included maternal age at birth of the cohort child (<20 years, 20–24 years, 25–29 years, 30–34 years, ≥35 years), smoking during pregnancy (yes, no), maternal history of asthma (yes, no), index of socioeconomic disadvantage (quintiles) [21], remoteness index (major city, inner regional, outer regional, remote, very remote) [22], and multiple births (yes, no). Child variables included age at index RSV-confirmed episode (<3 months, 3–<6 months, 6–<12 months, 12–<24 months), Aboriginal and/or Torres Strait Islander status (Aboriginal, non-Aboriginal), derived using a validated algorithm [23], mode of delivery (cesarean, vaginal/instrumental), sex of the child (male, female), gestational age (<28 weeks, 29–32 weeks, 33–36 weeks, ≥37 weeks), season of birth (Spring: September–November; Summer: December–February; Autumn: March–May; Winter: June–August), percentage of optimal birth weight (in kg) [24], and number of older siblings at birth (none, 1, 2 or more). Year of birth was included in the models as a continuous variable.
Statistical Analysis
As an initial descriptive analysis, we reported the first composite outcome as an overall rate per 1000 child-years and rates stratified by age at first RSV-confirmed episode, gestational age, and age at outcome. Follow-up was defined as the time from the child's second birthday to occurrence of the outcome, death, or the end of the study (December 31, 2012), whichever came first. We split the follow-up period into the age subgroups 2–<4 years, 4–<6 years, and ≥6 years. The final multivariable Cox proportional hazards model was adjusted for all covariates based on previous literature and published experience of analyses of WA data assessing risk factors for ALRI in children [2] and estimated adjusted hazard ratios (aHRs) with 95% confidence intervals. We conducted a complete case analysis and removed children with missing data on any covariates of interest.
We conducted a secondary analysis on a subset of the cohort who were tested for RSV but were negative (RSV-negative) in their first 2 years of life as a comparison. For easier presentation and interpretation, we also supplemented a graphical association of the primary outcome with gestational age using a spline term (Supplementary Figure 1).
RESULTS
Cohort Description
Our cohort comprised 252 287 children born between 2000 and 2009, with a total of 23 708.7 child-years of follow-up. Of these, 31 272 children had a laboratory test for RSV. We further excluded 9475 children who were tested after the age of 2 years and 4401 children who had the outcome before the age of 2 years (Figure 1). Finally, we excluded 2835 (793 RSV+ and 2042 RSV−) children with incomplete covariate data. We therefore included 4151 children who had a confirmed RSV episode before age 2 years with complete information for the main analysis (Figure 1). The median age at first subsequent respiratory morbidity episode was 6.5 years, with a maximum age at the end of the follow-up period of 12.9 years. Among the cohort tested for RSV, a higher proportion of RSV-positive children reported a subsequent morbidity episode (11.0% vs 7.6%) compared with RSV-negative children. A larger proportion of RSV-positive children were born in autumn compared with RSV-negative children. Noticeably, 42.7% of RSV+ children were between 6 and <24 months of age (Table 1).
Sociodemographic and Perinatal Characterstics of Children Born in WA Between 2000 and 2009 who Were Hospitalized and Tested for RSV and Did Not Have Documented Asthma in the First Two Years (n = 14 559)
| Tested for RSV in First 2 Years of Life | ||||
|---|---|---|---|---|
| Characteristic | Total (n = 14 559) | RSV-Negative (n = 10 408) | RSV-Confirmed (n = 4151) | |
| No. (%) | No. (%) | No. (%) | ||
| Subsequent respiratory morbidity | ||||
| No | 13 305 (91.4) | 9612 (92.4) | 3693 (89.0) | |
| Yes | 1254 (8.6) | 796 (7.6) | 458 (11.0) | |
| Maternal and sociodemographic factors | ||||
| Maternal age at birth | ||||
| <20 y | 1009 (6.9) | 696 (6.7) | 313 (7.5) | |
| 20–24 y | 2777 (19.1) | 1963 (18.9) | 814 (19.6) | |
| 5–29 y | 3959 (27.2) | 2835 (27.2) | 1124 (27.1) | |
| 30–34 y | 4265 (29.3) | 3085 (29.6) | 1180 (28.4) | |
| ≥35 years | 2549 (17.5) | 1829 (17.6) | 720 (17.3) | |
| Smoking during pregnancy | ||||
| No | 11 271 (77.4) | 8125 (78.1) | 3146 (75.8) | |
| Yes | 3288 (22.6) | 2283 (21.9) | 1005 (24.2) | |
| Maternal history of asthma | ||||
| No | 12 609 (86.6) | 9033 (86.8) | 3576 (86.1) | |
| Yes | 1950 (13.4) | 1375 (13.2) | 575 (13.9) | |
| Socioeconomic disadvantage | ||||
| 0%–10% (most disadvantaged) | 1715 (11.8) | 1200 (11.5) | 515 (12.4) | |
| 11%–25% | 2522 (17.3) | 1759 (16.9) | 763 (18.4) | |
| 26%–75% | 7254 (49.8) | 5226 (50.2) | 2028 (48.9) | |
| 76%–90% | 2037 (14.0) | 1467 (14.1) | 570 (13.7) | |
| 91%–100% (least disadvantaged) | 1031 (7.1) | 756 (7.3) | 275 (6.6) | |
| Remoteness Index | ||||
| Major city | 11 248 (77.3) | 8051 (77.4) | 3197 (77.0) | |
| Inner regional | 1319 (9.1) | 946 (9.1) | 373 (9.0) | |
| Outer regional | 1165 (8.0) | 811 (7.8) | 354 (8.5) | |
| Remote | 516 (3.5) | 370 (3.6) | 146 (3.5) | |
| Very remote | 311 (2.1) | 230 (2.2) | 81 (2.0) | |
| Child factors | ||||
| Age at first RSV test | ||||
| <3 mo | 4573 (31.4) | 3324 (31.9) | 1249 (30.1) | |
| 3–<6 mo | 2829 (19.4) | 1700 (16.3) | 1129 (27.2) | |
| 6–<11 mo | 3605 (24.8) | 2546 (24.5) | 1059 (25.5) | |
| 12–<24 mo | 3552 (24.4) | 2838 (27.3) | 714 (17.2) | |
| Aboriginal status | ||||
| Non-Aboriginal | 13 002 (89.3) | 9314 (89.5) | 3688 (88.8) | |
| Aboriginal | 1557 (10.7) | 1094 (10.5) | 463 (11.2) | |
| Delivery mode | ||||
| Cesarean | 5222 (35.9) | 3733 (35.9) | 1489 (35.9) | |
| Vaginal/instrumental | 9337 (64.1) | 6675 (64.1) | 2662 (64.1) | |
| Infant sex | ||||
| Female | 6455 (44.3) | 4586 (44.1) | 1869 (45.0) | |
| Male | 8104 (55.7) | 5822 (55.9) | 2282 (55.0) | |
| Gestational age | ||||
| <28 wk | 534 (3.7) | 442 (4.2) | 92 (2.2) | |
| 29–32 wk | 651 (4.5) | 513 (4.9) | 138 (3.3) | |
| 33–36 wk | 1683 (11.6) | 1141 (11.0) | 542 (13.1) | |
| ≥37 wk | 11 691 (80.3) | 8312 (79.9) | 3379 (81.4) | |
| Season of birth | ||||
| Spring (Sept–Nov) | 3298 (22.7) | 2605 (25.0) | 693 (16.7) | |
| Summer (Dec–Feb) | 3285 (22.6) | 2420 (23.3) | 865 (20.8) | |
| Autumn (Mar–May) | 4097 (28.1) | 2710 (26.0) | 1387 (33.4) | |
| Winter (Jun–Aug) | 3879 (26.6) | 2673 (25.7) | 1206 (29.1) | |
| No. of other siblings | ||||
| 0 | 3429 (23.6) | 2622 (25.2) | 807 (19.4) | |
| 1 | 4342 (29.8) | 3093 (29.7) | 1249 (30.1) | |
| ≥2 | 6788 (46.6) | 4693 (45.1) | 2095 (50.5) | |
| Multiple births | ||||
| Yes | Singleton birth | 13 648 (93.7) | 9749 (93.7) | 3899 (93.9) |
| No | Multiple birth | 911 (6.3) | 659 (6.3) | 252 (6.1) |
Abbreviation: RSV, respiratory syncytial virus.
Respiratory Morbidity Following Early-Life RSV
During the study follow-up time, 458 (12.5%) children with laboratory-confirmed RSV before the age of 2 years had their first asthma, wheezing, or unspecified ALRI episode after 2 years of age, representing an overall incidence rate of 19.3/1000 child-years (95% CI, 17.6–21.2) (Table 2). The incidence rate of the first episode of subsequent respiratory morbidity following an early-life RSV episode decreased with age at first episode (41.8/1000 child-years; 95% CI, 37.5–46.6; for children aged 2–<4 years; 13.0/1000 child-years; 95% CI, 10.4–16.2; for children aged 4–<6 years; 5.7/1000 child-years; 95% CI, 4.4–7.4; for children aged ≥6 years) (Table 2).
Age-Specific Frequency and Incidence per 1000 Child-Years of First Subsequent Respiratory Morbidity Episodea Following Early-Life RSV Hospitalization in the First Two Years (n = 4151)
| Subgroup | No. | Time at Risk, Child-Years | Rates/1000 (95% CI) |
|---|---|---|---|
| Overall | 458 | 23 708.7 | 19.3 (17.6–21.2) |
| Age group of subsequent respiratory morbiditya | |||
| 2–<4 y | 322 | 7705.4 | 41.8 (37.5–46.6) |
| 4–<6 y | 80 | 6165.7 | 13.0 (10.4–16.2) |
| ≥6 y | 56 | 9837.6 | 5.7 (4.4–7.4) |
| Age at first RSV episode | |||
| <3 mo | 117 | 7218.2 | 16.2 (13.5–19.4) |
| 3–<6 mo | 116 | 6754.0 | 17.2 (14.3–20.6) |
| 6–<12 mo | 138 | 5859.6 | 23.6 (19.9–27.8) |
| 12–<24 mo | 87 | 3877.0 | 22.4 (18.2–27.7) |
| Gestational age | |||
| <28 wk | 22 | 433.0 | 50.8 (33.5–77.2) |
| 29–32 wk | 21 | 693.2 | 30.3 (19.8–46.5) |
| 33–36 wk | 55 | 2993.1 | 18.4 (14.1–23.9) |
| ≥37 wk | 360 | 19 589.5 | 18.4 (16.6–20.4) |
Abbreviations: ED, emergency department; RSV, respiratory syncytial virus.
Respiratory morbidity episode defined as hospitalization or ED presentation for asthma, wheezing, or unspecified acute lower respiratory infection.
The incidence rate of subsequent respiratory morbidity differed by age at first RSV episode, with children who experienced their first RSV at age 6–<12 months having rates of subsequent respiratory morbidity ∼1.5 times higher than those who experienced their first RSV at age <3 months (23.6/1000 child-years; 95% CI, 19.9–27.8; vs 16.2/1000 child-years; 95% CI, 13.5–19.4; respectively); the rate was 1.4 times higher in children 12–24 months of age (22.4/1000 child-years; 95% CI, 18.2–27.7) (Table 2). Children born extremely preterm (<28 weeks) had incidence rates of subsequent respiratory morbidity almost 2.8 times higher (50.8/1000 child-years; 95% CI, 33.5–77.2) compared with children born at term (18.4/1000 child-years; 95% CI, 16.6–20.4) (Table 2).
Factors Associated With Later Respiratory Morbidity After Early-Life RSV
In a multivariable model, risk factors for later respiratory morbidity included age at first RSV episode (6–<12 months: aHR, 1.42; 95% CI, 1.06–1.90), being born extremely preterm (<28 weeks: aHR, 2.22; 95% CI, 1.40–3.53), maternal history of asthma (aHR, 1.33; 95% CI, 1.04–1.70), and low socioeconomic index (aHR, 1.76; 95% CI, 1.03–3.00; for those in the lowest percentile; and aHR, 1.96; 95% CI, 1.19–3.22; for those in the 11–25th percentile) (Table 3). In the adjusted model, the factor with the largest magnitude of risk was gestational age <28 weeks (Figure 2). A spline model of gestational age showed a dose–response association of the primary outcome with higher risk at lower gestational age (<28 weeks) as compared with 37 weeks of gestation (Supplementary Figure 1).
Hazard Ratios for Later Respiratory Morbiditya After Early-Life RSV Hospitalization in the First Two Years of Life (n = 4151)
| Hazard Ratio (95% CI) | ||
|---|---|---|
| Variables | Unadjusted | Adjusted |
| Age at first RSV exposure | ||
| <3 mo | Ref | Ref |
| 3–<6 mo | 1.09 (0.84–1.41) | 1.00 (0.75–1.31) |
| 6–<12 mo | 1.44 (1.12–1.84) | 1.42 (1.06–1.90) |
| 12–<24 mo | 1.35 (1.02–1.78) | 1.28 (0.95–1.71) |
| Indigenous status | ||
| Non-Aboriginal | 1.00 (0.74–1.35) | 1.11 (0.79–1.56) |
| Aboriginal | Ref | Ref |
| Mode of delivery | ||
| Cesarean | 1.11 (0.92–1.34) | 1.07 (0.88–1.30) |
| Vaginal/instrumental | Ref | Ref |
| Gender | ||
| Female | Ref | Ref |
| Male | 1.16 (0.97–1.40) | 1.18 (0.98–1.43) |
| Maternal age at child's birth | ||
| <20 y | 0.96 (0.66–1.40) | 0.87 (0.58–1.31) |
| 20–24 y | 1.13 (0.87–1.47) | 1.11 (0.85–1.45) |
| 25–29 y | Ref | Ref |
| 30–34 y | 0.97 (0.76–1.24) | 1.02 (0.79–1.31) |
| ≥35 y | 0.82 (0.61–1.10) | 0.86 (0.63–1.17) |
| Smoking during pregnancy | ||
| No | ||
| Yes | 0.88 (0.71–1.10) | 0.87 (0.69–1.10) |
| Gestational age | ||
| <28 wk | 2.51 (1.64–3.87) | 2.22 (1.40–3.53) |
| 29–32 wk | 1.55 (1.00–2.41) | 1.52 (0.96–2.43) |
| 33–36 wk | 0.98 (0.73–1.30) | 0.95 (0.71–1.28) |
| ≥37 wk | Ref | Ref |
| SEIFA | ||
| 0%–10% (most disadvantaged) | 1.59 (1.00–2.64) | 1.76 (1.03–3.00) |
| 11%–25% | 1.87 (1.16–3.03) | 1.96 (1.19–3.22) |
| 26%–75% | 1.57 (1.00–2.49) | 1.61 (1.01–2.56) |
| 76%–90% | 1.39 (0.83–2.32) | 1.38 (0.82–2.31) |
| 91%–100% (least disadvantaged) | Ref | Ref |
| Maternal history of asthma | ||
| No | Ref | Ref |
| Yes | 1.34 (1.05–1.71) | 1.33 (1.04–1.70) |
| Season of birth | ||
| Spring | Ref | Ref |
| Summer | 0.95 (0.71–1.27) | 0.99 (0.73–1.33) |
| Autumn | 0.90 (0.69–1.17) | 1.12 (0.82–1.53) |
| Winter | 0.82 (0.62–1.09) | 1.00 (0.73–1.37) |
| Remoteness | ||
| Major city | 0.82 (0.45–1.50) | 0.85 (0.45–1.61) |
| Inner regional | 0.61 (0.31–1.22) | 0.60 (0.29–1.22) |
| Outer regional | 0.58 (0.29–1.15) | 0.58 (0.28–1.19) |
| Remote | 0.85 (0.40–1.82) | 0.91 (0.42–1.98) |
| Very remote | Ref | Ref |
| Percent optimal birth weight | 1.01 (1.00–1.01) | 1.00 (1.00–1.01) |
| No. of older siblings | ||
| 0 | 1.30 (1.03–1.65) | 1.24 (0.96–1.60) |
| 1 | 1.21 (0.98–1.50) | 1.22 (0.98–1.51) |
| ≥2 siblings | Ref | Ref |
| Multiple birth | ||
| Singleton birth | Ref | Ref |
| Multiple birth | 1.02 (0.70–1.50) | 0.98 (0.64–1.48) |
| Birth yearb | 1.05 (1.01–1.08) | 1.05 (1.01–1.09) |
Models were adjusted for maternal age at birth, maternal smoking status, maternal history of asthma, parity, socioeconomic status, remoteness index, delivery mode, season of birth, child Aboriginal status, gestational age at birth, birth year, number of siblings, and age at RSV test.
Abbreviations: ED, emergency department; RSV, respiratory syncytial virus; SEIFA, socioeconomic index for areas [21].
Respiratory morbidity episode defined as hospitalization or ED presentation for asthma, wheezing, or unspecified acute lower respiratory infection.
Included as a continuous variable.
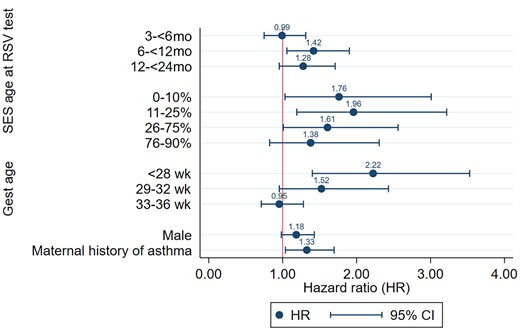
Adjusted hazard ratios of subsequent respiratory morbiditya after 2 years of age following early-life exposure to RSV infection. The model was adjusted for parity, maternal age, percent optimal birth weight, multiple birth, birth year, mode of delivery, remoteness, seasons of birth, and smoking. aRespiratory morbidity episode defined as hospitalization or ED presentation for asthma, wheezing, or unspecified acute lower respiratory infection. Abbreviations: gest age, gestational age; RSV, respiratory syncytial virus; SES, socioeconomic deprivation.
A subgroup analysis comparing first RSV episode in the first 6 months with the first RSV episode at age 6–<24 months showed that children exposed at 6–<24 months of age had comparatively higher rates of subsequent morbidity at 2–<4 years (50.9/1000 child-years; 95% CI, 43.7–59.3), at 4–<6 years (12.8/1000 child-years; 95% CI, 9.1–18.1), and at age ≥6 years (7.0/1000 child-years; 95% CI, 4.8–10.2) (Supplementary Table 1).
Sensitivity Analyses
When the outcome was restricted to asthma or wheezing only (which accounted for 75% of the overall outcome), the risk factors were similar compared with the primary analysis (Supplementary Table 2). Of note was a reduced magnitude in the adjusted HR of being born severely preterm, but a higher magnitude of male sex and low socioeconomic index.
Secondary Analysis
A secondary analysis conducted on the subgroup that underwent testing for RSV but were negative showed mixed results (Table 4). While some factors were of a similar magnitude in their risk of subsequent morbidity (eg, maternal history of asthma), other factors differed. Children who were RSV-negative at 12–<24 months had a higher risk of hospitalization due to later asthma or wheeze (aHR, 1.6; 95% CI, 1.3–1.9) than our primary analysis of early-life RSV-confirmed episodes (Table 4). However, children born extremely preterm who were RSV-negative in their first 2 years of life had a lower magnitude of subsequent respiratory morbidity risk (<28 weeks: aHR, 1.8; 95% CI, 1.4–2.4) (Table 4) than those in the primary analysis who had an RSV-confirmed episode in the first 2 years of life.
Adjusted Hazard Ratios of Risk Factors for Later Respiratory Morbiditya in Children Testing Negative for RSV in the First Two Years of Life (n = 10 408)
| Hazard Ratio (95% CI) | ||
|---|---|---|
| Variables | Unadjusted | Adjusted |
| Age at first RSV test | ||
| <3 mo | Ref | Ref |
| 3–<6 mo | 1.21 (0.97–1.50) | 1.22 (0.98–1.52) |
| 6–<12 mo | 1.19 (0.98–1.45) | 1.27 (1.04–1.55) |
| 12–<24 mo | 1.41 (1.17–1.67) | 1.55 (1.29–1.88) |
| Indigenous status | ||
| Non-Indigenous | 0.91 (0.73–1.13) | 0.88 (0.68–1.13) |
| Indigenous | Ref | Ref |
| Mode of delivery | ||
| Cesarean | 1.12 (0.97–1.29) | 1.08 (0.93–1.25) |
| Vaginal/instrumental | Ref | Ref |
| Gender | ||
| Female | Ref | Ref |
| Male | 1.38 (1.12–1.59) | 1.38 (1.19–1.59) |
| Maternal age at child's birth | ||
| <20 y | 0.98 (0.72–1.32) | 0.93 (0.67–1.29) |
| 20–24 y | 1.05 (0.86–1.29) | 1.02 (0.83–1.26) |
| 25–29 y | Ref | Ref |
| 30–34 y | 1.02 (0.85–1.23) | 1.06 (0.88–1.28) |
| ≥35 y | 0.92 (0.74–1.14) | 0.96 (0.76–1.20) |
| Smoking during pregnancy | ||
| No | Ref | Ref |
| Yes | 1.06 (0.90–1.25) | 1.01 (0.84–1.21) |
| Gestational age | ||
| <28 wk | 1.50 (1.10–2.04) | 1.79 (1.29–2.49) |
| 29–32 wk | 1.43 (1.07–1.90) | 1.59 (1.16–2.18) |
| 33–36 wk | 1.13 (0.91–1.41) | 1.20 (0.96–1.52) |
| ≥37 wk | Ref | Ref |
| SEIFA | ||
| 0%–10% (most disadvantaged) | 1.43 (0.98–2.09) | 1.51 (1.02–2.25) |
| 11%–25% | 1.72 (1.21–2.44) | 1.76 (1.22–2.53) |
| 26%–75% | 1.62 (1.16–2.24) | 1.64 (1.17–2.29) |
| 76%–90% | 1.21 (0.83–1.76) | 1.20 (0.82–1.74) |
| 91%–100% (least disadvantaged) | Ref | Ref |
| Maternal history of asthma | ||
| No | Ref | Ref |
| Yes | 1.38 (1.15–1.66) | 1.34 (1.11–1.61) |
| Season of birth | ||
| Spring | Ref | Ref |
| Summer | 1.14 (0.93–1.39) | 1.13 (0.93–1.39) |
| Autumn | 1.06 (0.87–1.29) | 1.05 (0.86–1.28) |
| Winter | 1.07 (0.87–1.30) | 1.07 (0.87–1.31) |
| Remoteness | ||
| Major city | 1.11 (0.67–1.82) | 1.29 (0.77–1.17) |
| Inner regional | 0.93 (0.54–1.82) | 1.03 (0.58–1.81) |
| Outer regional | 0.86 (0.49–1.51) | 0.91 (0.51–1.62) |
| Remote | 1.12 (0.77–1.63) | 1.00 (0.53–1.88) |
| Very remote | Ref | Ref |
| Percent optimal birth weight | 1.00 (0.99–1.00) | 1.00 (0.99–1.00) |
| No. of older siblings | ||
| 0 | 1.00 (0.84–1.19) | 0.99 (0.82–1.19) |
| 1 | 1.05 (0.89–1.24) | 1.08 (0.91–1.27) |
| ≥2 siblings | Ref | Ref |
| Multiple birth | ||
| Singleton birth | Ref | Ref |
| Multiple birth | 1.06 (0.81–1.40) | 0.86 (0.63–1.17) |
| Birth yearb | 1.02 (1.00–1.04) | 1.01 (0.99–1.04) |
Models were adjusted for maternal age at birth, maternal smoking status, maternal history of asthma, parity, socioeconomic status, remoteness index, delivery mode, season of birth, child Aboriginal status, gestational age at birth, birth year, number of siblings, and age at RSV test.
Abbreviations: ED, emergency department; RSV, respiratory syncytial virus; SEIFA, socioeconomic index for areas [21].
Respiratory morbidity episode defined as hospitalization or ED presentation for asthma, wheezing, or unspecified acute lower respiratory infection.
Included as a continuous variable.
DISCUSSION
This population-based analysis aimed to identify sociodemographic and perinatal risk factors that may contribute to a better understanding of the burden of later respiratory morbidity following early-life RSV infection. The incidence of the first episode of later respiratory morbidity was highest for children aged 2–4 years and decreased with increasing age at outcome. Gestational age at birth was identified as the risk factor of the largest magnitude, with those born at <28 weeks of gestation having an increased risk of later respiratory morbidity following early RSV exposure. The risk of subsequent respiratory morbidity was also influenced by the age at first RSV episode, with a higher risk for children who experienced their first RSV episode after the age of 6 months as compared with infants with their first RSV episode in the first 6 months of life, possibly due to residual levels of maternal antibodies to RSV infection in younger infants. The rate of decay of maternal antibody prevalence was estimated in a study to be relatively rapid, with a mean duration of 4.7 months [25]. In addition to waning antibody levels, a recent analysis of the INSPIRE cohort showed that RSV infection during infancy had long-term effects on immune memory [26]. Peripheral blood mononuclear cells from healthy term children infected with RSV during infancy had lower memory T-cell responses at ages 2–3 years to in vitro stimulation with RSV for type 1 and type 17 markers for a number of memory T-cell subsets. This suggests that RSV infection in infancy attenuates later antiviral type 1 and type 17 memory responses and antiviral immunity. This may explain in part the enhanced susceptibility to respiratory viral infection and virus-triggered asthma exacerbations. The role of early RSV exposure and its contribution to chronic airway diseases by impairing regulatory T-cell function has been the subject of numerous in vitro and animal studies seeking evidence for potential mechanisms. Other risk factors for later respiratory morbidity included low socioeconomic status and a maternal history of asthma. Our sensitivity analysis of the RSV-negative subgroup showed a persistent association with gestational age, highlighting the importance of severe prematurity in the trajectory of RSV infection to later respiratory morbidity.
Our study results point to host susceptibility factors, whether these be lung immaturity (preterm birth status) [27], immunological immaturity (naïve immune status once maternal antibodies have waned) [28], or genetic susceptibility (familial history of asthma), as markers of “future respiratory disease susceptibility.” Our findings provide further evidence of the association between RSV-ALRI and the development of wheezing illnesses. Our study design and analytical approach show that there are factors such as maternal history of asthma that are also associated with later respiratory morbidity regardless of RSV status in early life and provide evidence that children who are more likely to seek medical care for asthma, wheezing, and ALRI are already susceptible and at risk for poor respiratory outcomes. These vulnerabilities may interact with RSV to increase the risk of developing a “wheezy phenotype,” as has been shown in another cohort study from the United States, which indicated that having RSV or rhinovirus wheezing illness at 2–3 years of age in a high-risk cohort was associated with an increased asthma risk at 6 years as compared with having infections during infancy [29]. Our results are supported by a recent study by Rosas-Salazar et al. [6] but in contrast to a recent study by Munoz-Quiles et al. [7], which reported a higher risk of recurrent wheeze/asthma in children hospitalized with non-RSV bronchiolitis compared with RSV-positive children. However, these analyses included a different case definition than ours as well as the addition of primary care data. These differences may account for the difference in the magnitude of risk of respiratory morbidity after the age of 2 years. Nevertheless, both our analysis and that of Munoz-Quiles et al. show similar findings in that children who require hospitalization for bronchiolitis after 6 months of age have underlying predispositions that increase their susceptibility to developing asthma later in life. Regardless of etiology, these results support the susceptibility hypothesis in these children. All studies also show an age-dependent association between RSV exposure and outcome.
Additionally, our study confirms that timing of exposure to RSV in the first 2 years is still important for the development of later respiratory morbidity. Early RSV exposure in the first 6 months of life resulted in a relatively lower incidence of later respiratory morbidity compared with RSV exposure after 6 months of age. This is consistent with other studies that have examined the association of age at first RSV exposure with subsequent risk of severe asthma [30–32], particularly in the latter study on children of preschool age. The attenuation of this association over time is also consistent with other findings [5, 20, 29, 33]. This indicates that prophylaxis against RSV, including long-acting single-dose monoclonal antibodies that are close to market [10, 34, 35], may contribute to long-term benefits for chronic respiratory disease. The magnitude of risk of later secondary morbidity was lower for the RSV-negative children at age 6–<12 months but higher at age 12–<24 months compared with the risk in RSV-positive children, suggesting that although timing of RSV exposure in the first 2 years is important, there are likely other pathogens (causing the need for hospitalization and need for respiratory viral testing) that are also important in the relationship between early-life lower respiratory infection and subsequent respiratory morbidity risk [36, 37]. The difference in risk suggests that in addition to young infants and children born extremely or moderately preterm, young children between 6 and 24 months should also be considered potential target groups for RSV prevention to reduce the burden of later respiratory morbidity associated with RSV. While young infants may benefit from passive immunization conferred by maternal vaccines, infants in older age groups could benefit from administration of a monoclonal antibody. The Centers for Disease Control and Prevention's Advisory Committee on Immunization Practices (ACIP) recently recommended that nirsevimab be offered to all infants born during fall/winter (Oct–Mar) shortly after birth and to infants born outside of this time period during scheduled child health visits [38]. ACIP also recommended that 1 dose of nirsevimab be offered to children <20 months of age entering their second RSV season who are eligible for palivizumab in their second RSV season. Our results would support a recommendation to offer nirsevimab for children approaching their second RSV season (therefore over the age of 6 months).
Our study has many strengths, including utilizing a cohort that spanned a decade of RSV seasons and state-wide hospitalization and ED presentation data. Laboratory testing data included all testing results from primary care as well as secondary care. Unlike other studies, this study used a laboratory-confirmed RSV infection to define the cohort. Data linkage capacity within WA has allowed us to obtain information on key sociodemographic and perinatal risk factors in this cohort. Additionally, through the analysis of RSV testing data, we were able to conduct sensitivity analyses using RSV-negatives to determine whether sociodemographic and perinatal factors contributing to later respiratory morbidity risk are pertinent to a confirmed RSV infection or another respiratory infection requiring medical attention. It is through this analysis that we have identified the critical importance of extreme preterm birth in the trajectory of early-life RSV infection to poor later respiratory health, above other sociodemographic factors.
However, some study limitations should be acknowledged. While ICD codes were used to identify the outcomes, coding and viral testing practices may affect the ascertainment of the outcomes studied. Additionally, we know that not all respiratory infection–coded admissions are tested for RSV, so our sample size was limited by those who underwent a test [17]. We also acknowledge differences in sensitivity between IF and PCR testing, with the latter being more sensitive. IF was employed in the earlier years of the study and was replaced by PCR in the later years of the study; hence for the earlier years of our study, we may have missed some children with laboratory-confirmed RSV. Furthermore, as an asthma diagnosis is challenging in the first 3 years of age, the asthma/wheezing-coded morbidity episodes during this time could be due to acute viral wheeze, although this does not refute the findings of a subpopulation of high-risk children [39]. We did not have information on the type of wheeze (ie, early transient, late onset, etc.), which is achievable through prospective data collection [40]. Finally, we also lacked information on breastfeeding.
CONCLUSIONS
Our study indicated that children with laboratory-confirmed RSV in their first 2 years of life had significant risk of developing later asthma and wheezing requiring secondary care, which differed with age of first RSV infection and gestational age. In addition to young infants and children born preterm, children between 6 and 24 months of age should also be considered potential target groups for RSV prevention.
Supplementary Data
Supplementary materials are available at Open Forum Infectious Diseases online. Consisting of data provided by the authors to benefit the reader, the posted materials are not copyedited and are the sole responsibility of the authors, so questions or comments should be addressed to the corresponding author.
Acknowledgments
The authors would like to thank the Linkage and Client Services Teams at Data Services within the Western Australian Department of Health, as well as custodians of the data sets used (Birth and Death Registers, Midwives Notification System, Hospital Morbidity Data Collection, and PathWest Laboratory Medicine Database), for their assistance and support in collating the data.
Author contributions. A.T.G. cleaned the data, contributed to the data analysis, wrote the first draft of the manuscript, and critically reviewed the manuscript for intellectual content. M.S. conducted the data analysis, wrote subsequent drafts of the manuscript, and critically reviewed the manuscript for intellectual content. M.S., P.R., K.G., and A.L. contributed to the design of the study and data analysis and critically reviewed the manuscript for intellectual content. H.C.M. conceptualized and secured funding for the study, contributed to the design of the study and data analysis, and critically reviewed the manuscript for intellectual content. All authors approved the final manuscript as submitted.
Data availability. These linked administrative data are not owned by the authors. Access to the data is approved by data custodians and provided by the WA Data Linkage Branch within the WA Department of Health (https://www.datalinkage-wa.org.au/contact-us/). The use of the data is restricted to named researchers only.
Patient consent. Ethical approval was obtained from the WA Department of Health Human Research Ethics Committee (HREC; RGS2762) and the WA Aboriginal Health Ethics Committee (HREC 437). As the study utilised de-identified linked administrative data, a waiver of informed consent was granted by the WA Department of Health HREC.
Financial support. This work was supported by a Merck Sharp & Dohme (Australia) Pty. Ltd. Investigator Initiated Studies Program awarded to H.C.M., P.R., K.G., and A.L. (IIS 60312). The funding body had no role in the acquisition, analysis, or interpretation of the data. H.C.M. is supported by a Fellowship from Stan Perron Charitable Foundation Australia and the Future Health Research and Innovation Fund through the Western Australian Near-miss Awards program of the Department of Health, Government of Western Australia.
Potential conflicts of interest. H.C.M. has received institutional honoraria for participation in advisory committees sponsored by Merck Sharpe & Dohme (Australia) Pty Ltd, Pfizer, and Sanofi for other work unrelated to this analysis. H.C.M. also receives funding from Sanofi in the form of an externally sponsored collaboration agreement for other work unrelated to this analysis. P.R. has received institutional honoraria from advisory committees sponsored by GSK, Pfizer, Merck, AstraZeneca, and Novavax. P.R. also receives funding from Merck Sharpe & Dohme (Australia) Pty Ltd. and GSK. H.C.M. and M.S. have received travel funding from Seqirus (unrelated to the work presented here). All other authors report no potential conflicts.
References
Author notes
Mohinder Sarna and Amanuel Gebremedhin equal contribution.


Comments