


Abstract
We analyzed the attainment of early pharmacological targets of continuous infusion meropenem and piperacillin/tazobactam and the use and effect of a real-time therapeutic drug monitoring (TDM) program on subsequent dosing and target attainment in patients who are critically ill.
This was a single-center, retrospective study among patients hospitalized in the intensive care unit in a Swiss tertiary care hospital from 2017 to 2020. The primary outcome was target attainment [100% tT ≥ 4xECOFF (Pseudomonas aeruginosa)] of continuous infusion meropenem and piperacillin/tazobactam within 72 hours after initiation of treatment.
A total of 234 patients were included. Median first meropenem (n = 186 of 234) and piperacillin (n = 48 of 234) concentration was 21 mg/L (interquartile range [IQR], 15.6–28.6) and 100.7 mg/L (IQR, 64.0–160.2), respectively. Pharmacological target was attained in 95.7% (95% confidence interval [CI], 91.7–98.1) of patients receiving meropenem and 77.0% (95% CI, 62.7–87.9) treated with piperacillin/tazobactam. In the univariable and multivariable logistic regression, body weight and estimated glomerular filtration rate were negatively associated with target attainment. Subsequently, meropenem dosage was decreased or stopped in 35 of 186 (18.8%) and 89 of 186 (47.9%) patients, respectively, and increased in 2 of 186 (1.1%) patients.
Continuous infusion meropenem and piperacillin/tazobactam yielded excellent and moderate early pharmacological target attainment in critically ill patients, respectively. The TDM was mainly used to decrease meropenem dosage.
Up to 60% of critically ill patients treated with β-lactam antibiotics do not achieve recommended pharmacokinetic and pharmacodynamic (PKPD) targets [1, 2]. They are at risk of over- and underdosing due to extensive pathophysiological changes, such as impaired renal function, augmented renal clearance, hypoalbuminemia, increased cardiac output, and increased volume of distribution [1–7], resulting in increased chances of therapeutic failure and mortality [8, 9]. Piperacillin/tazobactam and meropenem are β-lactam antibiotics commonly used to treat serious infections in the intensive care unit (ICU). It is recommended in critically ill patients that the free drug concentration (fT) of β-lactam antibiotics is maintained above the minimal inhibitory concentration (MIC) of the underlying pathogen during the entire dosing interval (100% fT>MIC) to improve clinical outcome [1, 2, 10–14] and to enhance bacterial killing [15–18]. Current guidelines and experts even propose more ambitious targets (in the range of 100% fT>3–8xMIC), especially in critically ill patients, to optimize clinical and microbiological cure and to prevent the development of drug-resistant bacterial subpopulations [10, 12, 19, 20].
To achieve this goal, prolonged infusion of β-lactam antibiotics should be favored over intermittent bolus application because this mode of administration contributes to improved PKPD and may be associated with decreased mortality in critically ill patients [15, 21–23]. The use of therapeutic drug monitoring (TDM) to optimize β-lactam exposure has been proposed as a potentially useful tool for dose optimization and to decrease therapeutic failure [24–29]. Dose adjustment according to TDM should be performed in the early stage of the disease, a phase in which critically ill patients are very vulnerable and presumably benefit the most from optimal antibiotic dosing.
Until now, only few studies assessed the role of TDM on subsequent dose adjustment and target attainment or clinical outcome in patients treated with continuous infusion β-lactam antibiotics, showing that TDM was more frequently used to decrease the antibiotic dosage [30–32] than to increase it [33].
The aim of this study was to analyze (1) the attainment of early pharmacological targets [100% tT ≥ 4xECOFF (Pseudomonas aeruginosa)] within 72 hours after initiation of treatment with continuous infusion meropenem and piperacillin/tazobactam as well as (2) the use and effect of a real-time TDM program on subsequent dosing and target attainment in critically ill patients.
METHODS
Patient Consent Statement
This project was approved by the Ethics Committee of Northwest and Central Switzerland (EKNZ Project-ID: 2021-00379). In full accordance with the Committee's requirements, subjects who had refused the written hospital's general research consent were excluded from the study.
Study Design and Setting
This single-center, retrospective, cohort study was conducted at the University Hospital Basel, a 750-bed tertiary care hospital in Switzerland. All patients aged ≥18 years old who were hospitalized in the ICU (combined surgical and medical ICU) between October 1, 2017 and December 31, 2020, who received continuous infusion meropenem or piperacillin/tazobactam and underwent at least 1 TDM of meropenem or piperacillin within 72 hours of initiation of continuous infusion therapy were included in the analysis (Supplementary Figure 1). Only the first treatment episode per patient was included in the analysis and was defined as first uninterrupted episode of continuous infusion meropenem or piperacillin/tazobactam during the hospitalization in the ICU. The primary variable of interest was early optimal plasma pharmacological target attainment within 72 hours after initiation of treatment. Data were derived from the electronic hospital information system and the medical records.
Continuous infusion meropenem and piperacillin/tazobactam in the ICU and a real-time TDM program were introduced at the University Hospital Basel in 2017. The selection of antibiotic treatment and the dosage administered was at the discretion of the treating physician in accordance with local guidelines.
Definition of Target Attainment/Outcome
The primary outcome was early optimal plasma pharmacological target attainment [100% tT>4xECOFF (P. aeruginosa)] of continuous infusion meropenem and piperacillin/tazobactam within 72 hours after initiation of treatment, corresponding to 8 mg/L for meropenem and 64 mg/L for piperacillin, respectively. The epidemiological cutoff values (ECOFF) for Pseudomonas aeruginosa (P. aeruginosa) provided by the European Committee on Antimicrobial Susceptibility Testing (EUCAST) (piperacillin, 16 mg/L; meropenem, 2 mg/L) were used to define optimal target concentration representing a “worst-case scenario”. For the primary outcome, the first TDM performed within 72 hours after initiation of continuous infusion meropenem or piperacillin/tazobactam treatment was used. Target concentration definition was similar for the first and second TDM. Secondary outcome measures included (1) the proportion of patients attaining the optimal target concentration considering the calculated unbound concentration of meropenem and piperacillin, (2) the proportion of patients attaining a pharmacological target of 100% tT>1xECOFF (P. aeruginosa) within 72 hours, (3) the effect of real-time TDM on subsequent target attainment, (4) the assessment of patients attaining potentially toxic drug concentrations, (5) the association of laboratory parameters (eg, estimated glomerular filtration rate [eGFR]) and demographic parameters (eg, age) with early pharmacological target attainment, (6) the association of early target attainment with mortality at 30 days after the day of the primary outcome assessment, and (7) the growth of P. aeruginosa in relevant microbiological samples in the time period 14 days before until 7 days after the antibiotic concentration measurement was performed. Pseudomonas aeruginosa susceptibility testing was performed with the VITEK2 system (bioMérieux). The eGFR was calculated by the Chronic Kidney Disease Epidemiology Collaboration study equation.
Antibiotic Dosing and Therapeutic Drug Monitoring
The loading dose of meropenem was 1–2 grams intravenously (IV) over 30 minutes, followed by a continuous infusion of 1–6 grams over 24 hours, and 4.5 grams (IV) administered over 30 minutes, followed by a continuous infusion of 9 grams, 13.5 grams, or 18 grams over 24 hours for piperacillin/tazobactam, respectively. The preparation and administration of the antibiotics as continuous infusion was performed according to an in-house standard operating procedure approved and established by the clinical pharmacy. A dosage of 6 grams of meropenem per day was recommended for patients with infections of the central nervous system, patients with febrile neutropenia, and for infections caused by P. aeruginosa or multidrug-resistant Gram-negative bacteria. A dosage of 18 grams of piperacillin/tazobactam per day was recommended in patients with septic shock, febrile neutropenia, and in infections caused by P. aeruginosa. Therapeutic drug monitoring was recommended for all patients expected to receive antibiotic treatment for at least 48 hours. If the underlying pathogen and the MIC were unknown, the local guidelines defined the target range for meropenem and piperacillin as 100% tT>2–4xEUCAST Breakpoint and a maximum steady-state concentration (Cmax) of ≤16 mg/L for meropenem and ≤100 mg/L for piperacillin, respectively. Dosage adjustments were discussed during daily ward rounds of the treating team, which were joined by an Infectious Diseases specialist or pharmacist. Therapeutic drug monitoring was routinely available from Monday to Friday and on request on Saturday and Sunday. The results were provided the same day if samples were sent to the laboratory by 11 Am. Otherwise, the results were available the next day, usually within 24 hours. The effect of the first TDM on dosage adjustment was assessed by analyzing drug dosage 60 hours after blood sample collection for the first TDM, considering turnaround time and time to response of the treating physicians.
Excessive Drug Concentrations and Potential Thresholds of Toxicity
We evaluated excessive drug concentrations according to theoretical thresholds (10 × ECOFF of P. aeruginosa, ie, a concentration above which no additional benefit may be expected [34]) and published potential thresholds of toxicity mainly based on Ctrough concentration (meropenem) and Csteady state concentration (piperacillin). Accordingly, thresholds of 20 mg/L (10× ECOFF of P. aeruginosa) and 44.5 mg/L [35] for total meropenem concentration, and thresholds of 100 mg/L [31] and 160 mg/L (10 × ECOFF of P. aeruginosa and according to Quinton et al [36]) for total piperacillin concentration, were used, respectively.
Measurement of Meropenem and Piperacillin Plasma Concentrations
Blood samples for the quantification of meropenem and piperacillin were collected according to the local recommendations and sent directly on ice to the Department of Laboratory Medicine. The total plasma concentrations of meropenem and piperacillin were determined by high-performance liquid chromatography-tandem mass spectrometry using 2 previously published methods [37, 38]. The concentration of tazobactam was not determined. For secondary analyses, we assumed a protein binding of 2% for meropenem and 30% for piperacillin according to published data [17, 39].
Data Sources
Demographic, clinical, microbiological, and laboratory data of included patients were queried from the electronic hospital information system and the medical records.
Statistical Analysis
Continuous variables were summarized using median and interquartile range (IQR), and categorical variables were summarized using counts and frequencies. P values for comparisons were derived from the Mann-Whitney U test for continuous variables and the χ2 test for categorical variables. McNemar's χ2 test was performed for paired samples (in the case of comparison between first and second TDM). The 95% confidence intervals (CIs) for proportions were calculated according to the exact binominal method. To identify factors associated with the primary outcome in the meropenem population, we fitted univariable and multivariable logistic regression models. Variable selections were specified a priori according to pre-existing findings from the literature, and clinical plausibility and model fit were assessed using Akaike information criterion (AIC). Underlying assumptions of logistic regression were verified. Results are presented as odds ratios (ORs) and 95% CIs, and missing data were excluded (complete case analysis). All statistical analyses were performed using Stata, version 15.0 (StataCorp, College Station, TX).
RESULTS
Patient Characteristics
Two hundred thirty-four patients were included in the study (Supplementary Figure 1): 186 patients received meropenem, and 48 patients received piperacillin/tazobactam (Table 1). The median age was 66 years (IQR, 55–74) and 61 of 234 (26.1%) were female. The majority of patients received 3 grams (n = 89 of 186; 47.8%) and 6 grams (n = 54 of 186; 29.0%) of meropenem and 13.5 grams (n = 29 of 48; 60.4%) and 9 grams (n = 12 of 48; 25.0%) of piperacillin/tazobactam IV per day (Table 1). A GFR estimation preceding the measurement of the primary outcome concentration by 24–48 hours was available in 222 of 234 subjects (95%). Analyzing the subjects who were not receiving continuous renal replacement therapy, 17 of 139 (12%) in the meropenem group and 7 of 36 (20%) in the piperacillin/tazobactam group had decrease of eGFR of ≥25% in that time period.
Patient Characteristicsa
| Total | MER | PTZ | ||
|---|---|---|---|---|
| Characteristic | n = 234 | n = 186 | n = 48 | P Value |
| Sex (female) | 61 (26.1%) | 50 (26.9%) | 11 (22.9%) | .58 |
| Age (years) | 66 (55–74) | 66 (56–74) | 67 (52–74) | .94 |
| Weight | 80 (68–90) | 80 (68–90) | 80 (75–95) | .22 |
| Height | 172 (166–180) | 172 (166–180) | 173 (167–180) | .76 |
| BMI (kg/m2) | 26 (23–30) | 26 (23–30) | 27 (24–31) | .11 |
| ICU admission type | .17 | |||
| Medical | 133 (56.8%) | 103 (55.4%) | 30 (62.5%) | |
| Surgical | 75 (32.1%) | 64 (34.4%) | 11 (22.9%) | |
| Missing | 26 (11.1%) | 19 (10.2%) | 7 (14.6%) | |
| Length of stay, total (days) | 26 (16–42) | 28 (16–42) | 24 (16–40) | .72 |
| Length of stay, ICU (days) | 14 (6–22) | 14 (6–22) | 11 (4–19) | .087 |
| Time on ICU before measurement of drug concentration (days) | 4 (2–9) | 4 (2–9) | 3 (2–7) | .26 |
| Total duration of antibiotic treatment episode (days) | 4 (2–6) | 4 (2–6) | 4 (2–6) | .80 |
| Charlson comorbidity score | 2 (1–5) | 2 (1–5) | 3 (1–5) | .51 |
| Mechanical ventilation | 138 (59.0%) | 109 (58.6%) | 29 (60.4%) | .82 |
| ECMO | 16 (6.8%) | 12 (6.5%) | 4 (8.3%) | .65 |
| CRRT | 47 (20.1%) | 36 (19.4%) | 11 (22.9%) | .58 |
| Vasopressor therapy | 49 (20.9%) | 48 (25.8%) | 1 (2.1%) | <.001 |
| In-hospital mortality | 91 (38.9%) | 75 (40.3%) | 16 (33.3%) | .38 |
| 30-day mortality | 90 (38.5%) | 74 (39.8%) | 16 (33.3%) | .41 |
| Time on defined antibiotic until concentration measurement (h) | 24 (16–42) | 22 (15–42) | 34 (20–48) | .027 |
| Creatinine (µmol/L) | 106 (66–192) | 103 (65–186) | 141 (76–212) | .15 |
| eGFR (mL/min/1.73 m2) | 61 (29–92) | 63 (31–95) | 48 (24–81) | .21 |
| C-reactive protein (mg/L) | 192 (102–301) | 192 (105–301) | 197 (87–293) | .76 |
| Hemoglobin (g/L) | 87 (81–100) | 87 (81–100) | 86 (79–103) | .49 |
| Leucocyte count (×109/L) | 11.8 (8.5–17.0) | 12.2 (8.5–17.6) | 11.0 (8.2–15.5) | .31 |
| Albumin (g/L) | 20 (17–23) | 20 (17–23) | 20 (18–23) | .70 |
| Total protein (g/L) | 56 (50–61) | 55 (50–61) | 57 (53–62) | .26 |
| Total Daily Dosage (g/day) | <.001 | |||
| 1 | 9 (3.8%) | 9 (4.8%) | … | |
| 2 | 28 (12.0%) | 28 (15.1%) | … | |
| 3 | 89 (38.0%) | 89 (47.8%) | … | |
| 4 | 6 (2.6%) | 6 (3.2%) | … | |
| 6 | 54 (23.1%) | 54 (29.0%) | … | |
| 9 | 12 (5.1%) | … | 12 (25.0%) | |
| 13.5 | 29 (12.4%) | … | 29 (60.4%) | |
| 18 | 7 (3.0%) | … | 7 (14.6%) |
Abbreviations: BMI, body mass index; CRRT, continuous renal replacement therapy; ECMO, extracorporeal membrane oxygenation; eGFR, estimated glomerular filtration rate; ICU, intensive care unit; MER, meropenem; PTZ, piperacillin/tazobactam.
Data are presented as count (percentages) or median (interquartile range).
Early Target Attainment [100% tT > 4xECOFF (Pseudomonasaeruginosa)] After Initiation of Antibiotic Treatment
Median time to first meropenem and piperacillin drug concentration measurement after initiation of antibiotic treatment was 22 hours (IQR, 15–42) and 34 hours (IQR, 20–48) and the median first drug concentration was 21 mg/L (IQR, 15.6–28.6) and 100.7 mg/L (IQR, 64.0–160.2), respectively (Table 1). The primary endpoint, the pharmacological target of 100% tT > 4xECOFF (P. aeruginosa) within 72 hours, was achieved in 178 of 186 (95.7%; 95% CI, 91.7–98.1) patients treated with meropenem and in 37 of 48 (77.0%; 95% CI, 62.7–87.9) patients treated with piperacillin/tazobactam (Figure 1). The secondary endpoint of 100% tT>1xECOFF (P. aeruginosa) within 72 hours was achieved in 186 of 186 (100%; 95% CI, 98.0–100) and 47 of 48 (97.9%; 95% CI, 88.9–99.9) patients treated with meropenem and piperacillin/tazobactam, respectively.
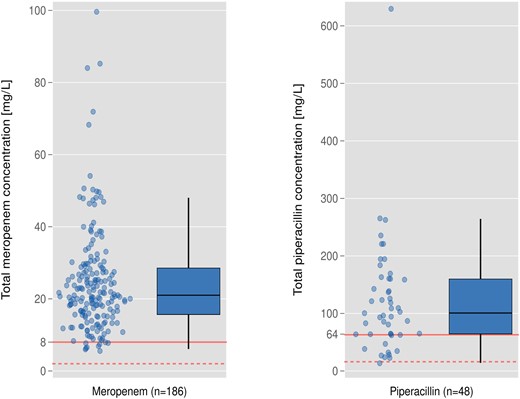
Primary outcome measure: pharmacological target attainment in patients treated with meropenem (95.7%) and piperacillin/tazobactam (77.0%). Red solid reference line, target concentration, ie, 4xECOFF of Pseudomonas aeruginosa (meropenem, 8 mg/L; piperacillin, 64 mg/L). Red dashed reference line, target concentration, ie, 1xECOFF of P. aeruginosa (meropenem, 2 mg/L; piperacillin, 16 mg/L).
Patients who did not attain the pharmacological target concentration of meropenem (<8 mg/L) tended to be younger and to have a higher body weight and fewer comorbidities (P > .05). Furthermore, they had a higher eGFR (99 mL/min/1.73 m2 [IQR, 79–113] versus 61 [IQR, 30–92], P = .008) and a higher total protein concentration in plasma (59 g/L [IQR, 58–66] versus 55 g/L [IQR, 50–61], P = .021) (Table 2). Results were similar in patients treated with piperacillin/tazobactam. Additional factors associated with target nonattainment (<64 mg/L) in this group included a higher body mass index. Requirement of renal replacement therapy, vasopressors, or mechanical ventilation and serum albumin concentration were not associated with target nonattainment in both groups (Table 2). In the multivariable logistic regression model, body weight and eGFR were factors negatively associated with achievement of the target concentration for meropenem (Table 3).
Patient Characteristics Grouped by Attainment Status of the Pharmacological Target Concentration of 100% tT>4xECOFF (Pseudomonas aeruginosa) Within the First 72 Hours of Treatment With Continuous Infusion Meropenem and Piperacillin/Tazobactama
| Meropenem | Piperacillin/Tazobactam | |||||
|---|---|---|---|---|---|---|
| Below Target | Above Target | P Value | Below Target | Above Target | P Value | |
| Characteristic | n = 8 | n = 178 | n = 11 | n = 37 | ||
| Sex (female) | 3 (37.5%) | 47 (26.4%) | .49 | 3 (27%) | 8 (22%) | .70 |
| Age (years) | 59 (48–64) | 66 (56–74) | .052 | 46 (29–55) | 68 (63–76) | <.001 |
| Weight | 88 (76–111) | 80 (68–90) | .12 | 117 (80–154) | 80 (74–86) | .004 |
| BMI (kg/m2) | 27 (25–37) | 26 (23–30) | .17 | 35 (29–49) | 26 (24–29) | .012 |
| ICU Admission Type | .30 | .23 | ||||
| Medical | 3 (37.5%) | 100 (56.2%) | 8 (73%) | 22 (59%) | ||
| Surgical | 4 (50.0%) | 60 (33.7%) | 1 (9%) | 10 (27%) | ||
| Missing | 1 (12.5%) | 18 (10.1%) | 2 (18%) | 5 (14%) | ||
| Time on ICU before measurement of drug concentration (days) | 3 (2–5) | 4 (2–10) | .48 | 3 (1–7) | 3 (2–6) | .38 |
| Charlson comorbidity score | 0 (0–5) | 2 (1–5) | .11 | 1 (0–4) | 3 (2–5) | .067 |
| Mechanical ventilation | 4 (50.0%) | 105 (59.0%) | .61 | 7 (64%) | 22 (59%) | .80 |
| ECMO | 0 (0.0%) | 12 (6.7%) | .45 | 1 (9%) | 3 (8%) | .92 |
| CRRT | 0 (0.0%) | 36 (20.2%) | .16 | 1 (9%) | 10 (27%) | .21 |
| Vasopressor therapy | 1 (12.5%) | 47 (26.4%) | .38 | 0 (0%) | 1 (3%) | .58 |
| Time on defined antibiotic until concentration measurement (hours) | 27 (16–39) | 21 (15–42) | .92 | 27 (17–66) | 35 (21–46) | .85 |
| Creatinine (µmol/L) | 66 (49–90) | 105 (66–189) | .021 | 70 (52–111) | 167 (89–225) | .001 |
| eGFR (mL/min/1.73 m2) | 99 (79–113) | 61 (30–92) | .008 | 103 (65–133) | 35 (23–65) | <.001 |
| C-reactive protein (mg/L) | 139 (75–265) | 193 (108–301) | .51 | 119 (22–213) | 211 (97–324) | .030 |
| Hemoglobin (g/L) | 100 (87–113) | 86 (81–98) | .13 | 103 (90–128) | 84 (78–95) | .011 |
| Leucocyte count (×109/L) | 9.5 (6.4–14.9) | 12.2 (8.6–18.1) | .33 | 11.2 (8.5–14.3) | 10.7 (7.6–15.6) | .99 |
| Albumin (g/L) | 19 (17–21) | 20 (18–23) | .36 | 20 (18–27) | 20 (17–22) | .53 |
| Total protein (g/L) | 59 (58–66) | 55 (50–61) | .021 | 63 (58–72) | 55 (52–58) | .001 |
| Total Daily Dosage (g/day) | .89 | .24 | ||||
| 1 | 0 (0.0%) | 9 (5.1%) | … | … | ||
| 2 | 1 (12.5%) | 27 (15.2%) | … | … | ||
| 3 | 5 (62.5%) | 84 (47.2%) | … | … | ||
| 4 | 0 (0.0%) | 6 (3.4%) | … | … | ||
| 6 | 2 (25.0%) | 52 (29.2%) | … | … | ||
| 9 | … | … | 1 (9%) | 11 (30%) | ||
| 13.5 | … | … | 9 (82%) | 20 (54%) | ||
| 18 | … | … | 1 (9%) | 6 (16%) | ||
Abbreviations: BMI, body mass index; CRRT, continuous renal replacement therapy; ECMO, extracorporeal membrane oxygenation; eGFR, estimated glomerular filtration rate; ICU, intensive care unit.
Data are presented as count (percentages) or median (interquartile range).
Univariable and Multivariable Logistic Regression for Early Target Attainment [100% tT>4xECOFF (Pseudomonas aeruginosa) Within 72 hours] of Meropenem
| Unadjusted | Adjusted | |||
|---|---|---|---|---|
| Variable | OR (95% CI) | P Value | OR (95% CI) | P Value |
| Female gender | 0.60 (0.14–2.59) | .493 | 0.91 (0.15–5.42) | .919 |
| Age, per year | 1.04 (0.99–1.08) | .110 | 0.99 (0.93–1.07) | .983 |
| Weight, per kg | 0.97 (0.94–1.00) | .090 | 0.96 (0.92–0.99) | .024 |
| eGFR, per mL/min/1.73 m2 | 0.97 (0.95–0.99) | .015 | 0.97 (0.94–0.99) | .035 |
| Albumin, per g/L | 1.06 (0.90–1.26) | .472 | 1.11 (0.92–1.35) | .278 |
| Total protein, per g/L | 0.91 (0.83–0.99) | .040 | 0.91 (0.82–1.02) | .104 |
Abbreviations: CI, confidence interval; eGFR, estimated glomerular filtration rate; OR, odds ratio.
Excessive Drug Concentrations and Potential Thresholds of Toxicity
In patients receiving meropenem, 18 of 186 (9.8%) and 103 of 186 (55.4%) had their first drug concentration measured above 44.5 mg/L and 20 mg/L, respectively. In the piperacillin/tazobactam group, 12 of 48 (25%) and 25 of 48 (52.1%) patients had concentrations above the thresholds of >160 mg/L and >100 mg/L, respectively. Patients with meropenem concentrations >44.5 mg/L had a considerably impaired renal function (eGFR: 31 mL/min/1.73 m2 [IQR, 22–69] versus 64 mL/min/1.73 m2 [IQR, 34–95], P = .004) (Table 4). Seven of 18 (39%) with concentrations >44.5 mg/L received a higher meropenem dosage than would have been recommended based on their eGFR at the time point of TDM.
Characteristics of Patients Treated With Continuous Infusion Meropenem According to Target Nonattainment (<8 mg/L) and Potentially Toxic Drug Concentrations (>44.5 mg/L) at First TDMa
| Meropenem Concentration at First TDM | ||||
|---|---|---|---|---|
| <8 mg/L | 8–44.5 mg/L | >44.5 mg/L | P Value | |
| Characteristic | n = 8 | n = 160 | n = 18 | |
| Sex (female) | 3 (37.5%) | 40 (25.0%) | 7 (38.9%) | .36 |
| Age (years) | 59 (48–64) | 66 (55–74) | 70 (62–75) | .068 |
| Weight | 88 (76–111) | 80 (68–90) | 71 (52–85) | .092 |
| Height | 175 (168–180) | 172 (168–180) | 165 (157–176) | .19 |
| BMI (kg/m2) | 27 (25–37) | 26 (23–30) | 24 (23–27) | .19 |
| ICU Admission Type | .57 | |||
| Medical | 3 (37.5%) | 91 (56.9%) | 9 (50.0%) | |
| Surgical | 4 (50.0%) | 55 (34.4%) | 5 (27.8%) | |
| Missing | 1 (12.5%) | 14 (8.8%) | 4 (22.2%) | |
| Time on ICU before measurement of drug concentration (days) | 3 (2–5) | 4 (2–10) | 3 (1–9) | .50 |
| Charlson comorbidity score | 0 (0–5) | 2 (1–5) | 3 (2–5) | .16 |
| Mechanical ventilation | 4 (50.0%) | 94 (58.8%) | 11 (61.1%) | .86 |
| ECMO | 0 (0.0%) | 11 (6.9%) | 1 (5.6%) | .73 |
| CRRT | 0 (0.0%) | 33 (20.6%) | 3 (16.7%) | .34 |
| Vasopressor therapy | 1 (12.5%) | 38 (23.8%) | 9 (50.0%) | .037 |
| Time on meropenem until concentration measurement (hours) | 27 (16–39) | 23 (15–42) | 20 (14–37) | .60 |
| Creatinine (µmol/L) | 66 (49–90) | 104 (66–178) | 185 (89–242) | .020 |
| eGFR (mL/min/1.73 m2) | 99 (79–113) | 64 (32–92) | 31 (22–69) | .004 |
| C-reactive protein (mg/L) | 139 (75–265) | 193 (102–298) | 187 (140–353) | .42 |
| Hemoglobin (g/L) | 100 (87–113) | 87 (81–98) | 85 (81–100) | .31 |
| Leucocyte count (×109/L) | 9.5 (6.4–14.9) | 12.6 (8.8–18.5) | 10.9 (7.8–14.5) | .27 |
| Albumin (g/L) | 19 (17–21) | 20 (18–23) | 21 (19–22) | .66 |
| Total protein (g/L) | 59 (58–66) | 55 (50–61) | 53 (48–60) | .041 |
| Total Daily Dosage (g/day) | .53 | |||
| 1 | 0 (0.0%) | 9 (5.6%) | 0 (0.0%) | |
| 2 | 1 (12.5%) | 25 (15.6%) | 2 (11.1%) | |
| 3 | 5 (62.5%) | 77 (48.1%) | 7 (38.9%) | |
| 4 | 0 (0.0%) | 4 (2.5%) | 2 (11.1%) | |
| 6 | 2 (25.0%) | 45 (28.1%) | 7 (38.9%) | |
Abbreviations: BMI, body mass index; CRRT, continuous renal replacement therapy; ECMO, extracorporeal membrane oxygenation; eGFR, estimated glomerular filtration rate; ICU, intensive care unit; TDM, therapeutic drug monitoring.
Data are presented as count (percentages) or median (interquartile range).
Real-Time Therapeutic Drug Monitoring Dose Adjustment and Subsequent Target Attainment
At 60 hours after the first TDM, meropenem dosage was not changed in 60 of 186 (32.3%), decreased in 35 of 186 (18.8%), and increased in 2 of 186 (1.2%) patients, respectively. In 89 of 186 patients (47.9%), meropenem treatment was stopped (eg, stop of empirical treatment) or changed to another antibiotic (eg, streamlining to narrow-spectrum antibiotic). Eighty-four of 186 (45.2%) patients receiving meropenem had ≥2 drug concentrations available during the same treatment episode. The median time interval between the first and second drug concentration measurement was 47.8 hours (IQR, 23.8–71.2). In patients with a second TDM available, total daily dosage of meropenem was decreased in 31 of 84 (36.9%) and not changed in 52 of 84 (61.9%) patients at the second TDM (Supplementary Table 1). In the 31 patients in whom meropenem dosage was decreased, the number of patients receiving >3 grams of meropenem per day decreased from 16 patients (51.6%) on first TDM to 5 patients (16.1%) on second TDM (Supplementary Table 1). The meropenem dosage was increased in only 1 patient (1 of 84, 1.1%). In the 84 subjects with a second meropenem concentration available, 82 of 84 (97.6%) had the first and 81 of 84 (96.4%) the second measurement above the target of 8 mg/L (P = .65).
When taking possible toxicity into account and defining a range of 8–44.5 mg/L for optimal meropenem concentration, 72 of 84 (85.7%) and 77 of 84 (94.0%) patients achieved this target range at the first and second TDM, respectively (Figure 2A). When a threshold of 20 mg/L (10 × ECOFF of P. aeruginosa) was used, the number of patients achieving this pharmacological target decreased to 32 of 84 (38.1%) on first TDM and 48 of 84 (57.1%) on second TDM (Figure 2B). In the group of subjects with a decrease in meropenem dosage between first and second TDM, improvement in target attainment at second TDM (ie, 8–20 mg/L) was observed in 18 of 31 (58.1%) patients.
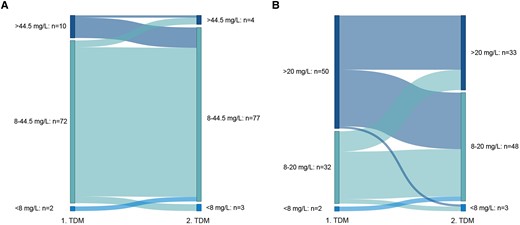
Sankey plots of pharmacological target attainment of meropenem between the first and second therapeutic drug monitoring (TDM) when using a target concentration range of 8–44.5 mg/L (A) or 8–20 mg/L (B).
For piperacillin/tazobactam, treatment was continued for at least 60 hours after first TDM in 23 of 48 (47.9%) patients, and 10 of 48 (20.8%) had a second TDM available, which was obtained after a median of 34 hours (IQR, 16.7–48.1) after the first TDM. Overall, dosage was not changed in the majority of patients (n = 18 of 23 [78.3%]) or decreased in 4 of 23 (17.4%) patients. In patients with a second TDM available, drug dosage was not changed in 9 of 10 (90%) patients and increased in only 1 of 10 (10%) patients. Pharmacological target on first TDM was attained in 7 of 10 (70%) and 8 of 10 (80%) on second TDM (P = .31) (Supplementary Figure 2).
Secondary and Clinical Endpoints
When calculating the unbound drug concentrations, target attainment was equal to the total drug concentration in the meropenem group (n = 178 of 186 [95.7%]) and decreased to 58.3% (n = 28 of 48) in the piperacillin/tazobactam group. Thirty-day mortality was 39.8% (n = 74 of 186) and 33.3% (n = 16 of 48) in patients treated with meropenem and piperacillin/tazobactam, respectively (P = .41). There was no statistically significant difference in 30-day mortality between patients attaining or not attaining the primary outcome of 100% tT>4xECOFF (P. aeruginosa) (meropenem, n = 72 of 178 [40.5%] versus n = 2 of 8 [25%]; piperacillin/tazobactam, n = 14 of 37 [37.8%] versus n = 2 of 11 [18.2%]). The median drug concentration of meropenem was significantly higher in patients who died within 30 days compared to those who did not (24.1 mg/L [IQR, 17.7–31.8] versus 20.5 mg/L [IQR, 14.0–26.5]). Mortality rate of patients with meropenem concentration >44.5 mg/L and with piperacillin/tazobactam concentrations >160 mg/L was 55.6% (n = 10 of 18) and 41.7% (n = 5 of 12), respectively.
In the entire study population, the prevalence of P. aeruginosa in at least 1 microbiological sample was 15.8% (n = 37 of 234, 29 in the meropenem and 8 in the piperacillin/tazobactam group), most frequently identified in samples from the respiratory tract. The median meropenem MIC in the meropenem group was 0.25 mg/L (IQR, 0.25–1.0 mg/L), and the median piperacillin MIC in the piperacillin/tazobactam group was 8 mg/L (IQR, 6–8) (Supplementary Figure 3).
DISCUSSION
To the best of our knowledge, this is the largest cohort study analyzing early pharmacological target attainment within 72 hours after initiation of antibiotic treatment with continuous infusion meropenem and the utilization of a real-time TDM program in ICU patients. Early target attainment was excellent in patients receiving meropenem and moderate in patients treated with piperacillin/tazobactam. Body weight and eGFR were independently associated with early target nonattainment. In case of meropenem, target concentration was more frequently attained (96%) than in a previously published, smaller study, demonstrating early target attainment with the same threshold in approximately 75% within 48 hours [40]. Similarly, early target achievement in patients treated with piperacillin/tazobactam was higher compared to published data [30, 31, 40]. The low protein binding of meropenem may facilitate early target attainment, because the variability of unbound drug might be less affected by the altered metabolism of ICU patients compared with β-lactam antibiotics with higher protein binding (eg, piperacillin or flucloxacillin [3]). The analyzed patient group of the present study had a high mortality rate of approximately 40% that even increased to 55.6% in patients with meropenem concentrations >44.5 mg/L. An association between excessive high drug concentrations and increased mortality rate has been described regarding piperacillin/tazobactam [30, 31] and flucloxacillin [3]. However, conclusions about the causality between higher drug concentration and mortality could not be drawn. In contrast, the higher drug concentrations may most likely be a consequence of organ dysfunction, especially impaired renal function, indicating the severity of disease.
In contrast, the 8 patients not attaining the targeted minimum meropenem concentration of 8 mg/L demonstrated a preserved renal function reflected by a significantly higher eGFR. Augmented renal clearance has already been identified as one of the risk factors for pharmacological target nonattainment [5, 41]. Meropenem dosages up to 8 g/day IV have been recommended in these patients to achieve sufficient drug concentrations [42–44]. However, results of meropenem PK modeling vary substantially, leading to dosage recommendations for continuous infusion meropenem ranging from 1 g/day to 6 g/day in patients with normal renal function and from 2 g/day to 8 g/day in case of augmented renal clearance [44].
In the majority of patients of the present study treated with continuous infusion meropenem, a dose reduction was the consequence of TDM. Target attainment on second TDM was similar to first TDM, indicating that dose reduction was safe and did not lead to underdosing. Of note, second TDM was performed mainly within 48 hours after first TDM. Hence, TDM and dosage adjustments were performed within the presumed most vulnerable early phase of the disease. Other studies investigating the effect of TDM in continuous infusion meropenem were limited by their small sample size [32]. In a study including 75 oncohematological patients treated with continuous infusion meropenem, an increase of dosage was necessary in 15.7% of the patients and a decrease was necessary in only 14.4% of the patients [33]. This higher rate of dosage increases compared to the present study may be related to the patient population included. Oncohematological patients are usually younger and have a preserved kidney function.
Currently, the largest studies assessing the impact of real-time TDM on target attainment include a large retrospective cohort study and a multicenter, randomized, controlled trial in ICU patients treated with continuous infusion piperacillin/tazobactam [30, 31]. In both studies, TDM was mainly used to decrease antibiotic dosage in the early course of the disease in approximately 50% of the patients, showing similar rates than we observed in the present study (36.9%). However, if TDM impacts patient mortality or clinical outcome still remains unclear. There are several guidelines and studies encouraging the use of TDM mainly based on observational studies [10, 20, 45, 46]. The first published randomized controlled trial investigating the role of TDM in continuous infusion piperacillin/tazobactam in ICU patients did not show any benefit of daily TDM in regard to the daily mean total Sequential Organ Failure Assessment (SOFA) score up to 10 days of treatment [30]. In the present study, 60 hours after the first TDM, antibiotic treatment was stopped or switched to another antibiotic treatment in 50% of the patients, which highlights the need for early TDM, short turnaround time, and immediate subsequent dose adjustments. Still, it has to be clarified which group of patients might benefit the most from TDM. This is especially important because, in times of high financial and workforce pressures, costs and benefits of diagnostics must be carefully weighed against each other before widespread implementation of β-lactam TDM programs are recommended [47].
In this study, we chose 100% fT>4xMIC as the target for optimal treatment. This is in line with a previously published expert review that recommended the use of 100% fT>4xMIC instead of 100% fT>MIC in critically ill patients to achieve maximal bacterial killing, prevent bacterial regrowth, and improve clinical outcome [19]. Of note, the definition of the optimal target concentration is diverse in the current literature, varying between 100% fT > MIC versus 100% fT>2–4xMIC [31] versus 100% fT>4xMIC [3] or even 100% fT>4–8xMIC [20]. The target concentration for meropenem may therefore range from 0.06 mg/L (100% fT>MIC) if the ECOFF of Escherichia coli is used (one of the most frequently identified pathogens in ICU patients [30, 48]) to 8 mg/L (100% fT>4xMIC) if the ECOFF of P. aeruginosa is used, representing a 14-fold difference in the target concentration. Because the MIC of the underlying pathogen is often unknown, especially in the early stage of the disease, the ECOFF of P. aeruginosa is most frequently used as MIC reflecting a “worst-case scenario”. This approach is controversial. In the present study, it was probably not relevant in up to 85% of the patients and may result in unnecessary high targeted drug concentrations. Local epidemiology and the prevalence of multidrug-resistant bacteria may help to guide the definition of the optimal target concentration. In a low-prevalence setting, as in our hospital, a lower target concentration may be chosen, especially in combination with the very high rate of target attainment even when using the ECOFF of P. aeruginosa.
The strengths of the present study are the large number of patients included in the meropenem group and the availability of second TDM in a considerable part of the patients. Furthermore, this study reflects a real-life setting describing the target attainment after implementation of a real-time β-lactam TDM program at a tertiary hospital.
The limitations of this study include its retrospective design, which possibly results in bias as confounding by indication. The assessment of the primary outcome was based on a single drug measurement, which might not truly reflect the steady-state concentration level in the presence of dynamic renal function in the setting of critical illness. The number of patients treated with piperacillin/tazobactam was small, and the results from this group of patients should be interpreted with caution. Although the total number of patients in the meropenem group was large, it was highly imbalanced against patients not attaining the predefined target concentration, leading to limited scope of comparative analysis and limiting the power for statistical analyses. We could not evaluate toxicity and therefore we were not able to link elevated concentrations to adverse events.
CONCLUSIONS
In the present study, continuous infusion of meropenem and piperacillin/tazobactam resulted in high and moderate rates of pharmacokinetic target attainment for meropenem and piperacillin/tazobactam, respectively. Therapeutic drug monitoring mainly led to a decrease of antibiotic dosages. Randomized controlled trials are needed to address the unanswered questions of optimal target concentration and the impact of TDM on microbiological and clinical outcomes.
Supplementary Data
Supplementary materials are available at Open Forum Infectious Diseases online. Consisting of data provided by the authors to benefit the reader, the posted materials are not copyedited and are the sole responsibility of the authors, so questions or comments should be addressed to the corresponding author.
Acknowledgments
Author contributions. SD, FCF, and MO had full access to all of the data in the study and take responsibility for the integrity of the data and the accuracy of the data analysis. SD, FCF, MO, NDL, and MvR designed the study. FCF and SD collected the data. FCF, SD, MO, NDL, MvR, KMR, and MS analyzed the data. SD, MO, and FCF prepared a first manuscript draft. All authors contributed substantially to the writing of the manuscript and critically revised the manuscript for important intellectual content. All authors read and approved the final manuscript.
Financial support. This work was supported by the Universtitätsspital Basel (“Protected time Support for junior researchers” [to SD]).
References
Author notes
S. D and F. C. F are cocorresponding authors.
M. O. and F. C. F. contributed equally to this work.
Potential conflicts of interest. All authors: No reported conflicts of interest.


Comments