


Abstract
Clostridioides difficile infection (CDI) immune response is influenced by the innate and adaptive (humoral) immune systems. Our prior research found attenuated humoral responses to C difficile in immunocompromised hosts (ICHs) with CDI. We sought to evaluate whether the innate immune response to CDI was influenced by ICH status.
We conducted a prospective study of hospitalized adults with CDI (acute diarrhea, positive C difficile stool nucleic acid amplification testing [NAAT], and decision to treat), with and without immunosuppression and measured a panel of cytokines (granulocyte colony-stimulating factor [G-CSF], interleukin [IL]–10, IL-15, IL-1β, IL-4, IL-6, IL-8, and tumor necrosis factor–α) in blood and stool at CDI diagnosis. Results were compared with measurements from a cohort of asymptomatic carrier patients (ASCs) (NAAT positive, without diarrhea) with and without immunocompromise.
One hundred twenty-three subjects (42 ICHs, 50 non-ICHs, 31 ASCs) were included. Median values for blood and stool cytokines were similar in ICH versus non-ICH CDI subjects. In blood, G-CSF, IL-10, IL-15, IL-6, and IL-8 were higher in both groups of CDI subjects versus the ASC cohort (P < .05). In stool, IL-1β and IL-8 were higher in both groups of CDI subjects versus the ASC cohort (P < .05). Median stool concentrations of IL-1β demonstrated significant differences between the groups (ICHs, 10.97 pg/mL; non-ICHs, 9.71 pg/mL; and ASCs, 0.56 pg/mL) (P < .0001).
In this small exploratory analysis, ICH status did not significantly impact blood and fecal patterns of cytokines in humans at the diagnosis of CDI, suggesting that the innate immune response to C difficile may be conserved in immunocompromised patients.
Clostridioides difficile infection (CDI) is the leading cause of healthcare-associated infectious diarrhea and causes a substantial burden of disease among immunocompromised patients [1]. Host factors modulate the immune response to CDI and affect an individual's risk for primary and recurrent infection [2, 3]. The host immune response to CDI is influenced by both the adaptive (humoral) and the innate immune systems. The innate immune response is a complex system that involves mucosal injury, neutrophil activation, inflammasome activation, and production of inflammatory cytokines and chemokines [4]. Clostridioides difficile toxins direct further “inflammasome priming and activation” leading to an inflammatory response with interleukin [IL]–8 and IL-1β and neutrophil recruitment, which are required for bacterial killing [5].
Prior research from our group evaluated blood markers of inflammation in CDI. This work found elevated markers (IL-6, granulocyte colony-stimulating factor [G-CSF], tumor necrosis factor alpha [TNF-α]) in CDI cohorts (C difficile nucleic amplification test [NAAT] positive with diarrhea) when compared to asymptomatic C difficile carriers (ASCs) (NAAT positive without diarrhea) and NAAT-negative patients (with and without diarrhea) [4]. Additionally, we have shown that stool cytokines, namely IL-1β, IL-6, IL-8, IL-15, and TNF-α, all differed significantly between subjects with CDI and these other cohorts [6]. Among these, stool IL-1β appeared to be the most promising as a candidate biomarker to be used in distinguishing CDI from subjects who do not have CDI [6]. We have also demonstrated that the humoral immune response to CDI may be blunted in patients with immunocompromise, possibly related to defects in adaptive immunity from endogenous and exogenous immunosuppression [7]. Building on this research, we wanted to evaluate whether there were differences in the cytokine response to CDI in immunocompromised hosts (ICHs) when compared to nonimmunocompromised hosts (non-ICHs). In this report, we measured a panel of cytokines in blood and stool from a prospectively enrolled cohort of hospitalized ICHs and non-ICHs with CDI, and compared results with a cohort of ASCs with and without immunosuppression. Our a priori hypothesis was that there may be an attenuation of the host innate immune response in immunocompromised patients with CDI as a consequence of endogenous or exogenous immunosuppression.
METHODS
CDI Patient Cohorts
Inpatients at Beth Israel Deaconess Medical Center (BIDMC, Boston, Massachusetts) and Texas Medical Center (TMC, Houston, Texas) were prospectively enrolled between June 2016 and February 2020. Eligible subjects were ≥18 years old with positive stool C difficile NAAT result, initiating CDI therapy, and had acute diarrhea, as previously defined in our work [7]. Patients were excluded for the following: history of chronic diarrhea without acute exacerbation, presence of colostomy, receipt of bezlotoxumab, enrollment in any C difficile vaccine study, >48 hours of CDI therapy, insufficient stool specimen, or stool sample older than 72 hours. The diagnostic stool specimen was captured, aliquoted, and frozen for research studies. The clinical C difficile testing method at BIDMC was NAAT only (before July 2018) (Xpert C.difficile/Epi; Cepheid, Sunnyvale, California) and NAAT with a reflex enzyme immunoassay (EIA) (ImmunoCard Toxins A&B; Meridian Bioscience, Cincinnati, Ohio) if NAAT positive (after July 2018); TMC used 2 methods (BDMax Cdiff Assay; BD, Franklin Lake, New Jersey) and BioFire FilmArray Gastrointestinal Panel; bioMérieux, Salt Lake City, Utah). Subjects with co-pathogens detected on BioFire were excluded. A discarded blood sample (typically serum, occasionally plasma) from within 1 day of the stool sample was captured, promptly stored at 4°C, aliquoted within 5 days, and frozen at −80°C.
Asymptomatic NAAT Cohort
ASCs are described in our prior work [4]. In brief, these were inpatients ≥18 years old who were admitted for at least 72 hours, had received at least 1 dose of an antibiotic within the past 7 days, and had absence of diarrhea, defined as no report of diarrhea by patient or nurse in the 48 hours prior to enrollment. NAAT (Xpert C difficile/Epi) was performed on all samples, and positive samples were retained for this cohort. Immunocompromise or receipt of immunocompromising medications were not exclusions. Assessment for the absence of diarrhea included detailed chart review, review of nursing input/output logs, or conversations with nurses and patients. Patients with ≥2 loose stools within a 24-hour period were excluded; patients with 1 loose stool were included only if providers had recently administered a laxative. Patients were excluded if they were unable to provide a stool sample; had a colostomy; had received oral or intravenous metronidazole, oral vancomycin, oral rifaximin, and/or oral fidaxomicin for >24 hours within the past 7 days; had been diagnosed with CDI in the past 6 months; or had tested negative for C difficile within the past 7 days.
Patient Consent Statement
For the CDI patient cohort, samples were collective prospectively under written informed consent. For the asymptomatic NAAT cohort, samples were collected prospectively under verbal informed consent. The design of the work was approved by the local ethical committees. At BIDMC this was the Committee on Clinical Investigations and at TMC this was the Institutional Review Board.
Data Collection
CDI in ICH and Non-ICH Cohorts
Clinical outcomes and laboratory findings were gathered through medical record review. Clinical outcomes of the CDI cohort were previously published [7]. Definitions of severe CDI, CDI severity scores (Infectious Diseases Society of America/Society for Healthcare Epidemiology of America [IDSA/SHEA] [8], European Society of Microbiology and Infectious Diseases [9], Zar et al [10], and Belmares et al [11]), and immunocompromised status definitions were in accordance with our prior work [7, 12]. Major categories of immunosuppression are described in the Supplementary Text. Medical records were reviewed for receipt of G-CSF within the 7 days prior to CDI diagnosis. Laboratory characteristics including peak and nadir white blood cell count, absolute neutrophil count and absolute lymphocyte count nadirs, peak creatinine, and albumin nadir were recorded within 5 days preceding and 2 days after stool collection. Temperature ≥38.0°C, systolic blood pressure <100 mm Hg, and peak lactate values were recorded within 24 hours of CDI diagnosis. Written informed consent was obtained before enrollment.
Laboratory Analytes
Blood and Stool Cytokine Measurement
Human blood and stool cytokines (G-CSF, IL-1β, IL-4, IL-6, IL-8, IL-10, IL-15, and TNF-α) were measured (picograms per milliliter) using a Milliplex magnetic bead kit and Luminex analyzer (MAGPIX, Millipore Sigma). Per the instruction manual of MILLIPLEX MAP Human Cytokine/Chemokine Magnetic Bead Panel, all cytokine standards and 2 quality controls for each cytokine were provided by the vendor (control catalog number MHX6060).
Objectives
Our primary objective was to compare the blood and stool cytokine responses in ICHs and non-ICHs with CDI. We also aimed to compare blood and stool cytokine concentrations in ICHs with CDI with the blood and stool cytokine concentrations in ASCs.
Statistical Methods
Statistical analysis and figure generation were done using Stata/BE version 17.0 (StataCorp, College Station, Texas). Descriptive statistics included median and interquartile range for continuous variables and frequency and percentages for categorical variables. Given the nonparametric distribution of our data, we performed Wilcoxon rank-sum test for 2 variable comparisons. We utilized χ2 and Fisher exact test to determine the association between multiple categorical variables and Kruskal-Wallis test to analyze associations between multiple groups of continuous variables. Results were considered statistically significant when P < .05.
For the cytokine data, adjusted significance level for multiple testing (q*) was computed via the Benjamini-Hochberg (BH) and Bonferroni (BF) methods to decrease the rate of false discovery. Markers meeting the BH-adjusted significance threshold for differences across all cohorts underwent pairwise testing. The minimum detectable concentration (minDC) of cytokines plus 2 standard deviations (minDC + 2SD) was obtained from the manufacturer’s protocol file. Cytokine concentrations below minDC + 2SD were imputed as (minDC + 2SD) / (√2).
Due to the receipt of exogenous granulocyte colony-stimulating factor (filgrastim) in some hospitalized patients, we performed a sensitivity analysis to determine the potential impact of filgrastim receipt on stool and blood G-CSF levels. Patients who had received filgrastim were removed from the analysis, and the data for G-CSF in the serum and stool were recomputed.
RESULTS
In our previous analysis of the antibody response to CDI in ICH and non-ICHs, our cohort included 98 subjects with CDI [7]. Of these, there were 6 subjects without cytokine data available for analysis. The cohort described in this report thus included 92 subjects with CDI, including 42 ICHs (45.7%) and 50 non-ICHs (54.3%). Our control subjects included 31 ASCs. Demographic data are presented in Table 1. There were no statistically significant differences in sex, age, race, or ethnicity between the groups.
Comparison of Demographics and Baseline Laboratory Values for Study Cohorts
| Characteristic | ICH CDI (n = 42) | Non-ICH CDI (n = 50) | ASC (n = 31) | P Value |
|---|---|---|---|---|
| Male sex | 21 (50) | 18 (36) | 17 (54.8) | .429 |
| Age, y, median (IQR) | 67 (52–73) | 63 (52–77) | 64 (49–73) | .6727 |
| Race | ||||
| White | 37 (88.1) | 45 (90) | 21 (61.7) | .448 |
| Non-White | 5 (11.9) | 5 (10) | 10 (32.3) | .381 |
| Ethnicity | ||||
| Hispanic | 0 (0) | 3 (6) | 1 (3.2) | 1.00 |
| Not Hispanic | 41 (97.6) | 47 (94) | 30 (96.8) | .451 |
| Not reported | 1 (2.4) | 0 (0) | 0 (0) | |
| Immunocompromising conditions | ||||
| Active hematologic malignancy | 11 (26.2) | … | 2 (6.5) | 1.000 |
| Solid tumor with recent chemotherapy | 7 (16.7) | … | 5 (16.1) | 1.000 |
| HSCT | 2 (4.8) | … | 1 (3.2) | 1.000 |
| SOT | 6 (14.3) | … | … | |
| High-dose steroidsa | 7 (16.7) | … | … | |
| IBDb | 4 (9.5) | 2 (4) | … | 1.000 |
| Autoimmune conditions | 5 (11.9) | … | 2 (6.5) | 1.000 |
| Severe CDI | ||||
| IDSA/SHEA | 21 (50) | 24 (48) | … | .8492 |
| ESCMID | 24 (57.1) | 31 (62) | … | .6379 |
| Zar et al [10] | 12 (28.5) | 17 (34) | … | .5788 |
| Belmares et al [11] | 5 (11.9) | 8 (16) | … | .5764 |
| Laboratory parameters | ||||
| WBC count, K/μL, median (IQR) | 10.1 (3.7–15.3) | 12.5 (8.8–19) | 11 (7.2–15.3) | .1023 |
| WBC count ≥15 K/μL | 11 (26.1) | 18 (36) | 8 (26) | .9374 |
| Creatinine, g/dL, median (IQR) | 1.2 (0.9–1.8) | 0.9 (0.7–1.5) | 1.2 (0.8–1.8) | .1636 |
| Creatinine ≥1.5 g/dL | 16 (38.1) | 14 (28) | 10 (32.3) | .5461 |
| Albumin, mg/dL, median (IQR) | 3.1 (2.8–3.4) | 3 (2.5–3.7) | 3.4 (2.8–3.8) | .3519 |
| Albumin <3 mg/dL | 11 (27.5) | 21 (42) | 4 (25) | .5461 |
| Lactate peak, mmol/L, median (IQR) | 1.8 (1.3–2.1) | 1.5 (1.3–1.8) | NA | .6034 |
| Baseline stool Ct value, median (IQR) | ||||
| Xpert Toxin B Ct (tcdB gene) (n = 122) | 27.5 (23.5–32.2) (n = 41) | 25.45 (22.9–30.5) (n = 50) | 28.5 (26.3–34) (n = 31) | .4835 |
| 027-NAP1-BI | 3 (7.1) | 10 (20) | 1 (3.2) | 1.000 |
| Receipt of filgrastim | 4 (9.5) | 0 (0) | 2 (6.4) | 1.000 |
Data are presented as No. (%) unless otherwise indicated.
Abbreviations: ASC, asymptomatic carrier of Clostridioides difficile; CDI, Clostridioides difficile infection; Ct, cycle threshold; ESCMID, European Society of Clinical Microbiology and Infectious Diseases; HSCT, hematopoietic stem cell transplant; IBD, inflammatory bowel disease; ICH, immunocompromised host; IDSA/SHEA, Infectious Diseases Society of America/Society for Healthcare Epidemiology of America; IQR, interquartile range; non-ICH, nonimmunocompromised host; NA, not applicable; SOT, solid organ transplant; WBC, white blood cell.
Chronic administration of high-dose steroids.
IBD patients in ICH category were on immunosuppressive medications. The 2 subjects with IBD in the non-ICH group were not on immunosuppressive medications.
Of the 42 ICHs, active hematologic malignancy (11/42 [26.2%]), solid organ transplantation (7/42 [14.3%]), and receipt of high-dose steroids alone (7/42 [14.3%]) comprised the largest proportion of immunocompromising conditions. In the ASC group, there were 10 subjects (10/31 [32.3%]) who met criteria for immunocompromise. This included 5 subjects (5/31 [16.1%]) with solid tumors, 2 subjects with autoimmune conditions on immunosuppressants (2/31 [6.5%]), 2 subjects with hematologic malignancies on chemotherapy (2/31 [6.5%]), and 1 subject with acute myelogenous leukemia with stem cell transplant (1/31 [3.2%]). We did not observe any statistically significant differences in CDI severity in ICH and non-ICHs. There were no significant differences in baseline laboratory parameters across the 3 groups.
There were no statistically significant differences in Xpert Toxin B Ct values (tcdB gene) between the ICH, non-ICH, and ASC groups.
Blood Cytokine Results
Measurements for a panel of blood (G-CSF, IL-10, IL-15, IL-1β, IL-4, IL-6, IL-8, TNF-α) analytes in samples from the cohorts (ICH, non-ICH, and ASCs) are presented in Table 2. After adjustment using the BF and BH methods, 5 cytokines (G-CSF, IL-10, IL-15, IL-6, and IL-8) were identified as having significantly different concentrations by 3-way comparison.
Three-Way Comparison of Blood and Stool Analyte Measurements in Study Cohorts
| Analyte | ICH (n = 42) | Non-ICH (n = 50) | ASC (n = 31) | P Valuea | BH | BF |
|---|---|---|---|---|---|---|
| Blood | q* = 0.04375 | q* = 0.00625 | ||||
| G-CSF | 63.70 (15.63–627.78) | 28.16 (13.27–99.72) | 9.84 (3.80–21.19) | <.001 | SIG | SIG |
| IL-10 | 15.63 (5.68–41.99) | 14.30 (2.92–33.35) | 2.05 (1.24–16.25) | .0012 | SIG | SIG |
| IL-15 | 4.73 (0.76–14.08) | 3.54 (0.76–9.41) | 0.76 (0.76–1.62) | <.001 | SIG | SIG |
| IL-1β | 0.56 (0.56–1.11) | 0.56 (0.56–0.86) | 0.56 (0.56–0.56) | .131 | NS | NS |
| IL-4 | 0.21 (0.21–9.12) | 0.21 (0.21–31.92) | 0.41 (0.41–0.41) | .038 | SIG | NS |
| IL-6 | 10.68 (3.47–69.88) | 11.33 (1.87–39.43) | 0.54 (0.14–5.80) | <.001 | SIG | SIG |
| IL-8 | 57.11 (23.66–100.80) | 62.94 (26.92–115.58) | 21.00 (8.97–40.23) | <.001 | SIG | SIG |
| TNF-α | 15.20 (7.42–24.77) | 10.80 (7.42–18.36) | 8.53 (4.07–15.26) | .027 | SIG | NS |
| Stool | q* = 0.01875 | q* = 0.00625 | ||||
| G-CSF | 3.80 (3.80–7.82) | 6.63 (3.80–13.38) | 3.80 (3.80–7.64) | .032 | NS | NS |
| IL-10 | 1.24 (1.24–1.24) | 1.24 (1.24–2.35) | 1.24 (1.24–1.24) | .010 | SIG | NS |
| IL-15 | 1.27 (0.76–3.40) | 2.47 (0.76–5.09) | 0.76 (0.76–4.42) | .034 | NS | NS |
| IL-1β | 10.97 (1.57–195.10) | 9.71 (1.95–1595.77) | 0.56 (0.56–0.56) | <.001 | SIG | SIG |
| IL-4 | 7.69 (3.21–15.80) | 13.81 (3.21–23.38) | 4.39 (0.78–15.03) | .064 | NS | NS |
| IL-6 | 0.14 (0.14–0.74) | 0.14 (0.14–1.68) | 0.14 (0.14–3.20) | .775 | NS | NS |
| IL-8 | 5.11 (0.41–41.72) | 11.62 (2.77–109.73) | 0.41 (0.41–2.35) | <.001 | SIG | SIG |
| TNF-α | 4.07 (4.07–4.07) | 4.07 (4.07–4.07) | 4.07 (4.07–4.07) | .538 | NS | NS |
Unless otherwise indicated, data are presented as median (interquartile range) picograms per milliliter.
Abbreviations: ASC, asymptomatic carrier of Clostridioides difficile; BF, Bonferroni corrected significance level (q*); BH, Benjamini-Hochberg corrected significance level (q*); G-CSF, granulocyte colony-stimulating factor; ICH, immunocompromised host; IL, interleukin; non-ICH, nonimmunocompromised host; NS, nonsignificant, SIG, significant; TNF-α, tumor necrosis factor alpha.
P value represents the 3-way comparison between the groups via the Kruskal-Wallis test.
Three-way comparison found that blood concentrations of G-CSF were significantly higher in the CDI groups compared with the ASC group (P < .001; Table 2 and Figure 1). We then performed pairwise testing comparing the groups (ICH, non-ICH, and ASC) to each other (Table 3). Here, we found no significant differences in G-CSF concentrations in the ICHs with CDI subjects compared to the non-ICHs with CDI (P = .083). We noted that 6 subjects (4 ICHs and 2 ASCs) had received filgrastim (G-CSF) within the week of CDI diagnosis. Therefore, we performed an additional sensitivity analysis excluding these 6 subjects (Supplementary Table 1). This analysis verified that blood G-CSF concentrations remained higher in CDI cohorts compared with the ASC group (P < .0001).
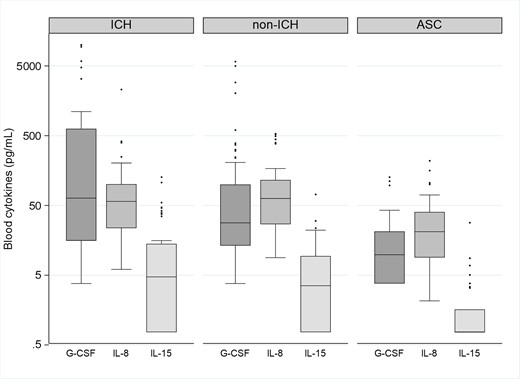
Box plots showing the distribution of blood concentrations of granulocyte colony-stimulating factor (G-CSF), interleukin (IL)–8, and IL-15 in immunocompromised subjects with Clostridioides difficile infection (ICH), nonimmunocompromised subjects with C difficile infection (non-ICH), and asymptomatic carriers of C difficile (ACS). The bottom and top edges of the boxes for each cohort indicate the interquartile range, the horizontal line bisecting the box indicates the median value, and the whiskers represent 5% and 95% values; outliers are represented by circles. P < .001 across the 3 groups for each of the cytokines represented. The P value remained statistically significant after correction with Benjamini-Hochberg and Bonferroni correction methods.
Comparisons of Blood and Stool Cytokines in Immunocompromised Subjects, Nonimmunocompromised Hosts, and Asymptomatic Carriers
| Analyte | ICH (n = 42) | Non-ICH (n = 50) | P Value | BH | BF |
|---|---|---|---|---|---|
| Blood | q* = 0.01666 | q* = 0.01666 | |||
| G-CSF | 63.70 (15.63–627.78) | 28.16 (13.27–99.72) | .083 | NS | NS |
| IL-10 | 15.63 (5.68–41.99) | 14.30 (2.92–33.35) | .291 | NS | NS |
| IL-15 | 4.73 (0.76–14.08) | 3.54 (0.76–9.41) | .165 | NS | NS |
| IL-4 | 0.21 (0.21–9.12) | 0.21 (0.21–31.92) | .753 | NS | NS |
| IL-6 | 10.68 (3.47–69.88) | 11.33 (1.87–39.43) | .688 | NS | NS |
| IL-8 | 57.11 (23.66–100.80) | 62.94 (26.92–115.58) | .470 | NS | NS |
| TNF-α | 15.20 (7.42–24.77) | 10.80 (7.42–18.36) | .154 | NS | NS |
| Stool | q* = 0.01666 | q* = 0.01666 | |||
| IL-10 | 1.24 (1.24–1.24) | 1.24 (1.24–2.35) | .005 | SIG | SIG |
| IL-1β | 10.97 (1.57–195.10) | 9.71 (1.95–1595.77) | .331 | NS | NS |
| IL-8 | 5.11 (0.41–41.72) | 11.62 (2.77–109.73) | .068 | NS | NS |
| Non-ICH (n = 50) | ASC (n = 31) | ||||
|---|---|---|---|---|---|
| Blood | q* = 0.03571 | q* = 0.00714 | |||
| G-CSF | 28.16 (13.27–99.72) | 9.84 (3.80–21.19) | <.001 | SIG | SIG |
| IL-10 | 14.30 (2.92–33.35) | 2.05 (1.24–16.25) | .004 | SIG | SIG |
| IL-15 | 3.54 (0.76–9.41) | 0.76 (0.76–1.62) | .004 | SIG | SIG |
| IL-4 | 0.21 (0.21–31.92) | 0.41 (0.41–0.41) | .052 | NS | NS |
| IL-6 | 11.33 (1.87–39.43) | 0.54 (0.14–5.80) | .001 | SIG | SIG |
| IL-8 | 62.94 (26.92–115.58) | 21.00 (8.97–40.23) | <.001 | SIG | SIG |
| TNF-α | 10.80 (7.42–18.36) | 8.53 (4.07–15.26) | .093 | NS | NS |
| Stool | q* = 0.03333 | q* = 0.01666 | |||
| IL-10 | 1.24 (1.24–2.35) | 1.24 (1.24–1.24) | .053 | NS | NS |
| IL-1β | 9.71 (1.95–1595.77) | 0.56 (0.56–0.56) | <.001 | SIG | SIG |
| IL-8 | 11.62 (2.77–109.73) | 0.41 (0.41–2.35) | <.001 | SIG | SIG |
| ICH (n = 42) | ASC (n = 31) | ||||
|---|---|---|---|---|---|
| Blood | q* = 0.05 | q* = 0.00714 | |||
| G-CSF | 63.70 (15.63–627.78) | 9.84 (3.80–21.19) | <.001 | SIG | SIG |
| IL-10 | 15.63 (5.68–41.99) | 2.05 (1.24–16.25) | <.001 | SIG | SIG |
| IL-15 | 4.73 (0.76–14.08) | 0.76 (0.76–1.62) | <.001 | SIG | SIG |
| IL-4 | 0.21 (0.21–9.12) | 0.41 (0.41–0.41) | .011 | SIG | NS |
| IL-6 | 10.68 (3.47–69.88) | 0.54 (0.14–5.80) | <.001 | SIG | SIG |
| IL-8 | 57.11 (23.66–100.80) | 21.00 (8.97–40.23) | .001 | SIG | SIG |
| TNF-α | 15.20 (7.42–24.77) | 8.53 (4.07–15.26) | .010 | SIG | NS |
| Stool | q* = 0.03333 | q* = 0.01666 | |||
| IL-10 | 1.24 (1.24–1.24) | 1.24 (1.24–1.24) | .745 | NS | NS |
| IL-1β | 10.97 (1.57–195.10) | 0.56 (0.56–0.56) | <.001 | SIG | SIG |
| IL-8 | 5.11 (0.41–41.72) | 0.41 (0.41–2.35) | <.001 | SIG | SIG |
Unless otherwise indicated, data are presented as median (interquartile range) picograms per milliliter. Data include only cytokines that were found to be statistically significantly different using both Benjamini-Hochberg and Bonferroni methods.
Abbreviations: ASC, asymptomatic carrier of Clostridioides difficile; BF, Bonferroni corrected significance level (q*); BH, Benjamini-Hochberg corrected significance level (q*); G-CSF, granulocyte colony-stimulating factor; ICH, immunocompromised host; IL, interleukin; non-ICH, nonimmunocompromised host; NS, nonsignificant, SIG, significant; TNF-α, tumor necrosis factor alpha.
CDI cohorts (ICH and non-ICH) were also noted to have higher blood concentrations of IL-8, IL-15, IL-10, and IL-6 compared to the ASCs (Figure 1, Table 2). Visual comparisons of the statistically significant blood cytokines are provided in a radar chart in Supplementary Figure 1. There were no statistically significant differences in blood cytokine concentrations in ICH CDI subjects compared with non-ICH CDI subjects.
After determining that 32.3% (10/31 subjects) of our ASCs had immunocompromise, we wanted to ascertain if there were any differences in blood or stool cytokine concentrations in ASCs with and without immunosuppression. In a separate analysis (Supplementary Table 2), we found no statistically significant differences in any of the 8 cytokines tested. We performed a sensitivity analysis for the subjects in the ASC group who received exogenous G-CSF (Supplementary Table 2) and found no difference in blood or stool G-CSF concentrations in the ASC groups with and without immunosuppression. Concomitant medications in the ICH group are reported in Supplementary Table 3.
Stool Cytokine Results
Stools were tested for the same 8 analytes described in the blood results (Table 2). After adjustment for multiple testing using the BF and BH methods, 2 cytokines (IL-1β and IL-8) were identified in the 3-way analysis as having significantly different concentrations across the groups. Three-way comparison found that median values for both analytes were significantly higher in the stool of both groups of CDI subjects versus the ASC cohort (P < .05). Stool concentrations of IL-1β demonstrated the most notable differences in concentrations between the CDI groups and the ASC group (Figure 2). Notably, there was no statistically significant difference in the stool concentration of IL-1β in the ICH CDI group compared with the non-ICH CDI group (P = .331) (Table 3, Figure 2). One cytokine (IL-10) demonstrated statistically significantly higher stool concentrations in non-ICHs with CDI (median, 1.24 pg/mL [range, 1.24–2.35 pg/mL]) versus ICHs with CDI (median, 1.24 [range, 1.24–1.24]) (P = .005), despite having the same median concentration. Overall, stool cytokine concentrations were similar in ICHs with CDI compared with non-ICHs with CDI.
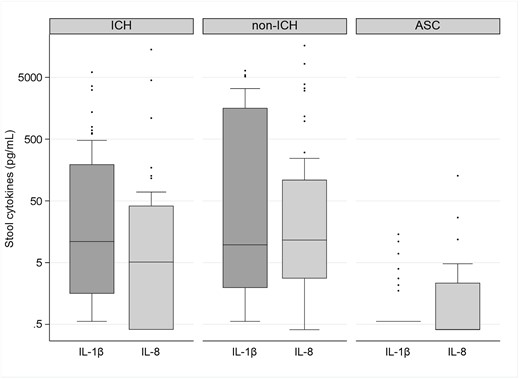
Box plots showing the distribution of stool concentrations of interleukin (IL)–1β and IL-8 in immunocompromised subjects with Clostridioides difficile infection (ICH), nonimmunocompromised subjects with C difficile infection (non-ICH), and asymptomatic carriers of C difficile (ACS). The bottom and top edges of the boxes for each cohort indicate the interquartile range, the horizontal line bisecting the box indicates the median value, and the whiskers represent 5% and 95% values; outliers are represented by circles. P < .001 across the 3 groups for each of the cytokines represented. The P value remained statistically significant after correction with Benjamini-Hochberg and Bonferroni correction methods.
DISCUSSION
CDI is a prevalent and problematic infection in ICHs, particularly among patients with hematologic malignancies and solid organ transplant [1, 13, 14]. This population has some of the highest rates of both C difficile colonization and non-CDI-associated diarrhea, which can complicate the diagnosis of CDI, particularly when NAAT-based testing is used as a standalone method. Furthermore, concerns have also been raised regarding the poor sensitivity of EIAs for CDI diagnosis in symptomatic ICHs when compared to other diagnostic methods such as toxigenic culture [15, 16]. In 1 study, 19% of ICHs with negative EIA for toxin A/B met criteria for severe CDI as defined by the IDSA/SHEA guidelines, and upwards of 10% of this same patient group required intensive care [16]. Concerns regarding sensitivity are not unique to ICHs, but the consequences of missed infection may be of particular concern in this frail population.
Diagnostics with improved sensitivity and specificity to detect C difficile and predict patients at risk for complications are needed for ICHs. Previously, fecal calprotectin has been evaluated as a possible tool for detecting CDI in cancer patients, with elevated levels of calprotectin found in cancer patients with CDI compared with non-CDI patients; however, investigators failed to establish a reliable cutoff that could be applied for routine diagnostic use [17]. Our prior research has focused on a multipronged approach to improving CDI diagnosis. First, we have developed and tested an ultrasensitive and quantitative toxin immunoassay capable of measurement of toxin A and toxin B in stool samples at concentrations ranging from picograms per milliliter to high nanograms per milliliter. This digital enzyme-linked immunosorbent assay (utilizing single molecule array technology, also known as Simoa) aims to overcome prior concerns regarding sensitivity of EIAs and thus may particularly benefit ICHs [18, 19]. In addition, our group has previously identified several promising blood and stool biomarkers that may be capable of distinguishing patients with CDI from patients with non-CDI diarrhea and ASCs [4, 6, 19]. However, one critical limitation to these prior studies was that they did not evaluate the performance of these assays in specific patient populations, such as patients with immunosuppression, and had insufficient sample size to interrogate other populations, such as persons with inflammatory bowel disease. In this research, we aimed to determine whether there are notable differences in the blood and stool cytokine profiles of hospitalized ICHs with CDI when compared to hospitalized non-ICHs with CDI. We also wanted to determine if there were differences in blood and stool cytokine concentrations in ICHs with CDI when compared to ASCs.
First, we evaluated a panel of cytokines in the blood of ICHs with CDI and compared cytokine concentrations with those in non-ICHs with CDI. Contradictory to our initial hypothesis, there were no significant differences in blood cytokine concentrations between the 2 groups. As a substantial proportion (45.2%) of our ICHs were on corticosteroids at the time of sample collection, we had expected to see lower concentrations of inflammatory cytokines related to the mechanism of action of these drugs (which work by downregulating proinflammatory genes and inhibiting synthesis of inflammatory cytokines) [20]. However, when these 2 CDI groups were compared with ASCs, there were highly statistically significant differences in concentrations of several blood cytokines including G-CSF, IL-10, IL-15, IL-6, and IL-8, supporting our prior data that noted elevations in these markers in CDI subjects when compared to carrier cohorts [4]. We also found that when the ASCs were further subdivided by immunocompromised status, cytokine patterns in the blood (and stool) were similarly lower for both ASCs with and without immunocompromise, when compared to the CDI groups. The findings highlight that the immunocompromised state did not significantly impair our ability to show differences in blood.
Next, we evaluated a panel of cytokines in the stool of ICHs with CDI and compared cytokine concentrations with non-ICHs with CDI. Results from the stool testing mirrored that of the blood testing, with similar concentrations of all measured stool cytokines observed in the ICHs when compared to the non-ICHs. Our recent work found that IL-1β was highly discriminatory in differentiating CDI from non-CDI diarrhea [6]. Hence, we were particularly interested in evaluating whether concentrations of this stool cytokine differed in ICHs with CDI when compared to the other groups. As noted, we found no statistically significant differences in stool IL-1β concentrations in ICHs compared with non-ICHs. However, stool IL-1β did retain its ability to distinguish CDI in ICHs from the ASCs, supporting its promise as a potential CDI biomarker in this special population. The majority of the cytokines that were elevated in both groups belong to the TLR9-NFκB-NLRP3-ASC inflammatory cascade [21], a primarily innate immune pathway that is not directly targeted by most current immunosuppressive regimens, possibly explaining the lack of apparent differences in the cytokine concentrations between ICH and non-ICH subjects.
Our study has several limitations. Our cohort of ICHs is heterogenous, and thus we are limited in our ability to make specific conclusions regarding cytokine responses in special disease states. This group received a diverse selection of immunosuppressing medications; therefore, we are unable to draw specific conclusions about the effect of a single class of agents on cytokine response in CDI cases. We also are unable to precisely qualify the degree to which cytokine concentrations may have been affected by the immunosuppressing medications received. We found that 6 subjects in the study (4 ICHs and 2 ASCs) had received G-CSF within the week of CDI diagnosis. While the results of the cytokine analysis did not appear to be affected by this exogenous drug in a secondary analysis (Supplementary Table 1), we acknowledge that measurement of G-CSF may be more problematic for future research in this area given its common use in clinical practice. Furthermore, our project focused on CDI cohorts and did not include subjects with non-CDI-related diarrhea, which is common in ICHs. A separate, larger study might benefit from having additional comparative cohorts with immunocompromise including ICHs with non-CDI diarrhea related to other infections or medications. While a limitation, we do not feel that this is likely to impact the findings of this study, given that we have separately shown that blood and stool cytokine concentrations separate subjects with CDI from those with non-CDI-related diarrhea [4].
In this study of 92 subjects with CDI, blood and stool cytokine concentrations in ICHs with CDI were similar to those in non-ICHs with CDI. Our previously identified stool biomarker IL-1β was able to distinguish both ICHs and non-ICHs with CDI from the ASC group (compromised of both ICHs and non-ICHs). While our prior work demonstrated deficiencies in the humoral host response to CDI in ICHs, these data suggest that the innate immune response to CDI may be preserved in this population. These preliminary, exploratory data need to be validated in a larger, independent cohort. However, if confirmed, these data may open the door for establishing approaches to CDI diagnosis that will be broadly applicable to special patient populations such as oncology and transplant recipients.
Supplementary Data
Supplementary materials are available at Open Forum Infectious Diseases online. Consisting of data provided by the authors to benefit the reader, the posted materials are not copyedited and are the sole responsibility of the authors, so questions or comments should be addressed to the corresponding author.
Notes
Author contributions. M. B., J. V.-G., and C. D. A. designed the study. M. B. coordinated and collected the data. M. B., J. V.-G., R. B., and C. D. A. analyzed the data. M. B., J. V.-G., R. P., and C. D. A. interpreted the results. C. D. A. wrote the first draft. R. S., C. B., A. J. G.-L., K. D., K. W. G., H. X., Q. L., L. W., X. C., N. R. P., and C. P. K. collected the data, interpreted the results, and critically reviewed the article.
Acknowledgments. We thank all patients who participated in this study; Alice Bantz and her team from bioMérieux; Dr Nicole White, who assisted with the CDI severity classifications; Christine Cuddemi for study support; and Dr Taryn Eubank for assistance with chart reviews.
Financial support. This work was supported by the Merck Investigator Study Program (awarded to C. D. A.) and by a grant from the National Institutes of Health, National Institute of Allergy and Infectious Diseases (grant number 1R01AI116596 to N. R. P. and C. P. K.).
References
Author notes
Potential conflicts of interest. J. V.-G. receives partial salary support from an unrestricted research grant from Milky Way Life Sciences to Beth Israel Deaconess Medical Center (BIDMC). C. P. K. has acted as a paid consultant to Artugen, Facile Therapeutics, Ferring, First Light Biosciences, Finch, Milky Way Life Sciences, Pfizer, RVAC Medicines, Seres, Summit, and Vedanta and has received grant support from Milky Way Life Sciences and Pfizer. K. W. G. has received grant support paid to the University of Houston from Acurx, Summit, Paratek Pharmaceuticals, and Seres Health. C. D. A. has received research funding from Merck (paid to BIDMC) and has served in an advisory role to Cidara Therapeutics, AiCuris, and Merck. All other authors report no conflicts of interest.


Comments