


Abstract
Severe fever with thrombocytopenia syndrome (SFTS) is an emerging infectious disease with an extensive geographical distribution and high mortality rate. To date, the role of SFTS virus (SFTSV) in urine is still elusive. We aimed to explore the relationship between urinary bunyavirus and acute kidney injury (AKI) and mortality in patients with SFTS.
Urine samples were collected from 102 patients to quantify SFTSV load in urine (U-SFTSV). Patient renal function was evaluated on admission. Receiver operating characteristic (ROC) curve and logistic regression analysis were performed to evaluate the predictive value of U-SFTSV. Viral infectivity assays in Vero cells were performed from 10 urine samples.
The U-SFTSV level was positively correlated with SFTSV load in plasma (r = 0.624) and indicators of renal damage. The U-SFTSV level was identified as an independent risk factor for SFTS-associated AKI (odds ratio, 3.631; P = .019). The U-SFTSV showed great value in predicting the fatal outcome of SFTS patients with high area under curve (0.881). The Kaplan-Meier survival comparison showed that patients with U-SFTSV levels greater than 6379 copies/mL were at a higher risk of death within 28 days after onset. In addition, 4 urine samples with high U-SFTSV levels were infectious.
Our large cohort study identified that the U-SFTSV level is a novel convenient and noninvasive predictive biomarker for incidence of AKI and poor outcome of patients with SFTS. Urine specimens could be a source of SFTSV infection in humans.
Severe fever with thrombocytopenia syndrome (SFTS) is an emerging tick-borne infectious disease first described in central China in 2009, with a 5%–30% fatality rate [1–4]. The causative agent was identified as a novel Phlebovirus in the Bunyaviridae family, subsequently named severe fever with thrombocytopenia syndrome virus (SFTSV) [2, 3, 5], newly renamed as Dabie bandavirus [6]. In addition to tick-to-human transmission, SFTSV can be transmitted from person to person, probably via infected blood, body fluids, mucosa, and aerosols [7–10]. Currently, SFTS is widely distributed in more than 20 provinces of China [4, 11]. It has also been reported in Korea, Japan, and Vietnam [12–14]. Due to its high mortality rate, the possibility of multiple transmission routes and its extensive geographical distribution, SFTS has become a potential threat to public health and a priority infectious disease that urgently needs to be studied according to the World Health Organization [15]. To date, there is no specific and effective treatment for SFTS patients. Early identification and intervention are essential to improve the clinical outcome of patients who may die of SFTS.
Several studies have described early hematological predictors of poor outcomes in SFTS, including viral load [16]; organ damage indicators such as platelet (PLT), lactate dehydrogenase (LDH), creatine kinase (CK), activated partial thromboplastin time (APTT), and blood urea nitrogen (BUN) [17–19]; and inflammatory-related indicators such as neutrophil counts, lymphocyte counts, interleukin (IL)-10, IL-1β, interferon inducible protein (IP)-10, and IL-6 [20, 21]. Among these indicators, viral load is the most important prognostic indicator, its concentration directly reflects the replication of pathogens in vivo to evaluate the severity of disease. Bunyavirus was present in infected patients’ urine as previous study described [22], and SFTSV can invade the kidney in vivo and has been confirmed in renal tissue from the autopsy of patients who died from SFTS [23, 24]. Moreover, renal damage is one of the most common complications of SFTS, with higher occurrence rates up to 50%, which is correlated with disease mortality [19, 25, 26]. However, to date, there is also a lack of systematic research on the association between urinary bunyavirus and incidence of renal injury and mortality of patients with SFTS. Moreover, few researches were focused on developing convenient or noninvasive methods for the viral detection to evaluate the severity of SFTS.
We performed urine collection on admission for SFTSV detection in 102 patients with SFTS to determine the relationship between SFTSV load in urine (U-SFTSV) and early renal impairment and its value in predicting adverse outcome of illness. This study aimed to identify a noninvasive, easily accessible sample to detect the virus as a predictive indicator for incidence of acute kidney injury (AKI) and prognosis of patients with SFTS. It may be a novel noninvasive method for healthcare workers to identify patients with AKI and potentially fatal outcome and take early medical intervention to improve clinical outcomes. In addition, we provide a reference for the possible route of human-to-human transmission by detecting virus infectivity in urine.
METHODS
Patients
From May 2021 to September 2022, a cohort of 110 patients hospitalized at the First Affiliated Hospital of Nanjing Medical University with an SFTS diagnosis were enrolled in the study. Diagnostic criteria of SFTS were as follows: (1) possibility of tick bite history; (2) acute fever, fatigue with thrombocytopenia; and (3) positive SFTSV ribonucleic acid (RNA) confirmed by real-time quantitative reverse-transcription polymerase chain reaction (qRT-PCR) in plasma. Exclusive criteria were as follows: (1) laboratory-confirmed other pathogen infections; (2) underlying kidney disease or other serious systemic diseases; or (3) urine was not collected. Patient renal function was evaluated on admission according to the Kidney Disease Improving Global Outcomes (KDIGO) [27]. Acute kidney injury was defined as any of the following criteria: (1) increase in serum creatinine (sCr) by ≥0.3 mg/dL (≥26.5 μmol/L) within 48 hours; (2) increase in sCr to ≥1.5 times baseline, which is known or presumed to have occurred within the prior 7 days; or (3) urine volume <0.5 mL/(kg*h) for 6 hours. Severe fever with thrombocytopenia syndrome with encephalopathy is defined as coma, delirium, or repeated convulsions, with symptoms persisting for longer than 24 hours [28].
Laboratory examination included white blood cell (WBC) count, neutrophil count, lymphocyte count, monocyte count, PLT count, aspartate aminotransferase (AST), gamma-glutamyl transpeptidase, LDH, albumin, CK, APTT, BUN, sCr, urine protein, and urine blood, which were collected on admission and included in the analysis. All patients were followed to observe outcomes for 28 days after symptom onset.
Urine Collection and Severe Fever With Thrombocytopenia Syndrome Virus Detection
One hundred two fresh urine samples from hospitalized patients were collected on admission using 50-mL tubes. Viral RNA was extracted from urine and plasma samples with a commercial kit (DAAN GENE, Guangzhou, China) by a trained specialist. The extracted RNA was amplified using specific primers and probes by one-step real-time fluorescence qRT-PCR for the detection of a novel bunyavirus in all specimens according to the manufacturer's instructions. Real-time qRT-PCR cycling was performed as follows: after reverse transcription at 50°C for 15 minutes, polymerase was activated at 95°C for 15 minutes, and amplification was undertaken for 45 cycles consisting of a denaturing step at 94°C for 15 seconds and an annealing-extension step at 55°C for 45 seconds. The fluorogenic signal emitted was collected during the extension step. A Cycle threshold (Ct) value greater than 35 indicates negative result of the sample viral load.
Histopathology and Immunohistochemistry of Animal Kidney
All animal-related experiments were conducted in animal biological safety level 2 + containment laboratories of Huadong Medical Institute of Biotechniques (HMIB) Nanjing, China. Relevant mouse experiments were approved by the Research and Ethics Committee of the HMIB. IFNAR−/− C57BL/6 mice were bred and maintained in an environmentally controlled and specific-pathogen-free animal facility of HMIB. Six- to eight-week-old IFNAR−/− C57BL/6 mice were randomly divided into mock and SFTSV model groups. In infection experiments, mice were subcutaneously inoculated with 100 μL of 1.0 × 10⁶ TCID50/mL SFTSV solution, whereas the mock was inoculated with 100 μL of Dulbecco's modified Eagle's medium ([DMEM] Gibco Invitrogen). Kidney tissues were collected from each group of mice at 5 days postinfection, embedded in paraffin, sectioned, and stained with hematoxylin and eosin (H&E). Immunohistochemistry (IHC) was used to detect the location and expression of SFTSV nucleoprotein (NP). A monoclonal antibody against SFTSV NP was used as the primary antibody for IHC (Cambridge Biologics, Boston, USA).
Urinary Severe Fever With Thrombocytopenia Syndrome Virus Infectivity
Virus infectivity assays of urine samples from infected patients were carried out in a biosafety level-2 facility at the First Affiliated Hospital of Nanjing Medical University Infectious Pathogen Diagnostic Laboratory. African green monkey Vero E6 cells (ATCC, Manassas, VA) were cultured in DMEM containing 10% fetal bovine serum ([FBS] Gibco Invitrogen) and 1% penicillin/streptomycin (Gibco Invitrogen) at 37°C in a humidified 5% CO2 incubator. The clarified urine was diluted with DMEM to a 1:1 ratio after being passed through a 0.22-μm syringe filter. Vero cells were pre-seeded in a 6-well plate overnight at a density of 1 × 10⁵ cells/well and exposed to 1 mL of 10-fold serially diluted urine solution for 2 hours. Then, the supernatant was removed, and the cells were washed 3 times with prechilled phosphate-buffered saline (Gibco Invitrogen). The infected cells were maintained in DMEM supplemented with 2% FBS and 1% penicillin/streptomycin at 37°C in 5% CO2 for 5 days. Viral RNA was extracted from the cells after incubation. Then, real-time qRT-PCR to detect specific SFTSV genes was performed to confirm the presence of viral replication.
Statistical Analysis
Statistical analysis and data visualization were performed using SPSS 25.0 (IBM, Armonk, NY), MEDCALC (MedCalc Software, Ostend, Belgium), or otherwise specified. Quantitative variables are expressed as the mean ± standard deviation for normally distributed data or as the median (p25, p75) for nonnormally distributed data, whereas categorical variables are expressed as percentages. The independent Student t test or nonparametric Mann-Whitney U test was used for comparisons of quantitative variables where appropriate, whereas the χ2 test was used to compare categorical variables. Correlations between numerical variables were analyzed using Spearman correlation analysis. Multivariate regression analysis was performed to determine independent risk factors for patients with AKI. Receiver operating characteristic (ROC) analysis was used to identify cutoff values and evaluate the predictive value of the risk factors. Survival comparisons were estimated by the Kaplan-Meier method, and differences in survival were evaluated with the log-rank test. Differences with a 2-sided P < .05 were considered statistically significant.
RESULTS
Correlations Between Severe Fever With Thrombocytopenia Syndrome Virus Levels in Urine and Severity-Related Indicators
In total, 110 patients hospitalized at the First Affiliated Hospital of Nanjing Medical University with SFTS diagnosis were included in the study, and 8 patients without acquiring urine in a timely manner were excluded (Supplementary Figure 1). Urine samples were collected from patients on admission, 33 of the 102 urine samples were negative at the time of testing. The U-SFTSV concentrations (logarithm of 10, Lg) were up to 7.5 copies/mL. Spearman correlation analysis was carried out to analyze the correlation between viral load in urine and plasma. The results indicated that there was a positive correlation of U-SFTSV with SFTSV load in plasma (P-SFTSV) (r = 0.624, P < .001) (Figure 1A).
![Relationship between severe fever with thrombocytopenia syndrome virus load in urine (U-SFTSV) and plasma viral load and severity-related indicators in patients with SFTS. (A) Correlation analyses between SFTSV concentrations in urine and plasma, with simple linear regression (dotted line). The U-SFTSV levels are positively correlated with plasma viral load. (B) Spearman correlation heatmap showing that U-SFTSV was significantly associated with lymphocytes (r = −0.34, P < .001), monocytes (r = −0.36, P < .001), platelets ([PLTs] r = −0.31, P < .01), aspartate aminotransferase ([AST] r = 0.35, P < .001), lactate dehydrogenase ([LDH] r = 0.43, P < .001), activated partial thromboplastin time ([APTT] r = 0.51, P < .001), serum creatinine ([Cr] r = 0.45, P < .001), and blood urea nitrogen ([BUN] r = 0.44, P < .001). Dotted line: lower limit of detection. Red represents positive correlations; blue represents negative correlations; and color depth and square size represent the intensity of the correlation. Significant correlations are marked by asterisks; *, **, and *** represent P < .05, < .01, and < .001, respectively. Lg, logarithm of 10; WBC, white blood cell.](https://oup.silverchair-cdn.com/oup/backfile/Content_public/Journal/ofid/10/4/10.1093_ofid_ofad085/1/m_ofad085f1.jpeg?Expires=1747884126&Signature=pTmepeWT9LJUgIkfofy2g~KgnxlppgtOeOix9vq5nphqKBJEH4rPhfW5QhEUYOVWhDPmPHLT-cvtMtzya9Z8ErFzyCfyokO6zbIJP~SUnwt59ZqlGz5j6FZljeQaTN7ENjL7OVQYn~pmlsCBl~GVtsUaJEujylymGXe~n1Swp~CGN1xysq1W4kX8CW8mbiQL96DqcyZ5Xaliy0S8os3WaSk95Jr4uHYDP4CdcdBkTaDB87dG0UEKRMJTIUvTuh-n49v7o~5~ivQWdhgq~axMDoHEDV6sjGjTLcp-Xg-cp4qFSfBQLqyKYqEp7WeqwR74lGvxLd-PfqvL5R4YzlK~pg__&Key-Pair-Id=APKAIE5G5CRDK6RD3PGA)
Relationship between severe fever with thrombocytopenia syndrome virus load in urine (U-SFTSV) and plasma viral load and severity-related indicators in patients with SFTS. (A) Correlation analyses between SFTSV concentrations in urine and plasma, with simple linear regression (dotted line). The U-SFTSV levels are positively correlated with plasma viral load. (B) Spearman correlation heatmap showing that U-SFTSV was significantly associated with lymphocytes (r = −0.34, P < .001), monocytes (r = −0.36, P < .001), platelets ([PLTs] r = −0.31, P < .01), aspartate aminotransferase ([AST] r = 0.35, P < .001), lactate dehydrogenase ([LDH] r = 0.43, P < .001), activated partial thromboplastin time ([APTT] r = 0.51, P < .001), serum creatinine ([Cr] r = 0.45, P < .001), and blood urea nitrogen ([BUN] r = 0.44, P < .001). Dotted line: lower limit of detection. Red represents positive correlations; blue represents negative correlations; and color depth and square size represent the intensity of the correlation. Significant correlations are marked by asterisks; *, **, and *** represent P < .05, < .01, and < .001, respectively. Lg, logarithm of 10; WBC, white blood cell.
We further analyzed the relationship between U-SFTSV and severity-related indicators among 102 patients. A correlation heatmap (R version 4.2.0 with the corrplot package) showed that U-SFTSV were correlated with levels of WBC, lymphocyte count, monocyte count, PLT, AST, LDH, CK, and APTT and particularly positively correlated with the indicators of renal damage: sCr and BUN (Figure 1B). All these results suggest that, similar to viruses in plasma, U-SFTSV may also be a comprehensive and significant indicator that can reflect the severity of SFTS.
High Levels of Severe Fever With Thrombocytopenia Syndrome (SFTS) Virus Loads in Urine in SFTS-Associated Acute Kidney Injury
All 102 patients’ renal functions were evaluated on admission according to KDIGO, 28 (27.5%) patients were diagnosed with AKI, whereas 74 patients were diagnosed with non-AKI. The clinical characteristics of AKI and non-AKI patients with SFTS are summarized in Table 1. In the univariate logistic regression analyses, the distribution of males and the percentages of intensive care unit (ICU) admission and mortality in the AKI group were statistically higher than those in the non-AKI group. Laboratory tests, including counts of lymphocytes and PLTs, and the levels of AST, LDH, CK, APTT, sCr, BUN, and U-SFTSV in AKI patients were significantly different from those in non-AKI patients. After adjusting for the effects of confounding factors in the multivariate logistic regression analysis (all P < .01 variables were included for multivariate analysis), U-SFTSV (odds ratio [OR], 3.631; 95% confidence interval, 1.239–10.640; P = .019), BUN, CK, and AST were independent risk factors for patients with AKI. Similarly, patients with renal damage-related indicators, such as sCr (≥1 mg/mL), BUN (≥8 mmol/L), protein in urine (≥2+), and the presence of blood in urine, had significantly higher U-SFTSV levels than those patients with sCr (<1 mg/mL), BUN (<8 mmol/L), protein in urine (<2+), and the absence of blood in urine (Supplementary Figure 2). Altogether, these results indicate that a higher level of U-SFTSV correlated with increased incidence of SFTS-associated renal injury.
Comparisons of the Clinical Characteristics and Laboratory Values Between non-AKI and AKI Patients With SFTS
| Variable | All Patients | Non-AKI | AKI | Univariate Analysis P Value | Multivariate Logistic Analysis | |
|---|---|---|---|---|---|---|
| OR (95% CI) | P Valuea | |||||
| Patient, N | 102 | 74 | 28 | … | … | … |
| Clinical Features | … | … | … | … | … | … |
| Age (years) | 63.8 ± 10.3 | 63.3 | 65.0 | .437 | … | … |
| Male, N (%) | 49 (48.0) | 31 (41.9) | 18 (64.3) | .046 | … | … |
| Hypertension, N (%) | 24 (23.5) | 14 (18.9) | 10 (35.7) | .079 | … | … |
| Diabetes, N (%) | 16 (15.7) | 10 (13.5) | 6 (21.4) | .±331 | … | … |
| Time from onset to admission (days) | 7.0 (5.0–8.0) | 7.0 (5.0– 8.0) | 7.0 (5.0–8.0) | .952 | … | … |
| ICU admission, N (%) | 41 (40.2) | 18 (24.3) | 23 (82.1) | <.001 | … | … |
| Mortality, N (%) | 15 (14.7) | 1 (1.4) | 14 (50.0) | <.001 | … | … |
| Laboratory Values on Admission | … | … | … | … | … | … |
| WBC count (×109/L) | 2.3 (1.6–3.6) | 2.5 (1.7–3.8) | 1.8 (1.4–2.7) | .485 | … | … |
| Neutrophil count (×109/L) | 1.3 (1.0–2.1) | 1.4 (0.9–2.2) | 1.2 (1.0–1.8) | .860 | … | … |
| Lymphocyte count (×109/L) | 0.6 (0.4–1.2) | 0.8 (0.4–1.3) | 0.4 (0.3–0.6) | .010 | … | … |
| Monocyte count (×109/L) | 0.1 (0.1–0.3) | 0.2 (0.1–0.3) | 0.1 (0.1–0.2) | .616 | … | … |
| Platelet count (×109/L) | 41.0 (30.0–63.0) | 46.0 (32.8–64.5) | 33.5 (27.0–50.0) | .011 | … | … |
| AST (U/L) | 216.5 (103.8–368.6) | 149.5 (84.5–268.3) | 446.7 (241.3–1064.0) | <.001 | 1.006 (1.000–1.012) | .045 |
| LDH (U/L) | 737.5 (403.5–1298.0) | 498.5 (356.5–990.8) | 1890.0 (1108.0–4614.0) | <.001 | 1.000 (.998–1.001) | .916 |
| Albumin (g/L) | 32.2 | 32.1 | 32.6 | … | … | … |
| CK (U/L) | 466.0 (163.0–981.3) | 284.5 (128.8–574.8) | 1082.0 (651.8–3881.0) | <.001 | 1.001 (1.000–1.003) | .047 |
| APTT (s) | 41.5 (36.0–50.2) | 39.6 (34.3–44.2) | 54.7 (44.5–68.9) | <.001 | .933 (.827–1.052) | .259 |
| sCr (μmol/L) | 69.7 (56.2–89.4) | 63.1 (53.4–74.3) | 112.6 (85.9–177.1) | <.001 | 1.020 (.965–1.079) | .483 |
| BUN (mmol/L) | 6.5 (4.4–8.7) | 5.3 (3.9–6.8) | 11.5 (8.7–16.2) | <.001 | 2.250 (1.131–4.879) | .022 |
| Lg (U-SFTSV) (copies/mL) | 2.5 (0.0–3.6) | 2.1 (0.0–2.7) | 4.2 (3.3–5.1) | <.001 | 3.631 (1.239–10.640) | .019 |
Abbreviations: AKI, acute kidney injury; APTT, activated partial thromboplastin time; AST, aspartate aminotransferase; BUN, blood urea nitrogen; CI, confidence interval; CK, creatine kinase; ICU, intensive care unit; LDH, lactate dehydrogenase; Lg, logarithm of 10; OR, odds ratio; sCr, serum creatinine; SFTS, severe fever with thrombocytopenia syndrome; WBC, white blood cell; U-SFTSV, SFTSV load in urine.
NOTES: Data are presented as the mean ± standard deviation, median (p25, p75), and proportion. The bold value indicates P < .05.
Multivariable analysis included all significant (P < .01) variables.
Predictive Value of Severe Fever With Thrombocytopenia Syndrome (SFTS) Virus Loads in Urine for the Prognosis of SFTS
In total, 102 patients were divided into a survival group (n = 87) and a deceased group (n = 15) based on survival status at 28 days after onset. The comparison results of the characteristics between survivors and nonsurvivors are summarized in Table 2. The distribution of age, the occurrence of hemorrhagic signs, encephalopathy, and AKI, and the levels of WBC, lymphocyte counts, monocyte counts, platelet counts, AST, LDH, CK, APTT, sCr, and BUN in nonsurvivors were significantly different compared with those in survivors. More importantly, the U-SFTSV level was significantly higher in nonsurvivors than in survivors.
Characteristics of Surviving and Nonsurviving Patients With SFTS
| Characteristic | Survivors | Nonsurvivors | P Value |
|---|---|---|---|
| Patient, N | 87 | 15 | … |
| Clinical Features | … | … | … |
| Age (years) | 62.9 | 68.9 | .008a |
| Male, N (%) | 42 (48.3) | 7 (46.7) | .908b |
| Hypertension, N (%) | 18 (20.7) | 6 (40.0) | .113b |
| Diabetes, N (%) | 13 (14.9) | 3 (20.0) | .701b |
| Time from onset to admission (days) | 7.0 (5.0–8.0) | 7.0 (5.5–7.5) | .707c |
| Hemorrhagic signs, N (%) | 6 (6.9) | 4 (26.7) | .038b |
| Encephalopathy, N (%) | 17 (19.5) | 11 (73.3) | <.001b |
| Acute kidney injury, N (%) | 14 (16.1) | 14 (93.3) | <.001b |
| Laboratory Values on Admission | … | … | … |
| WBC count (×109/L) | 2.5 (1.7–3.7) | 1.6 (1.1–1.9) | .015c |
| Neutrophil count (×109/L) | 1.4 (1.0–2.2) | 1.1 (0.7–1.4) | .088c |
| Lymphocyte count (×109/L) | 0.7 (0.4–1.3) | 0.4 (0.2–0.5) | .019c |
| Monocyte count (×109/L) | 0.1 (0.1–0.3) | 0.1 (0.0–0.1) | .001c |
| Platelet count (×109/L) | 46.0 (31.0–63.0) | 32.0 (25.0–50.0) | .022c |
| AST (U/L) | 184.8 (89.8–2880) | 619.0 (296.0–1299.0) | <.001c |
| LDH (U/L) | 571.0 (390.0–1073.0) | 2309.0 (1392.0–5779.0) | <.001c |
| Albumin (g/L) | 32.2 | 32.3 | .951a |
| CK (U/L) | 353.0 (151.0–712.0) | 1073.0 (738.0–4007.0) | <.001c |
| APTT (s) | 40.0 (35.2–46.1) | 57.4 (46.8–68.9) | <.001c |
| sCr (μmol/L) | 65.6 (55.1–83.5) | 115.0 (84.1–219.1) | <.001c |
| BUN (mmol/L) | 6.0 (4.3–8.3) | 11.7 (6.6–20.5) | <.001c |
| Lg (U-SFTSV) (copies/mL) | 2.3 (0.0–3.1) | 4.3 (3.8–5.4) | <.001c |
Abbreviations: APTT, activated partial thromboplastin time; AST, aspartate aminotransferase; BUN, blood urea nitrogen; CK, creatine kinase; LDH, lactate dehydrogenase; Lg, logarithm of 10; sCr, serum creatinine; SFTS, severe fever with thrombocytopenia syndrome; U-SFTSV, SFTSV load in urine; WBC, white blood cell.
NOTES: Data are presented as the mean ± standard deviation, median (p25, p75), and proportion. The bold value indicates P < .05.
Student t test.
χ2 test/Fisher's exact test.
Nonparametric Mann-Whitney U test.
We further performed ROC analysis to evaluate the predictive value of U-SFTSV and P-SFTSV in the fatal outcome of patients with SFTS. As shown in Figure 2A, U-SFTSV achieved a satisfied predictive power for poor outcome in SFTS patients with high sensitivity and specificity (80.0% and 89.66%, respectively), the area under curve (AUC) values of U-SFTSV were highest (0.881), followed by P-SFTSV (0.819), the AUC of U-SFTSV&P-SFTSV was significantly higher than that of P-SFTSV (P < .05), and the cutoff value of U-SFTSV to predict fatal outcome was 6379 copies/mL. Subsequently, survival comparisons estimated by the Kaplan-Meier analysis showed that SFTS patients with higher U-SFTSV levels greater than 6379 copies/mL had a significantly higher 28-day mortality rate than patients with lower U-SFTSV (log-rank, P < .0001) (Figure 2B). Taken together, these results demonstrated that the U-SFTSV level on admission is a great predictive biomarker for adverse outcomes in patients with SFTS.
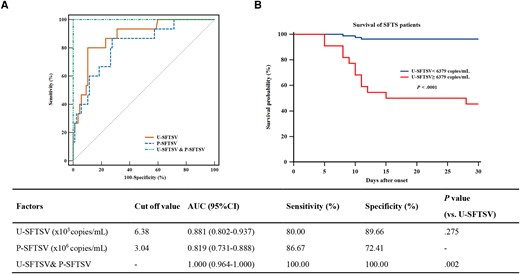
Performance of the severe fever with thrombocytopenia syndrome virus load in urine (U-SFTSV) and SFTSV load in plasma (P-SFTSV) in predicting the outcome of SFTS patients. (A) Receiver operating characteristic (ROC) analysis of U-SFTSV and P-SFTSV to predict SFTS outcomes 28 days after onset. (B) Kaplan-Meier survival curve analysis was used to compare the difference in the 28-day survival probability between SFTS subgroups partitioned by the cutoff value (6379 copies/mL) derived via ROC analysis. AUC, ROC curve; CI, confidence interval.
Presence of Severe Fever With Thrombocytopenia Syndrome Virus in Kidney Tissue
Previous studies discovered that SFTSV is present in the renal tissue of patients [24]. We further collected kidney tissues from mice infected with SFTSV for H&E and IHC staining. As shown in Supplementary Figure 3, compared with mock, H&E staining of the kidney slice showed renal tubule injury, which was characterized by karyopyknosis of epithelial cells, protein tube type, and interstitial congestion with inflammatory cell infiltration in SFTSV-infected mice. Immunohistochemistry of the kidney showed that SFTSV-NP was mainly present in interstitial in SFTSV-infected mice. These results indicate that SFTSV replicates in kidney tissue and that renal injury occurs at the same time.
Infectivity of Severe Fever With Thrombocytopenia Syndrome Virus in Urine
A previous study revealed that SFTSV could be transmitted from person to person in clinical events [7, 29], but the mode of transmission has not been clarified thoroughly. Therefore, we collected 10 fresh urine samples from SFTS patients for viral infectivity assays in Vero E6 cells. As presented in Table 3, 4 of the 10 urine samples from infected patients with high U-SFTSV levels successfully infected and replicated in Vero cells (Ct value <35 was defined as positive for SFTSV), 6 of the 10 urine samples were not infected that the virus was negative in Vero cells. Of the 4 patients with infectious urine, 3 were diagnosed with AKI on admission, and 2 patients with AKI finally had a fatal outcome. The results indicate that urine from patients with high U-SFTSV levels is probably the source of human-to-human transmission.
The Characteristics of 10 Patients and the Infectivity of Their Urine in Vero E6 Cells
| Urine Samples | Days After Onset | U-SFTSV (Copies/mL) | AKI | Protein | Blood | Outcome | Infected Vero E6 Cells | |
|---|---|---|---|---|---|---|---|---|
| qRT-PCR Ct Valuea | Infectivity | |||||||
| Patient 1 | 8 | 1.07E + 07 | Yes | 4+ | Yes | Died | 21.27 | Yes |
| Patient 2 | 12 | 1.46E + 06 | No | 2+ | No | Survived | 20.92 | Yes |
| Patient 3 | 10 | 3.23E + 07 | Yes | 4+ | Yes | Died | 19.75 | Yes |
| Patient 4 | 19 | 2.28E + 05 | Yes | 2+ | Yes | Survived | 22.45 | Yes |
| Patient 5 | 11 | 1.09E + 03 | No | 2+ | No | Survived | Negative | No |
| Patient 6 | 8 | 1.71E + 02 | No | 0 | No | Survived | Negative | No |
| Patient 7 | 9 | 1.08E + 03 | No | 2+ | Yes | Survived | Negative | No |
| Patient 8 | 5 | 1.77E + 02 | No | 0 | Yes | Survived | Negative | No |
| Patient 9 | 12 | 6.46E + 04 | Yes | 2+ | Yes | Survived | Negative | No |
| Patient 10 | 10 | 5.83E + 03 | No | 2+ | Yes | Survived | Negative | No |
Abbreviations: Ct, cycle threshold; qRT-PCR, quantitative reverse-transcription polymerase chain reaction; U-SFTSV, severe fever with thrombocytopenia syndrome virus load in urine.
Ct value less than 35 defined as positive for bunyavirus.
DISCUSSION
This cohort study identified several risk factors for SFTS-associated acute kidney injury at a tertiary referral hospital, which is a regional medical center for SFTS. We observed that U-SFTSV was one of the independent risk factors for AKI, which has not been reported before. More importantly, we identified that U-SFTSV was also a great predictive biomarker for poor outcome in patients with SFTS, with advantages of noninvasive and convenient sample acquisition. Furthermore, we also found that high SFTSV levels in urine is infectious and may be the source of human-to-human transmission. Thus, U-SFTSV was closely correlated with the incidence of AKI and could be a novel convenient and noninvasive predictive biomarker for poor outcome of patients with SFTS.
In the current study, the incidence of AKI (24.5%) was lower than that previously reported in hospitals in Anhui Province (35% and 50%, respectively) [25, 30]. The possible reason was that the percentage of severe patients enrolled was relatively lower in our study. Patients diagnosed with AKI had a higher ICU admission rate as well as mortality rate. Because multiple tissue and organ damage is a hallmark of SFTS and the kidney is one of the most important target organs, renal function deterioration often indicates a severe illness condition and has been confirmed to be one of the most important risk factors for the early prediction of adverse outcomes in many studies [19, 30, 31]. Moreover, among the 4 independent risk factors for AKI occurrence, U-SFTSV was the most critical indicator with the highest OR. A high U-SFTSV level was accompanied by abnormal urine protein, and urine blood was also observed in our study. Furthermore, renal parenchymal damage and viral replication were also observed in SFTSV-infected mouse models, which is consistent with previous mouse modeling studies of SFTS-related renal injury [32, 33]; thus, those phenomena might reveal the intrinsic relationship between virus in urine and kidney injury, that is, patients with higher U-SFTSV levels, more active viral replication in the kidney, more serious renal injury, and a higher risk of death, which is consistent with our prognostic analysis results of U-SFTSV. As a result, although we used a large cohort to illustrate this opinion, the mechanism of kidney-virus interplay needs more clinical and experimental research to be elucidated. In addition, the sCr level is one of the important indicators for the diagnosis of AKI. In most patients with SFTS, there is a tendency to have low sCr levels due to sCr rising when renal damage reaches a certain degree, but kidney injury already exists; this point was also mentioned in a previous study [30]. Therefore, U-SFTSV could be considered an auxiliary indicator used for the early identification of kidney injury at a large SFTS medical treatment center, which is conducive to early intervention to improve the prognosis of SFTS.
The case-fatality rate in our cohort was 14.7%, which is approximately consistent with previously reported rates in other regions of China [34, 35]. We found that patients with SFTS who died were older and had a higher incidence of hemorrhage, encephalitis, and kidney damage, which is consistent with a previous multicenter observational study [11]. High viremia in plasma is the most important factor affecting patient outcome [18, 36], and this point was also confirmed by our team [37]. In the current study, we discovered that the U-SFTSV also had a good prognostic prediction value in SFTS patients with high sensitivity and specificity, which has not yet been reported. This great performance is probably due to the origin of U-SFTSV. On the one hand, U-SFTSV is probably from the leakage of blood virus from the kidney, which can be confirmed by the close correlation between U-SFTSV and P-SFTSV in this study. Another is the degree of viral replication in the kidney. U-SFTSV levels on admission cannot only reflect the level of P-SFTSV but also the degree of renal injury in patients with SFTS. Moreover, some SFTS patients have already been severe coagulation dysfunction and hemorrhage signs on admission. In consideration of these, U-SFTSV would be a better choice for those patients to evaluate the severity of disease with its advantages of a noninvasive and convenient sample acquisition, reducing the trauma and pain caused by massive blood draws. In summary, U-SFTSV is a novel comprehensive, noninvasive, and convenient biomarker that can help physicians focus on patients with a high incidence of AKI and a high risk of death. Therefore, for patients with high U-SFTSV levels, the following intervention measures we take early may improve the prognosis of patients: (1) pay close attention to the changes of renal function; (2) avoid using drugs that may cause harm to kidney, for severe cases, they can be transferred to intensive care unit for early renal function support treatment, such as plasma exchange; and (3) for antiviral therapy, treatment with favipiravir may improve the prognosis. Although there is no specific drug for SFTS at present, a randomized controlled trial showed that the mortality rate of SFTS patients treated with favipiravir is significantly lower than that of patients who only received supportive therapy [38].
In addition, we found that the high virus in urine was infectious and may be a potential route of human-to-human transmission. Although direct contact with infected blood was identified as the main mode of human-to-human transmission for SFTS, nonblood contact also occurs [39]. As previous studies report, human-to-human transmission occurs in persons who have direct contact with infected urine [40, 41]. An analysis of 105 SFTS patients with secondary infection demonstrated that direct infected urine contact was also a risk factor for human-to-human transmission [29]. In the current study, we infected Vero E6 cells with the urine of patients and confirmed in vitro that the viruses from urine were infectious. We noted that only 4 urine samples with higher U-SFTSV were infectious. It might be related to the concentration of U-SFTSV. Higher level of U-SFTSV might indicates more viable viruses with greater possibility to infect Vero cells. In contrast, lower level of U-SFTSV might conceivably have lower viral infectivity and even hard to be detected. This study provides a reference for the epidemiological study of SFTS and reminds clinical workers to take protective measures to avoid infection when they are in contact with infected urine.
This study has several limitations. The first is due to the priority in considering the patients’ status and treatment, the insufficient urine, and plasma samples for dynamic analysis. Another possible limitation is that our recruited patients were all from a single center in a tertiary hospital and may not be representative of the overall population. Therefore, although our study is the first to systematically reveal the role of urinary virus in SFTS patients, a multicenter and larger sample size for dynamic analysis to validate the value of U-SFTSV in SFTS patients would be better.
CONCLUSIONS
In conclusion, we found that U-SFTSV is a noninvasive and convenient biomarker for the incidence of AKI and a predictor of fatal outcome of patients with SFTS. Viral detection in urine was recommended for SFTS patients on admission to assess the risk of incidence of AKI and death, and those high-risk patients merit close attention in optimal clinical management to avoid fatal consequences. Furthermore, we should take protective measures against infection when contacting urine.
Patient Consent
Written informed consent was obtained from each patient following the principles of the Declaration of Helsinki. The study was approved by the Research and Ethics Committee of the First Affiliated Hospital of Nanjing Medical University, Nanjing, China.
Ethical Approval Statement
Relevant mouse experiments were approved by the Research and Ethics Committee of the Huadong Medical Institute of Biotechniques, Nanjing, China.
Supplementary Data
Supplementary materials are available at Open Forum Infectious Diseases online. Consisting of data provided by the authors to benefit the reader, the posted materials are not copyedited and are the sole responsibility of the authors, so questions or comments should be addressed to the corresponding author.
Acknowledgments
Author contributions. QZ, JZ, KJ, and JL conceived and designed the study. QZ, JZ, YD, ZJ, TC, and NH identified and collected patient samples and clinical data. QZ, JZ, and TC isolated and preserved the samples and carried out the detection of SFTSV. QZ and JZ performed the relevant mouse experiments and virus infectivity assays. QZ, JZ, YD, and ZJ analyzed all the data and prepared the figures. KJ and JL provided administrative, technical, and material support. KJ and JL supervised the study. QZ wrote the initial manuscript. All authors read and approved the final manuscript for submission.
Financial support. This work was supported by grants from the National Natural Science Foundation of China (81871242).
Potential conflicts of interest. The authors declare that the research was conducted in the absence of any commercial or financial relationships that could be construed as a potential conflict of interest. All authors: No reported conflicts of interest.
References
Author notes
Q.Z. and J.Z. contributed equally to this work contribution.


Comments