


Nontuberculous mycobacteria (NTM) encompass all mycobacteria except for Mycobacterium leprae and Mycobacterium tuberculosis complex. More than 190 NTM species have been identified [1]. NTM are primarily found in soil and water and have been found to cause human disease, with the majority of infections primarily affecting the lungs [2, 3]. The prevalence of pulmonary NTM (PNTM) has been increasing in the United States as well as other countries [4, 5], leading to an increased interest in improving both diagnosis and treatment.
Organisms belonging to the Mycobacterium avium complex (MAC) are the most common cause of PNTM [6, 7]. The diagnostic criteria for pulmonary MAC (PMAC) include a combination of clinical, radiologic, and microbiologic criteria [3, 8]. Treatment of patients with PMAC requires the use of multiple antibiotics for several months [8]. Unfortunately, the cure rate of standard treatment for PMAC is in the range of only 42%–66% [7, 9, 10]. There could be several possible reasons for low cure rates: (1) lack of adherence to treatment because of side effects from drugs and length of treatment [11, 12]; (2) underlying lung diseases, such as chronic obstructive pulmonary disease (COPD) and bronchiectasis [4]; and (3) coinfection—as high as 45% of pulmonary MAC patients have bacterial and/or fungal coinfections [13].
Patients with PMAC may have coinfections with multiple potentially pathogenic organisms [14–16]. Patients with underlying diseases such as cystic fibrosis (CF) and non-CF bronchiectasis are at high risk for serious bacterial and fungal coinfections [17, 18]. In these patients, it has been shown that coinfections will worsen lung function [17]. Underlying lung diseases that predispose patients for bacterial and fungal infections are also risk factors for PMAC [19, 20]. Therefore, it is important to know how other coinfections affect the risk for PMAC or progression of PMAC and vice versa. In vitro, MAC enhances the growth of Aspergillus [21]. In fact, chronic pulmonary aspergillosis in patients with bronchiectasis and MAC infection is a strong predictor of mortality [18]. A similar synergistic interaction is seen between Pseudomonas and Aspergillus [22, 23]. It is not known if coinfections affect treatment outcome or progression of PMAC. We hypothesize that bacterial, mycobacterial, and fungal coinfections may decrease the cure rate of treatment for PMAC. Therefore, this study was conducted with the objective of identifying the impact of bacterial, fungal, and mycobacterial coinfections on clinical presentation and treatment response of PMAC.
METHODS
Study Design
A 10-year retrospective cohort study of patients with NTM who were human immunodeficiency virus (HIV) negative was performed using data collected from 7 vaccine and treatment evaluation units (VTEUs) in the United States. The participating institutions were Saint Louis University, Baylor College of Medicine, Duke University, Emory University, University of Iowa, Kaiser Permanente Washington Health Research Institute, and Vanderbilt University. The study was approved by the institutional review boards of each of the participating VTEU sites.
Study Population and Data Collection
Medical records of patients who were 18 years or older, with a diagnosis of PNTM between 1 January 2005 and 1 July 2015, and with MAC isolated from a respiratory specimen were reviewed. Medical records of patients were excluded if there was a concurrent diagnosis of tuberculosis (determined by molecular tests or culture at the time of NTM diagnosis or during follow-up encounters) or a history of HIV infection.
Patient data were collected through medical review by individuals (physicians, subspecialty training fellows, licensed nurses, and clinical research coordinators) who were trained in protocol-specific data collection. A total of 3896 records were reviewed. Prospective NTM patients were first identified using International Classification of Diseases, Ninth and Tenth Revision codes, and then only patients with NTM culture-positive respiratory specimens were retained. Some of the results from this cohort are published [7]. In this study, the existing data were used for the specific analysis of a subset of patients with PMAC, with comparisons between patients with PMAC only and patients with PMAC and pulmonary coinfection(s).
The data collection forms (DCFs) include sections for initial clinical features, demographics, symptoms at diagnosis and follow-up periods, assessment of changes in symptoms (ie, no change, improved, worsened, or unknown), respiratory culture results with dates and type of specimen, list of NTM isolates and drug susceptibility, radiology findings at diagnosis and changes during follow-up (ie, no change, worsened, new finding, or unknown), MAC treatment record, and treatment outcome. The DCFs for clinical symptoms include cough, hemoptysis, shortness of breath, fever, fatigue, weight loss, chest pain, edema, and others. Results of imaging findings read by radiologists in the corresponding institutes were collected using separate DCFs.
Because one of the American Thoracic Society/Infectious Diseases Society of America criteria for the diagnosis PMAC is the exclusion of other possible causes, the search for alternative causes would promote the diagnosis of coinfections [24]. We defined coinfection as respiratory culture isolation of Staphylococcus aureus, Pseudomonas aeruginosa, Nocardia species, Aspergillus species, or any other potential pulmonary pathogen from the time of diagnosis of PMAC through end of treatment or a 30-month follow-up after diagnosis. A single positive respiratory specimen culture was adequate but to be considered in the coinfection cohort, at the time of the positive culture for the coinfecting pathogen, patients were required to have respiratory symptoms. Thirteen patients were identified as having coinfection based on culture of bronchoalveolar lavage, and the remaining patients with coinfection were identified based on sputum culture results.
Microbiologic cure was defined as 1 or more negative sputum or bronchoalveolar lavage culture without reversion to culture positivity after 1 year of anti-NTM therapy [3, 25]. Clinical cure was defined as patient-reported or objective improvement in symptoms sustained until the end (minimum) of NTM treatment [25, 26].
Statistical Analysis
Continuous data are reported as mean ± standard deviation, and categorical data are reported as frequencies with percentages. Bivariable comparisons were computed using Student t tests or 1-way analysis of variance for continuous variables and χ2 or Fisher exact tests (with the Freeman-Halton extension for variables with ≥3 categories) for categorical variables. P values of < .05 were considered statistically significant. R version 4.1 software was used for all analyses (R Foundation for Statistical Computing, Vienna, Austria). Odds ratios (ORs) were used to measure associations between selected patient factors (ie, comorbidities, symptoms, and imaging findings) and coinfection. Kaplan-Meier survival curves were used to analyze the impact of coinfection on time-to-mortality. The log-rank test was used to assess statistically significant differences between survival curves.
RESULTS
Data from 256 HIV-negative patients with PMAC were used for analysis (Figure 1). The total number includes all patients who were diagnosed with PMAC. A total of 189 of 256 (73.8%) PMAC patients did not have a coinfection, and 67 (26.2%) had at least 1 coinfection. Of the 189 patients with PMAC without coinfection, 130 patients (68.8%) were initiated on MAC treatment and 31 patients (16.4%) were followed without MAC treatment. The median follow-up period was 24.8 months (interquartile range, 15.0–29.7 months). There was an average of 3.3 sputum cultures performed per individual during the entire study period. Of the 67 patients with PMAC and coinfection, 49 (73.1%) were initiated on MAC treatment and 18 (26.9%) were followed without treatment. The mean duration of MAC treatment was 13.7 ± 10 months. Data on treatment of coinfections are not available.
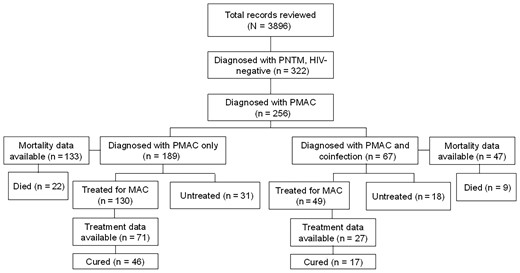
Flowchart of total health records reviewed and number of patients with pulmonary nontuberculous mycobacteria and pulmonary Mycobacterium avium complex (PMAC) with and without coinfection. Among those who were treated for PMAC, 71 without coinfection and 27 with coinfection had treatment outcome data available. Abbreviations: HIV, human immunodeficiency virus; MAC, Mycobacterium avium complex; PMAC, pulmonary Mycobacterium avium complex; PNTM, pulmonary nontuberculous mycobacteria.
Table 1 describes the demographic characteristics of PMAC patients at the time of diagnosis. Among 67 PMAC patients with coinfection, 44 (65.6%) were female and 53 (79.1%) were White. The mean age was 63.7 ± 16.5 years. Among the 67 patients with coinfection, 48 (71.6%) had a bacterial coinfection, 21 (31.3%) had Aspergillus species coinfection, and 7 (10.4%) had a mycobacterial coinfection. Fifty-six of 67 (83.6%) had monomicrobial and 11 of 67 (16.4%) had polymicrobial coinfections. The coinfections with bacteria included Staphylococcus aureus (n = 15) and Pseudomonas aeruginosa (n = 22). Fungal coinfections included only Aspergillus species (n = 13). The coinfections with other mycobacteria included 4 NTM species: Mycobacterium chelonae (n = 3), Mycobacterium abscessus (n = 1), Mycobacterium kansasii (n = 1), and Mycobacterium palustre (n = 1) (Figure 2).
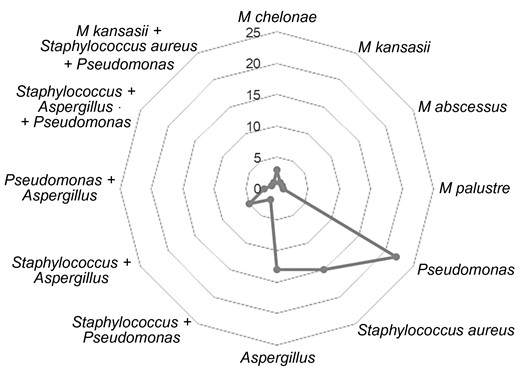
Types of coinfections. Pseudomonas, Staphylococcus aureus, and Aspergillus were the most common coinfections.
Clinical Presentations and Comorbidities at the Time of Diagnosis of Pulmonary Mycobacterium avium Complex With and Without Coinfections
| Characteristic | Total (N = 256) | No Coinfection (n = 189) | Coinfections (n = 67) | P Value |
|---|---|---|---|---|
| Demographics | ||||
| Age, y, mean ± SD | 63.5 ± 15.67 | 63.3 ± 14.80 | 63.7 ± 16.54 | .850 |
| Female sex | 169 (65.85) | 125 (66.1) | 44 (65.6) | 1.000 |
| Race | .918 | |||
| Unknown | 25 (9.77) | 17 (9.0) | 8 (11.9) | |
| Asian | 9 (3.353) | 7 (3.7) | 2 (2.9) | |
| Black/African American | 18 (7.03) | 14 (7.4) | 4 (5.9) | |
| White | 203 (79.30) | 150 (79.4) | 53 (79.1) | |
| Multiple | 1 | 1 (0.5) | 0 (0) | |
| Symptoms | ||||
| Cough | 200 (78.13) | 147 (77.8) | 53 (79.1) | .244 |
| Productive cough | 151 (58.98) | 109 (57.6) | 42 (62.7) | .225 |
| Shortness of breath | 113 (44.14) | 88 (46.6) | 25 (37.3) | .400 |
| Fever | 30 (11.72) | 23 (12.2) | 7 (10.4) | 1.00 |
| Fatigue | 59 (23.05) | 42 (22.2) | 17 (25.4) | .541 |
| Weight loss | 64 (25.00) | 49 (25.9) | 15 (22.4) | .865 |
| Chest pain | 26 (10.16) | 19 (10.1) | 7 (10.4) | 1.000 |
| Underlying lung disease | ||||
| COPD | 69 (26.95) | 60 (31.7) | 9 (13.4) | .006 |
| Cystic fibrosis | 13 (5.08) | 5 (2.6) | 8 (11.9) | .006 |
| Bronchiectasis | 79 (30.86) | 50 (26.5) | 29 (43.3) | .008 |
| Interstitial lung disease | 12 (4.69) | 10 (5.2) | 2 (3.0) | .693 |
| Pulmonary sarcoidosis | 6 (2.34) | 4 (2.1) | 2 (3.0) | 1.000 |
| Autoimmune disease | 31 (12.11) | 26 (13.7) | 5 (7.5) | .276 |
| Other comorbidities | ||||
| Organ transplant | 15 (5.86) | 9 (4.7) | 6 (9.0) | .313 |
| Chronic liver disease | 13 (5.08) | 9 (4.7) | 4 (6.0) | .915 |
| Chronic kidney disease | 9 (3.52) | 5 (2.6) | 4 (6.0) | .354 |
| Congestive heart failure | 8 (3.13) | 8 (4.2) | 0 (0) | .200 |
| Emphysema | 16 (6.25) | 16 (8.4) | 0 (0) | .031 |
| Leukemia | 3 (1.17) | 1 (0.5) | 2 (3.0) | .659 |
| Lymphoma | 2 (0.78) | 2 (1.0) | 0 (0) | .699 |
| Lung cancer | 6 (2.34) | 6 (3.1) | 0 (0) | .111 |
| Imaging results | (n = 203) | (n = 154) | (n = 49) | |
| Infiltrates | 62 (30.54) | 37 (24.0) | 25 (51.0) | <.001 |
| Single nodule | 5 (2.46) | 5 (3.2) | 0 (0) | .456 |
| Multiple nodules | 108 (53.20) | 80 (52.0) | 28 (57.1) | .601 |
| Cavitation | 57 (28.08) | 45 (29.2) | 12 (24.5) | .713 |
| Single-area bronchiectasis | 22 (10.84) | 17 (11.0) | 5 (10.2) | 1.000 |
| Multifocal bronchiectasis | 72 (35.47) | 50 (32.5) | 22 (44.9) | .142 |
| Ground glass opacity | 31 (15.27) | 23 (14.9) | 8 (16.3) | .985 |
| Tree in bud opacities | 67 (33.00) | 49 (31.8) | 18 (36.7) | .691 |
| Scarring | 33 (16.26) | 30 (19.5) | 3 (6.1) | .043 |
| Emphysema | 34 (16.75) | 29 (18.8) | 5 (10.2) | .213 |
| Pleural thickening | 12 (5.91) | 7 (4.6) | 5 (10.2) | .277 |
| Pleural effusion | 6 (2.96) | 4 (2.6) | 2 (4.1) | .965 |
Data are presented as No. (%) unless otherwise indicated.
Abbreviations: COPD, chronic obstructive pulmonary disease; SD, standard deviation.
The most common comorbidities in patients with coinfections were gastroesophageal reflux disease (24/67 [35.8%]), previous PNTM (10/67 [14.9%]), COPD (9/67 [13.4%]), and CF (8/67 [11.9%]) (Table 1). CF was more common in patients with coinfection (2.6% vs 11.9%, P = .006). Similarly, bronchiectasis was more common in patients with coinfection (26.5% vs 43.3%, P = .008). Fifty of 189 (26.5%) PMAC patients without coinfection and 29 of 67 (43.3%) with coinfection had bronchiectasis (P = .008). The clinical presentation as assessed by the presence of cough, shortness of breath, fever, fatigue, weight loss, and chest pain did not differ between those with and those without coinfection.
Chest radiograph (CXR) was used in 54 of 172 (31.4%) patients without coinfection and 22 of 60 (36.7%) patients with coinfections. Computed tomography (CT) scan was used in 118 of 172 (68.6%) and 38 of 60 (63.3%) patients without and with coinfections, respectively. In patients with both CXR and CT, the results of CT were selected.
Comparing PMAC patients with coinfection and without coinfection, infiltrates on imaging studies were more commonly seen in patients with coinfection (24.0% vs 51.0%, P < .001). ORs performed on clinically relevant factors showed similar findings (Table 2). Presence of CF (OR, 5.02, P = .0074), bronchiectasis (OR, 2.52, P = .0043), and imaging findings of infiltrates (OR, 2.36, P = .0046) were associated with coinfection. Supplementary Table 1 shows CXR and CT chest results separately. Imaging findings by types of coinfections are shown in Supplementary Table 2.
Multivariate Analysis of Factors Associated With Coinfection
| Factor | OR | OR Lower | OR Upper | P Value |
|---|---|---|---|---|
| Comorbidities | ||||
| COPD | 0.33 | 0.14 | 0.69 | .0025 |
| Cystic fibrosis | 5.02 | 1.57 | 17.76 | .0074 |
| Bronchiectasis | 2.52 | 1.33 | 4.56 | .0043 |
| Interstitial lung disease | 0.59 | 0.08 | 2.36 | .4875 |
| Pulmonary sarcoidosis | 1.49 | 0.18 | 8.31 | .6745 |
| Autoimmune disease | 0.52 | 0.16 | 1.33 | .1794 |
| Gastroesophageal reflux | 1.27 | 0.68 | 2.34 | .4503 |
| Organ transplant | 2.01 | 0.63 | 5.94 | .2256 |
| Liver disease | 1.31 | 0.33 | 4.29 | .6771 |
| Chronic kidney disease | 2.38 | 0.55 | 9.64 | .2344 |
| CAP | 1.32 | 0.40 | 4.35 | .6519 |
| Leukemia | 3.25 | 0.25 | 107.21 | .3693 |
| Symptoms | ||||
| Cough | 2.13 | 0.77 | 7.71 | .1524 |
| Productive cough | 1.62 | 0.84 | 3.24 | .1498 |
| Shortness of breath | 0.72 | 0.39 | 1.31 | .2766 |
| Fever | 0.90 | 0.33 | 2.13 | .8120 |
| Fatigue | 1.28 | 0.64 | 2.46 | .4774 |
| Weight loss | 0.87 | 0.43 | 1.69 | .6940 |
| Chest pain | 1.09 | 0.40 | 2.67 | .8654 |
| Edema | 0.63 | 0.14 | 2.056 | .4731 |
| Imaging | ||||
| Infiltrates | 2.36 | 1.30 | 4.25 | .0046 |
| Scarring | 0.51 | 0.20 | 1.16 | .1107 |
Abbreviations: CAP, community acquired pneumonia; COPD, chronic obstructive pulmonary disease; OR, odds ratio.
The mean duration of pulmonary MAC was 13.7 months. Treatment details are provided previously [7]. Successful treatment outcome includes microbiologic and/or clinical cure. Among patients with coinfection who had treatment outcome data available, 17 of 27 (63.0%) were cured of PMAC and 9 of 47 (19.9%) died. Among patients without coinfection who had treatment outcome data available, 46 of 71 (64.8%) were cured and 22 of 133 (22%) died. Table 3 shows cure rates in patients with and without coinfection. Only 13 of 30 deaths were directly related to pulmonary MAC. Number of deaths directly related to pulmonary MAC were used for survival analysis (Supplementary Figure 1). There was no survival difference in MAC patients with and without coinfection (P = .78). Outcome analysis by the type of coinfections showed similar results (Supplementary Table 3).
Treatment Outcomes of HIV-Negative Pulmonary Mycobacterium avium Complex Patients With and Without Coinfection
| Cured, No. (%) | |||
|---|---|---|---|
| PMAC Patients | No | Yes | P Value |
| No coinfection | 25 (35.2) | 46 (64.8) | .49 |
| With coinfection | 10 (37.0) | 17 (63.0) | |
| Cured, No. (%) | |||
|---|---|---|---|
| PMAC Patients | No | Yes | P Value |
| No coinfection | 25 (35.2) | 46 (64.8) | .49 |
| With coinfection | 10 (37.0) | 17 (63.0) | |
Abbreviation: PMAC, pulmonary Mycobacterium avium complex.
DISCUSSION
The proportion of PMAC patients with underlying diseases is as high as 87% and therefore, PMAC patients are at high risk of bacterial, fungal, or mycobacterial infections [7]. To our knowledge, this is the first study from the United States comparing treatment outcomes of PMAC in patients with and without coinfections. As described in our previous publication, 85.3% of patients received ≥3 drugs and 11% had 2 drugs for MAC, and an all-oral regimen was provided for 94% of patients for a mean of 13.7 ± 10 months [7]. The cure rate of PMAC patients with or without coinfection in this study is in the previously reported range of 39%–84% [9, 10, 27].
Patients with chronic pulmonary aspergillosis have higher mortality when they develop PNTM [28]. We hypothesized that patients with coinfections would have worse outcomes. However, our results from a multicenter study indicate that coinfections do not affect treatment response for PMAC. In contrast, a small single-center retrospective study that included records of 123 patients in Japan compared outcomes of patients with PNTM (n = 82), pulmonary aspergillosis (n = 41), and NTM/Aspergillus coinfections (n = 9) [16]. Death at 3 years was higher in patients with coinfection (5/9 [56%]) and chronic pulmonary aspergillosis (13/32 [41%]) compared to rates in patients with PNTM without coinfection (10/73 [14%]). A different retrospective study from Japan on 329 patients showed similar results [29]. The survival analysis in our study showed no significant difference between pulmonary MAC patients with and without coinfection. This could be because coinfection in our cohort was not limited to Aspergillus and the number of deaths in both groups was small.
Bacteria and Aspergillus species were the most common causes of coinfections seen in patients with PNTM from Japan, which is similar to our findings [13]. In a study from Japan, 75% of patients with pulmonary MAC who had coinfection had chronic coinfection (ie, pathogen isolated in multiple specimens collected several months apart) and 25% had intermittent coinfection (pathogen isolated from only 1 respiratory specimen). Our study, because we did not rely on multiple respiratory specimens for definition of coinfection, was not able to differentiate intermittent and chronic coinfection. Another retrospective study of 213 patients in Japan with non-MAC pulmonary disease found that 26.0% had multiple NTM species, which is a much higher rate of coinfection with other NTM [15] than seen in our study. The reason why some PMAC patients develop coinfection is not completely clear. However, our study showed that a significantly higher number of patients with coinfection had history of bronchiectasis, suggesting the possibility that bronchiectasis could be one of the predisposing factors for coinfection.
In a single-center study on patients from Korea that included 71 patients with PMAC and M abscessus coinfections, nodular bronchiectasis was the most common imaging finding [30]. In our study, there was only 1 patient who had coinfection with M abscessus, and therefore it is difficult to make comparisons. There are no previous studies that compared imaging findings of PMAC patients with and without bacterial or fungal coinfections. It is interesting to note that imaging findings of patients with and without coinfections were similar except that infiltrates were significantly more common in patients with coinfection and scarring was significantly more common in patients without coinfection. Previous studies have shown that infiltrates or consolidations are seen in 17%–57% of patients with PMAC [31, 32], but our study is the first to make a detailed comparison in imaging findings of PMAC patients with and without coinfections.
Watchful waiting without antibiotic treatment of selected patients with PMAC has been shown to be beneficial. Two studies from South Korea have shown that >50% of patients followed carefully without treatment achieved spontaneous sputum conversion within 5 years [14, 33]. Close follow-up allowed initiation of MAC treatment in those who showed progression of disease [14, 33]. However, it is not clear how many of the patients included in these studies had coinfections. In our study, 16% of PMAC patients without coinfection and 27% of patients with coinfections were followed without treatment for PMAC. In a retrospective study of 51 patients with PNTM where MAC was the predominant pathogen, 26 patients were followed without treatment [34]. In this study, 17 of 25 (68%) of treated and 8 of 26 (30.8%) of those who were followed without treatment had bacterial or Aspergillus coinfection, and Aspergillus coinfection was found to be a predictor for initiation of treatment but was not shown to worsen clinical progression in those who were not treated [34]. More studies are needed to identify characteristics of PMAC patients who may benefit from close follow-up without treatment.
This study has the following limitations: First, as a retrospective study, it was not possible to quantify severity of illness or symptoms in patients, which also limited our ability to make comparisons of patients within each coinfection subgroup. Furthermore, antibiotic regimens were not standardized, which could add an additional level of variability. Second, the sample sizes for the coinfection subgroups were small, limiting the statistical power of the results. Third, it is not known if the presence of a coinfection means active infection or if treatment of coinfections could affect PMAC treatment outcome or progression. Fourth, the timing between pulmonary MAC diagnosis, initiation of MAC treatment, and diagnosis coinfection was not identified. Fifth, detailed microbiologic information was not available.
In summary, this multicenter retrospective study examined 256 patients diagnosed with PMAC and compared clinical presentations and outcomes of those without coinfections (189 patients) and those with coinfections (67 patients). Our results indicate that coinfections may alter radiologic findings but did not affect treatment outcomes of PMAC in this cohort.
Supplementary Data
Supplementary materials are available at Open Forum Infectious Diseases online. Consisting of data provided by the authors to benefit the reader, the posted materials are not copyedited and are the sole responsibility of the authors, so questions or comments should be addressed to the corresponding author.
Notes
Patient consent. This study does not include factors necessitating patient consent. The design of the work has been approved by institutional review boards.
Financial support. This work was supported by the National Institute of Allergy and Infectious Diseases, National Institutes of Health, through grants to the vaccine and treatment evaluation units that participated in this study: Saint Louis University (HHSN272201300021I), Emory University School of Medicine (HHSN272201300018I), University of Iowa (HHSN272201300020I), Baylor College of Medicine (HHSN272201300015I), Duke University School of Medicine (HHSN272201300017I), Vanderbilt University Medical Center (HHSN272201300023I), and Kaiser Permanente Washington Health Research Institute (HHSN272201300019I); and by the Emmes Company (HSN272201500002C).
All authors have submitted the ICMJE Form for Disclosure of Potential Conflicts of Interest. Conflicts that the editors consider relevant to the content of the manuscript have been disclosed.
References
Author notes
Potential conflicts of interest. All authors do not have an association that might pose a conflict of interest.


Comments