


Abstract
Fungal infections are responsible for >1.5 million deaths globally per year, primarily in those with compromised immune function. This is concerning as the number of immunocompromised patients, especially in those without human immunodeficiency virus (HIV), has risen in the past decade. The purpose of this analysis was to provide the current prevalence and impact of fungal disease in the United States.
We analyzed hospital discharge data from the most recent (2018) Healthcare Cost and Utilization Project National Inpatient Sample, and outpatient visit data from the National Ambulatory Medical Care Survey and the National Hospital Ambulatory Medical Care Survey. Costs are presented in 2018 United States (US) dollars.
In the 35.5 million inpatient visits documented in 2018 in the US, approximately 666 235 fungal infections were diagnosed, with an estimated attributable cost of $6.7 billion. Aspergillus, Pneumocystis, and Candida infections accounted for 76.3% of fungal infections diagnosed, and 81.1% of associated costs. Most fungal disease occurred in patients with elevated risk of infection. The visit costs, lengths of stay, and risks of mortality in this population were more than twice that of those without fungal diagnoses. A further 6.6 million fungal infections were diagnosed during outpatient visits.
Fungal disease is a serious clinical concern with substantial healthcare costs and significant increases in morbidity and mortality, particularly among predisposed patients. Increased surveillance, standardized treatment guidelines, and improvement in diagnostics and therapeutics are needed to support the rising numbers of at-risk patients.
Fungal pathogens are responsible for at least 13 million infections and 1.5 million deaths globally per year, primarily in those with some compromised immune function [1]. In these patients, infections can quickly become severe, resulting in high morbidity and mortality. Despite these concerns, fungal infections have often been neglected in public health considerations, and research funding remains substantially lower compared to pathogens with similar mortality [2]. There continue to be deficits in widespread clinical awareness and standardized guidelines for the diagnosis and treatment of fungal disease. Combined with delays in diagnosis due to the nonspecific symptoms of severe disease, fungal infections are chronically underdiagnosed, with a high degree of variability in the prognosis of affected patients [3].
Within the United States (US), fungal infections, including those caused by Pneumocystis jirovecii, have historically been associated with the human immunodeficiency virus (HIV)/AIDS epidemic as AIDS-defining illnesses [4]. As control of HIV/AIDS was substantially increased with the introduction of antiretroviral therapies, the number of associated fungal infections decreased [5]. Despite this decrease, the number of fungal infections has been steadily increasing over the past 10 years in patients without HIV [6], including individuals undergoing drug-induced immunosuppression associated with solid organ and stem cell transplantation [7], cancer treatments [8], and immunomodulators for autoimmune and inflammatory diseases [9–11]. Fungal infections can further complicate chronic conditions and nonfungal infections, reported in patients with asthma [12], cirrhosis [13], chronic obstructive pulmonary disease (COPD) [14], diabetes [15, 16], cystic fibrosis (CF) [17, 18], tuberculosis [19], and influenza [20, 21]. Coinfections with viral pathogens are of particular concern, with Aspergillus and Mucor associated with increased mortality in patients with coronavirus disease 2019 (COVID-19) [22–24]. Even in those who are immunocompetent, endemic mycoses, including Blastomycoses, Coccidioides, and Histoplasma, can cause disease [25].
The burden of fungal disease in the US is difficult to determine as there is no centralized surveillance system. However, administrative databases of patient records can be used to generate a comprehensive estimate that is standardized between states. It has previously been reported that there were nearly 75 000 hospitalizations and a further 8.9 million outpatient visits attributable to fungal infections in 2014, resulting in at least $7.2 billion in healthcare costs [26]. We sought to update the estimated burden of fungal disease in the US, with the addition of morbidity and mortality analyses in patients with known risk conditions. We analyzed hospital discharge data from the 2018 Healthcare Cost and Utilization Project (HCUP) National Inpatient Sample (NIS), and outpatient visit data from the 2016–2018 National Ambulatory Medical Care Survey (NAMCS) and the 2016–2018 National Hospital Ambulatory Medical Care Survey (NHAMCS) to provide an estimate of the prevalence and impact of fungal disease in the US based on the most recent available data, with the consideration of patient populations with elevated risk of infections.
METHODS
Data Sources
We estimated the total number of fungal infection–associated hospitalizations in the US using discharge data from the NIS, HCUP, Agency for Healthcare Research and Quality. The NIS is the largest database of inpatient stays in the US, covering >96% of the population [27]. At time of discharge, the total charges associated with the visit are reported, and these charges are the total amount billed by the hospital, which will differ from what is eventually paid (“costs”) by Medicare/Medicaid/private insurance and patients. To better estimate the actual healthcare costs associated with disease diagnosis, we utilized the cost-to-charge ratio included in the NIS dataset and presented costs here.
In addition, we analyzed the NAMCS and NHAMCS to estimate the average yearly number of fungal disease–associated outpatient visits nationwide. The 2016–2018 NAMCS and NHAMCS datasets were used to increase total visit numbers and improve statistical reliability, as a relatively small number of cases are sampled each year. NAMCS/NHAMCS estimates based on <30 visits are not presented here, and we did not estimate the healthcare costs for these datasets.
Element Descriptions
International Classification of Diseases, 10th Revision (ICD-10) codes (Table 1) were used to identify at-risk patients, based on the literature [7–24, 28, 29] and previous analysis [6], and related fungal disease. For inpatient visits, fungal infection as cause for admittance was defined as a relevant ICD-10 code present in the first position of the patient record while all other analyses sampled for relevant codes in any position on the record. All outpatient data include visits with any fungal disease code listed in any position on the record. Disease severity and mortality risk were defined by the All Patient Refined Diagnosis Related Groups, an inpatient classification system, where these factors are scaled “1” (minor loss of function/likelihood of mortality) to “4” (extreme loss function/likelihood of dying) [30]. Costs include all charges incurred at hospitalization, regardless of payer or insurance type, and are presented in US dollars (USD). ICD-10 codes from the comorbidities defined by the Elixhauser Comorbidity Index [31] were used to briefly evaluate the impact of fungal disease in at-risk patients within the context of comorbid diagnoses. Statistical analyses were performed with SAS version 9.4 (SAS Institute, Cary, North Carolina) and maps were generated with Datawrapper (Berlin, Germany). The disease data included in the maps are presented by region instead of state, to prevent identification of individual patients or hospitals, per HCUP guidelines.
Number of Risk Conditions and Fungal Cases Diagnosed During Inpatient Visits (Healthcare Cost and Utilization Project, 2018), United States
| Infection | ICD-10 Code | Cases Diagnosed |
|---|---|---|
| Fungal infections | ||
| Aspergillosis | B44 | 17 825 |
| Invasive | B44.0, B44.1, B44.7 | 8875 |
| Noninvasive | B44.2, B44.8 | 4210 |
| Candidiasis | B37 | 457 080 |
| Invasive | B37.1, B37.5, B37.6, B37.7 | 19 920 |
| Noninvasive | B37.0, B37.2, B37.3, B37.4, B37.8 | 396 765 |
| Coccidioidomycosis | B38 | 8990 |
| Cryptococcosis | B45 | 4900 |
| Histoplasmosis | B39 | 4880 |
| Mucormycosis | B46 | 1370 |
| Pneumocystosis | B59 | 9725 |
| Other | B35, B36, B40, B411, B42, B43, B47, B48 | 145 925 |
| Unspecified mycoses | B49 | 15 540 |
| Risk conditions (associated with increased risk of fungal disease) | ||
| Asthma | J45–J46 | 2 267 570 |
| Autoimmune conditions | G35, G70, K90, L93, M05, M35 | 464 115 |
| Celiac disease | K90.0 | 42 265 |
| Lupus | L93 | 16 330 |
| Rheumatoid arthritis | M05 | 22 405 |
| Polymyalgia rheumatica | M35 | 156 520 |
| Multiple sclerosis | G35 | 156 320 |
| Myasthenia gravis | G70 | 55 760 |
| Bacteremia | R78.81 | 267 835 |
| Cancer | C00–C97 | 2 784 530 |
| Breast | C50 | 179 955 |
| Colon, rectum, anus | C18–C21 | 259 545 |
| Leukemia | C91–C95 | 267 985 |
| Lung, trachea, bronchus | C33–C34 | 267 985 |
| Non-Hodgkin lymphoma | C82–C85 | 199 065 |
| Ovary, uterus, cervix | C53–C56 | 135 180 |
| Pancreas | C25 | 110 305 |
| Stomach | C16 | 195 190 |
| Prostate | C61 | 41 115 |
| Urinary | C64–C68 | 188 175 |
| COPD | J44 | 4 539 705 |
| Cirrhosis | K74 | 444 205 |
| Cystic fibrosis | E84 | 30 305 |
| Diabetes mellitus | E10–E14 | 8 294 040 |
| End-stage renal disease | N18.6 | 79 350 |
| HIV | B20–B24 | 121 015 |
| Immunosuppressive disorders | D80–D89 | 214 875 |
| Influenza | J09–J11 | 377 950 |
| Myelodysplastic syndrome | D46 | 81 155 |
| Neutropenia | D70 | 196 015 |
| Osteomyelitis | M86 | 368 660 |
| Pneumonia | J12–J18 | 2 560 730 |
| Sepsis | A40–A41 | 2 738 465 |
| Transplant history | Z94 | 263 130 |
| Bone marrow | Z94.81 | 21 760 |
| Heart | Z94.1 | 17 965 |
| Heart and lung | Z94.3 | 235 |
| Kidney | Z94.0 | 118 895 |
| Liver | Z94.4 | 45 035 |
| Lung | Z94.2 | 11 075 |
| Stem cell | Z94.84 | 38 395 |
| Other transplant history | Z94.8 | 72 810 |
| Unspecified transplant history | Z94.9 | 515 |
| Transplant complications | T86 | 129 055 |
| Bone marrow | T86.0 | 2875 |
| Heart | T86.2 | 78 705 |
| Heart and lung | T86.3 | 7250 |
| Kidney | T86.1 | 45 |
| Liver | T86.4 | 12 530 |
| Lung | T86.81 | 9860 |
| Stem cell | T86.5 | 9530 |
| Other transplant complications | T86.8 | 19 835 |
| Unspecified transplant complications | T86.9 | 590 |
| Tuberculosis | A16–A19 | 4180 |
Abbreviations: COPD, chronic obstructive pulmonary disease; HIV, human immunodeficiency virus; ICD-10, International Classification of Diseases, Tenth Revision.
RESULTS
There were 35.5 million hospitalizations in 2018, 17.8 million (50.14%) of which had diagnoses associated with elevated risk of fungal infections (“at-risk”). In the same year, 666 235 (95% confidence interval, 632 923–699 547) fungal infections were diagnosed during inpatient stays with 543 000 diagnoses found in at-risk individuals (81.50%; Table 2). The rates of diagnosis of at-risk conditions, all fungal infections, and noninvasive fungal infections were notably higher in the central and eastern US, while invasive fungal infections were diagnosed at the highest rate in the western US (Figure 1).
Estimated Inpatient Visits (Healthcare Cost and Utilization Project, 2018) and Outpatient Visits (National Ambulatory Medical Care Survey/National Hospital Ambulatory Medical Care Survey, 2016–2018 Yearly Average) for Fungal Disease, United States
| Infection | No. of Inpatient Visits | Associated Mortality in Inpatient Visits | No. of Outpatient Visits With Fungal Diagnosis (95% CI) | ||
|---|---|---|---|---|---|
| Fungi as Primary Cause (95% CI) | Any Fungal Diagnosis (95% CI) | Fungi as Primary Cause (% Related Visits) | Any Fungal Diagnosis (% Related Visits) | ||
| Aspergillosis | 2480 (2356–2604) | 17 825 (16 934–18 716) | 170 (6.95) | 1870 (10.49) | a |
| Invasive | 1545 (1468–1622) | 8785 (8346–9224) | 120 (7.77) | 1110 (12.64) | a |
| Noninvasive | 460 (437–483) | 4210 (4000–4421) | 15 (3.26) | 155 (3.68) | a |
| Candidiasis | 15 890 (15 096–16 685) | 457 080 (434 226–479 934) | 780 (4.91) | 22 530 (4.93) | 1 973 781 (1 579 024–2 368 536) |
| Invasive | 4880 (4636–5124) | 19 920 (18 924–20 916) | 670 (13.73) | 3380 (16.97) | a |
| Noninvasive | 10 905 (10 360–11 450) | 396 765 (376 927–416 603) | 110 (1.01) | 18 105 (4.56) | 1 437 968 (1 150 374–1 725 561) |
| Coccidioidomycosis | 2265 (2152–2378) | 8990 (8541–9440) | 70 (3.09) | 365 (4.06) | a |
| Cryptococcosis | 1280 (1216–1344) | 4900 (4655–5145) | 90 (7.03) | 455 (9.29) | a |
| Histoplasmosis | 735 (698–772) | 4880 (4636–5124) | 25 (3.40) | 215 (4.41) | 2372 (1660–3083) |
| Mucormycosis | 570 (542–599) | 1370 (1302–1439) | 45 (7.89) | 255 (18.61) | a |
| Pneumocystosis | 1275 (1211–1339) | 9725 (9239–10 211) | 160 (12.55) | 1250 (12.85) | a |
| Other | 2630 (2499–2762) | 145 925 (138 629–153 331) | 95 (3.61) | 3270 (2.24) | 4 429 681 (3 543 744–5 315 617) |
| Unspecified mycoses | 2230 (2119–2342) | 15 540 (14 763–16 317) | a | 2350 (15.12) | 162 412 (129 930–194 894) |
| Total | 29 355 (27 887–30 823) | 666 235 (632 923–699 547) | 1440 (4.91) | 32 560 (4.89) | 6 568 245 (5 254 358–7 882 131) |
Abbreviation: CI, confidence interval.
Estimates suppressed in keeping with Healthcare Cost and Utilization Project/National Ambulatory Medical Care Survey/National Hospital Ambulatory Medical Care Survey protocols.
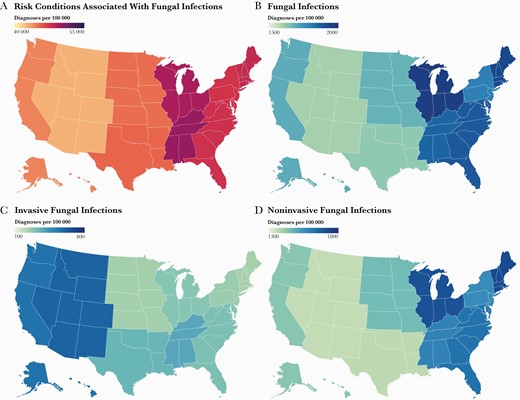
Rate of fungal infections and associated risk condition diagnoses in the United States in 2018. The diagnostic rates per 100 000 inpatient visits of conditions associated with elevated risk of fungal disease (A), all fungal infections (B), invasive fungal infections (C), and noninvasive fungal infections (D). Rates are presented by geographic region.
Prevalence of Fungal Disease in the US
Of the 666 235 fungal infections diagnosed in 2018, 29 335 were listed as the primary cause of hospital admission (4.0%; Table 2), indicating that the bulk of fungal infections are diagnosed secondary to other medical issues. Of the total fungal infections, 135 815 (20.4%) were expected to have a substantial impact on patient cases, listed either as primary diagnosis and/or as an invasive presentation of disease. Most of the remaining infections were accounted for by noninvasive candidiasis at 396 765 (59.6%) diagnoses. More than 32 000 deaths were reported in patients with any fungal diagnosis, and approximately 1440 deaths occurred in patients admitted for fungal infections. Whether any fungal disease was the cause of admittance or listed secondary to another diagnosis, approximately 5% of patients with fungal infections died. The highest mortality was observed in those with diagnoses of mucormycosis (18.6%) and invasive candidiasis (17.0%), followed by pneumocystosis (12.9%) and invasive aspergillosis (12.5%). An additional 6.6 million fungal infections were diagnosed in outpatient visits, with the majority of cases reported as noninvasive candidiasis and dermatophyte infections.
Fungal Disease Costs in Inpatient Visits
While the average cost of an inpatient visit in 2018 was approximately $24 560, the mean visit cost associated with fungal disease diagnosis was more than double that at $55 418 (Table 3). Total healthcare costs reached $1.4 billion for visits where fungal disease was the primary cause of admittance, while the costs of all visits where any fungal infections were diagnosed totaled $37.7 billion. The most expensive infections by visit were mucormycosis, invasive candidiasis, and invasive aspergillosis. The healthcare costs of outpatient visits were not assessed here, given that charges were not included in the outpatient datasets.
Estimated Mean and Total Inpatient Visit Costs (Healthcare Cost and Utilization Project, 2018) for Fungal Disease, United States
| Infection | Mean Cost per Fungal Disease Visit | Total Costa of Fungal Disease Visits | ||
|---|---|---|---|---|
| Fungi as Primary Cause (95% CI) | Any Fungal Diagnosis (95% CI) | Fungi as Primary Cause (95% CI) | Any Fungal Diagnosis (95% CI) | |
| Aspergillosis | 66 105 (62 800–69 410) | 98 033 (93 131–102 934) | 163 940 796 (155 743 756–172 137 836) | 1 747 430 906 (1 660 059 361–1 834 802 452) |
| Invasive | 82 775 (78 636–86 914) | 108 811 (103 371–114 252) | 127 887 346 (121 492 979–134 281 714) | 955 906 163 (908 110 854–1 003 701 471) |
| Noninvasive | 31 362 (29 794–32 930) | 65 907 (62 611–69 202) | 14 426 614 (13 705 284–15 147 945) | 277 466 678 (263 593 344–291 340 012) |
| Candidiasis | 40 424 (38 403–42 445) | 57 158 (54 300–60 015) | 642 334 975 (610 218 226–674 451 724) | 26 125 565 468 (24 819 287 195–27 431 843 742) |
| Invasive | 84 978 (80 729–89 227) | 160 345 (152 328–168 363) | 414 691 141 (393 956 584–435 425 698) | 3 194 080 605 (3 034 376 575–3 353 784 636) |
| Noninvasive | 20 669 (19 636–21 703) | 53 685 (51 001–56 369) | 225 400 476 (214 130 452–236 670 500) | 21 300 382 453 (20 235 363 330–22 365 401 575) |
| Coccidioidomycosis | 53 839 (51 147–56 531) | 58 948 (56 001–61 896) | 121 945 200 (115 847 940–128 042 460) | 529 946 416 (503 449 095–556 443 736) |
| Cryptococcosis | 113 261 (107 598–118 924) | 97 925 (93 028–102 821) | 144 974 607 (137 725 877–152 223 338) | 479 830 280 (455 838 766–503 821 794) |
| Histoplasmosis | 46 565 (44 237–48 894) | 52 115 (49 509–54 720) | 34 924 097 (33 177 892–36 670 302) | 254 318 889 (241 602 945–267 034 833) |
| Mucormycosis | 169 260 (160 797–177 723) | 181 719 (172 633–190 805) | 51 624 441 (49 043 219–54 205 663) | 248 955 197 (236 507 437–261 402 957) |
| Pneumocystosis | 55 900 (53 105–58 695) | 70 632 (67 101–74 164) | 79 936 583 (75 939 754–83 933 412) | 686 899 945 (652 554 948–721 244 942) |
| Other | 47 663 (45 280–50 046) | 38 891 (36 947–40 836) | 203 997 272 (193 797 408–214 197 135) | 5 675 239 705 (5 391 477 720–5 959 001 690) |
| Unspecified mycoses | 31 049 (29 497–32 602) | 122 560 (116 432–128 688) | 17 387 616 (16 518 235–18 256 997) | 1 904 577 381 (1 809 348 512–1 999 806 250) |
| Total cost | 49 731 (47 245–52 218) | 55 418 (52 647–58 189) | 1 461 065 586 (1 388 012 307–1 534 118 865) | 37 652 764 187 (35 770 125 978–39 535 402 397) |
Costs are presented in 2018 United States dollars.
Abbreviation: CI, confidence interval.
Total costs are summed by pathogen without duplication of values included in invasive/noninvasive types.
In the 4-year span from the 2014 HCUP dataset analyzed by Benedict et al [26] to the 2018 data analyzed here, the total direct costs (all primary and invasive infections; adjusted for inflation) of fungal infections in inpatient visits nearly doubled from 3.9 million to 6.7 million USD (Figure 2, Supplementary Table 1). While the number of visits associated with invasive candidiasis, coccidioidomycosis, and mucormycosis increased in 2018 compared to the 2014 analysis, the number of Aspergillus-associated inpatient visits decreased during that span. There were not substantial diagnostic differences noted with other fungal pathogens. Overall, the cost of treating fungal disease increased for all pathogens except Aspergillus.

Changes in fungal disease diagnoses and direct costs between 2014 and 2018. The difference in the number of fungal infections diagnosed during inpatient visits (A) and the direct costs of these visits (B). Abbreviation: USD, United States dollars.
Fungal Infections in At-Risk Patients
As patients considered at risk for fungal infections (Table 1) have comorbidities that could prolong hospital stays and increase costs and mortality, we examined the specific impact of fungal infections within this at-risk cohort (Table 4). At-risk patient hospital stays had a slightly higher average cost at $29 700 compared to those without an associated risk condition diagnosed ($18 590). When fungal infections were also diagnosed in the at-risk population, the average cost doubled to $59 490. The length of stay associated with diagnosed fungal infections also doubled in at-risk patients compared to those without a fungal diagnosis, while the disease severity of the average at-risk patient moved from a categorization of “2” (moderate loss of function) to “3” (major loss of function) in association with all fungal diagnosis except “other.” For cost, length of stay, and disease severity, the greatest increases were associated with invasive candidiasis, mucormycosis, and unspecified mycotic infections. Fungal infections also were associated with increased risk of mortality in patients at elevated risk, as those with invasive candidiasis, invasive aspergillosis, mucormycosis, pneumocystosis, and unspecified mycotic infection had 4–6 times the risk of death compared to at-risk patients without fungal infections. Only “other” fungal infections (including dermatophyte) were not associated with a significantly elevated risk of death.
Impact of Fungal Infections in At-Risk Hospitalizations (Healthcare Cost and Utilization Project, 2018), United States
| Infection | Average Costa of Visit (in $1000) | Average Length of Stay (Days) | Average Disease Severity | Average Mortality Risk | Relative Risk of Mortality (95% CI) | ||||
|---|---|---|---|---|---|---|---|---|---|
| Visits with at-risk diagnosesb | 29.64 | Ratio | 5.36 | Ratio | 2.64 | Ratio | 2.34 | Ratio | |
| Aspergillosis | 101.02 | 3.41 | 13.89 | 2.59 | 3.56 | 1.35 | 3.14 | 1.34 | 3.19 (3.03–3.36) |
| Invasive | 114.08 | 3.85 | 15.49 | 2.89 | 3.70 | 1.39 | 3.30 | 1.41 | 4.14 (3.91–4.37) |
| Noninvasive | 62.51 | 2.11 | 9.59 | 1.79 | 3.11 | 1.17 | 2.59 | 1.10 | 1.20 (1.02–1.40) |
| Candidiasis | 59.82 | 2.02 | 11.71 | 2.18 | 3.28 | 1.24 | 2.90 | 1.24 | 1.86 (1.83–1.88) |
| Invasive | 162.75 | 5.49 | 22.20 | 4.14 | 3.78 | 1.42 | 3.61 | 1.54 | 5.44 (5.27–5.61) |
| Noninvasive | 55.96 | 1.89 | 11.38 | 2.12 | 3.26 | 1.23 | 2.88 | 1.24 | 1.65 (1.63–1.68) |
| Coccidioidomycosis | 62.63 | 2.11 | 8.79 | 1.64 | 3.15 | 1.19 | 2.62 | 1.12 | 1.50 (1.35–1.66) |
| Cryptococcosis | 100.82 | 3.40 | 14.85 | 2.77 | 3.53 | 1.34 | 3.08 | 1.32 | 3.09 (2.82–3.37) |
| Histoplasmosis | 56.75 | 1.91 | 10.06 | 1.89 | 3.27 | 1.24 | 2.89 | 1.24 | 1.56 (1.36–1.78) |
| Mucormycosis | 189.54 | 6.36 | 18.12 | 3.38 | 3.70 | 1.40 | 3.27 | 1.40 | 6.06 (5.42–6.76) |
| Pneumocystosis | 70.75 | 2.37 | 12.32 | 2.30 | 3.55 | 1.34 | 3.15 | 1.35 | 3.94 (3.74–4.15) |
| Other | 43.19 | 1.45 | 9.57 | 1.78 | 2.96 | 1.12 | 2.52 | 1.08 | 0.87 (.84–.90) |
| Unspecified mycoses | 126.88 | 4.26 | 18.90 | 3.52 | 3.75 | 1.42 | 3.23 | 1.38 | 5.13 (4.94–5.34) |
| Total | 59.89 | 1.99 | 11.42 | 2.13 | 3.23 | 1.22 | 2.84 | 1.21 | 1.75 (1.73–1.77) |
Abbreviation: CI, confidence interval.
Costs presented in 2018 United States dollars.
Average measure in at-risk patients (with conditions associated with elevated risk of fungal infections, as defined in Table 1) without fungal infection.
Procedures listed on patient record, such as surgeries or use of central venous catheters, may represent additional conditions associated with increased risk of fungal infection. To investigate the potential impact of surgical procedures on the results, we evaluated average length and cost of stay, as well as risk of mortality with proxy diagnostic codes, including records of surgical aftercare (ICD-10-CM: Z48.2, Z48.3, Z48.8) and catheters (ICD-10-CM: Z45.2, Z49.01). However, these variables had far fewer patient reports than what is expected for these procedures. For example, there were 40 885 records noting any kind of surgical aftercare when recent national estimations put the number of surgical procedures at over 28 million per year [32]. The addition of these variables as risk conditions did not alter the major findings of our analysis, as the average visit cost and length of stay in in at-risk patients still doubled with fungal diagnosis; therefore, we have elected not to include these variables as the analysis may not reflect the entirety of the patient population that underwent relevant procedures.
Patients deemed at low risk of fungal infections due to a lack of associated risk condition on the patient record had far fewer fungal infections diagnosed (123 235 [18.50%]), but the impacts of these infections were at least as severe compared to that of at-risk patients (Figure 3, Supplementary Table 2). Low-risk patients (defined as patients without any listed diagnoses [Table 1] associated with increased risk of fungal infection) diagnosed with pneumocystosis or invasive candidiasis had 15–20 times the risk of mortality compared to those who did not, with any fungal infection doubling their relative risk of death.
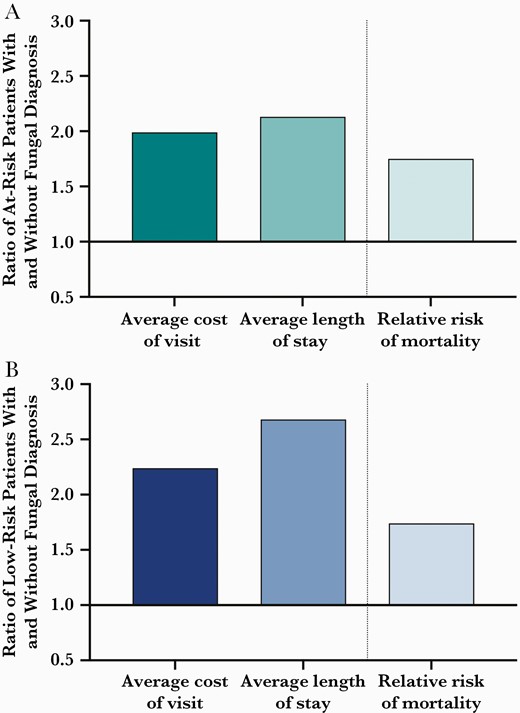
Changes in fungal disease diagnoses and direct costs between 2014 and 2018. The ratio of average cost of inpatient visit, average length of stay, and relative risk of mortality associated with fungal diagnosis in patients with (A) and without (B) diagnosis of risk conditions associated with increased risk of fungal disease.
The role of comorbidities in patient outcome was further explored using the Elixhauser Comorbidity Index (ECI; Supplementary Table 3). Patients were stratified by fungal infection risk status and presence/absence of any ECI comorbidities. As reported above, the presence of a fungal diagnosis doubled, on average, the length and cost of inpatient visit, no matter the comorbidity status. The overall mortality rate was highest in patients at risk of fungal disease with comorbidities, and the relative risk of death with fungal diagnosis was greatest in this population (relative risk, 1.83).
Diagnosis and Mortality Rates of Fungal Infections by Risk Condition
Some risk conditions are associated more closely with certain fungal pathogens than others and the specific impact of these pathogens should be noted. Aspergillus, Candida, and Pneumocystis account for >80% of fungal infections diagnosed in hospitalized patients and the impacts are detailed below. All diagnosis and mortality rates of fungal infections by associated risk condition are found in Supplementary Tables 4 and 5.
Aspergillosis
The highest rate of aspergillosis occurred in hospitalized CF patients and transplant recipients (Table 5). More than 5% of CF patients and 1%–6% of transplant recipients were diagnosed with aspergillosis, with the highest rate among those with lung transplant complications. While infections were less frequent in other at-risk groups, including cancer patients, the associated healthcare impact and mortality was still considerable. In patients with leukemia, lung cancer, and non-Hodgkin lymphoma, an aspergillosis diagnosis was associated with 13%–21% mortality, while 15% mortality was observed among these patients with influenza.
Morbidity and Mortality Risks of Aspergillosis in At-Risk Patients (Healthcare Cost and Utilization Project, 2018), United States
| Diagnosis | Average Cost of Visit (in $1000) | Average Length of Stay (Days) | Infection, No., Rate per 100 000 | Deaths, No., % Infected | Relative Risk of Mortality (95% CI) | Population, No. | ||||
|---|---|---|---|---|---|---|---|---|---|---|
| – | + | Ratio | – | + | Ratio | |||||
| All visits with at-risk diagnoses | 30.43 | 101.02 | 3.41 | 5.53 | 13.40 | 2.59 | 12 030 67.53 | 1240 10.31 | 3.19 (3.03–3.36) | 17 813 520 |
| Cancer | 77.68 | 307.23 | 3.96 | 6.00 | 17.96 | 2.99 | 3190 114.56 | 715 22.41 | 2.91 (2.72–3.11) | 2 784 530 |
| Leukemia | 108.71 | 373.40 | 3.43 | 8.06 | 22.34 | 2.77 | 2205 823.08 | 285 12.93 | 2.46 (2.21–2.74) | 267 895 |
| Lung, trachea, bronchus | 69.18 | 146.82 | 2.12 | 6.00 | 9.86 | 1.64 | 670 169.77 | 110 16.42 | 1.90 (1.60–2.25) | 394 645 |
| Non-Hodgkin lymphoma | 89.38 | 364.86 | 4.08 | 6.54 | 18.87 | 2.89 | 555 278.80 | 115 20.72 | 4.43 (3.75–5.20) | 199 065 |
| Cystic fibrosis | 51.40 | 69.38 | 1.35 | 9.39 | 12.11 | 1.29 | 1800 5939.61 | 20 1.11 | 1.05 (.67–1.63) | 282 645 |
| Influenza | 55.59 | 275.87 | 4.96 | 5.43 | 17.18 | 3.16 | 575 152.14 | 85 14.78 | 4.23 (3.46–5.13) | 377 950 |
| Transplant history | 35.42 | 113.04 | 3.19 | 5.41 | 14.56 | 2.69 | 1170 444.65 | 135 11.54 | 4.82 (4.10–5.63) | 282 645 |
| Bone marrow | 48.39 | 72.19 | 1.49 | 6.83 | 11.97 | 1.75 | 170 781.25 | 40 23.53 | 5.80 (4.35–7.57) | 1005 |
| Kidney | 29.06 | 120.19 | 4.14 | 4.90 | 12.95 | 2.64 | 190 159.80 | 20 10.53 | 5.54 (3.63–8.27) | 118 895 |
| Lung | 36.82 | 63.47 | 1.72 | 5.94 | 14.56 | 2.69 | 205 1851.02 | a | 1.06 (.45–2.44) | 11 075 |
| Stem cell | 54.29 | 153.34 | 2.83 | 6.85 | 17.64 | 2.57 | 390 1015.76 | 60 15.38 | 3.49 (2.74–4.40) | 38 395 |
| Transplant complications | 68.62 | 206.00 | 3.00 | 8.39 | 21.91 | 2.61 | 1350 1046.07 | 205 15.19 | 4.34 (3.81–4.94) | 142 875 |
| Bone marrow | 98.91 | 321.76 | 3.25 | 11.88 | 36.85 | 3.10 | 65 2260.87 | a | 2.76 (1.51–4.77) | 2900 |
| Kidney | 47.33 | 119.94 | 2.53 | 7.01 | 16.11 | 2.30 | 225 285.88 | 40 17.78 | 6.97 (5.21–9.17) | 85 650 |
| Lung | 112.28 | 144.78 | 1.72 | 8.75 | 16.39 | 1.87 | 590 6190.98 | 65 11.02 | 2.37 (1.85–3.02) | 11 325 |
| Stem cell | 133.45 | 303.81 | 2.28 | 16.67 | 29.26 | 1.75 | 325 3296.15 | 70 21.54 | 2.42 (1.94–2.98) | 9860 |
Abbreviation: CI, confidence interval.
Estimates suppressed with Healthcare Cost and Utilization Project protocols.
Candidiasis
Thirteen percent of HIV-positive patients were diagnosed with candidiasis (Table 6). Furthermore, up to 5% of cancer patients, primarily those with leukemia or non-Hodgkin lymphoma, were diagnosed with candidiasis with 12% associated mortality. Patients with immunosuppressive disorders, transplants, or tuberculosis have higher frequency Candida diagnoses, with mortality rates ranging from 6% to 12%. Across these patient populations, the average visit cost, length of stay, and risk of mortality more than doubled with a Candida diagnosis.
Morbidity and Mortality Risks of Candidiasis in At-Risk Patients (Healthcare Cost and Utilization Project, 2018), United States
| Diagnosis | Average Cost of Visit (in $1,000) | Average Length of Stay (Days) | Infection, No., Rate per 100 000 | Deaths, No., % Infected | Relative Risk of Mortality (95% CI) | Population, No. | ||||
|---|---|---|---|---|---|---|---|---|---|---|
| – | + | Ratio | – | + | Ratio | |||||
| All visits with at-risk diagnoses | 29.86 | 59.82 | 2.02 | 5.41 | 11.71 | 2.18 | 346 545 1845.12 | 20 475 5.90 | 1.86 (1.83–1.88) | 17 813 520 |
| Cancer | 76.24 | 135.25 | 1.77 | 5.83 | 12.05 | 2.06 | 64 645 2321.6 | 7835 12.12 | 2.33 (2.28–2.38) | 2 784 530 |
| Leukemia | 106.47 | 227.98 | 2.14 | 7.83 | 17.46 | 2.23 | 9715 3057.2 | 985 10.14 | 2.04 (1.90–2.18) | 267 895 |
| Non-Hodgkin lymphoma | 86.96 | 158.17 | 1.82 | 6.30 | 12.35 | 1.96 | 8930 3945.9 | 820 9.18 | 2.01 (1.89–2.14) | 199 065 |
| Immunosuppressive disorders | 95.61 | 206.23 | 2.16 | 5.84 | 10.91 | 1.87 | 8850 4118.7 | 590 6.67 | 2.12 (1.95–2.30) | 214 875 |
| HIV | 72.16 | 114.94 | 1.59 | 6.12 | 10.94 | 1.79 | 15 855 13 101.68 | 655 4.13 | 1.40 (1.29–1.51) | 121 015 |
| Transplant history | 75.61 | 154.89 | 2.05 | 5.26 | 12.23 | 2.32 | 7090 2694.49 | 425 5.99 | 2.50 (2.27–2.75) | 282 645 |
| Bone marrow | 102.71 | 179.42 | 1.75 | 6.60 | 13.83 | 2.10 | 825 3791.36 | 100 12.12 | 2.99 (2.46–3.62) | 1005 |
| Kidney | 62.20 | 121.36 | 1.95 | 4.79 | 10.53 | 2.20 | 2585 2174.19 | 100 3.87 | 2.03 (1.67–2.47) | 118 895 |
| Lung | 79.19 | 137.51 | 1.74 | 5.73 | 14.26 | 2.49 | 365 3295.71 | 25 6.85 | 3.04 (2.04–4.49) | 11 075 |
| Stem cell | 116.62 | 196.87 | 1.69 | 6.66 | 13.68 | 2.05 | 1675 4362.55 | 185 11.04 | 2.51 (2.17–2.89) | 38 395 |
| Transplant complications | 144.82 | 347.87 | 2.40 | 8.03 | 21.56 | 2.69 | 4750 3680.60 | 425 8.95 | 2.56 (2.33–2.81) | 142 875 |
| Bone marrow | 212.85 | 482.12 | 2.26 | 11.43 | 32.32 | 2.83 | 540 4869.57 | 20 8.95 | 2.56 (1.65–3.88) | 2900 |
| Kidney | 100.57 | 199.01 | 1.98 | 6.83 | 14.38 | 2.11 | 2220 2820.66 | 160 7.21 | 2.83 (2.42–3.30) | 85 650 |
| Lung | 235.25 | 466.80 | 1.98 | 8.27 | 25.14 | 3.04 | 540 5666.32 | 50 9.26 | 1.99 (1.50–2.62) | 11 325 |
| Stem cell | 287.27 | 485.20 | 1.69 | 16.12 | 28.83 | 1.79 | 750 7606.49 | 100 13.33 | 1.50 (1.23–1.81) | 9860 |
| Tuberculosis | 139.06 | 224.16 | 1.61 | 12.83 | 24.79 | 1.93 | 750 8732.1 | 30 8.22 | 1.84 (1.27–2.65) | 214 875 |
Abbreviations: CI, confidence interval; HIV, human immunodeficiency virus.
Pneumocystosis
Pneumocystosis was diagnosed in nearly 5% of all HIV-positive patients, and 7% of patients with this diagnosis died (Table 7). The average costs of visit and length of stay did not substantially increase with fungal diagnosis in HIV patients; however, the risk of mortality in this patient population with a pneumocystosis diagnosis was 2.5 times that of HIV-positive patients without a pneumocystosis diagnosis. Lower frequency infections were observed in patients with cancer, COPD, or influenza; however, in these patients, a pneumocystosis diagnosis was associated with increased mortality compared to the rate among HIV-infected patients with pneumocystosis (15%–40% vs 7% mortality, respectively).
Morbidity and Mortality Risks of Pneumocystosis in At-Risk Patients (Healthcare Cost and Utilization Project, 2018), United States
| Infection | Average Cost of Visit (in $1,000) | Average Length of Stay (Days) | Infection, No., Rate per 100 000 | Deaths, No., % Infected | Relative Risk of Mortality (95% CI) | Population, No. | ||||
|---|---|---|---|---|---|---|---|---|---|---|
| – | + | Ratio | – | + | Ratio | |||||
| All visits with at-risk diagnoses | 30.47 | 70.84 | 2.39 | 5.54 | 12.32 | 2.30 | 9505 53.36 | 1210 12.73 | 3.94 (3.74–4.15) | 17 813 520 |
| Cancer | 77.95 | 196.44 | 2.52 | 6.02 | 14.74 | 2.45 | 1680 60.33 | 480 28.57 | 3.82 (3.54–4.16) | 2 784 530 |
| Leukemia | 110.63 | 274.85 | 2.48 | 8.16 | 18.33 | 2.25 | 415 154.91 | 85 20.48 | 3.92 (3.22–4.71) | 267 895 |
| Lung, trachea, bronchus | 69.25 | 161.30 | 2.33 | 6.00 | 14.36 | 2.39 | 225 57.01 | 85 37.78 | 4.37 (3.67–5.12) | 394 645 |
| Non-Hodgkin lymphoma | 89.85 | 195.98 | 2.18 | 6.55 | 14.44 | 2.20 | 555 278.80 | 100 18.02 | 3.84 (3.21–4.58) | 199 065 |
| COPD | 61.48 | 133.89 | 2.18 | 5.31 | 11.49 | 2.16 | 1310 28.86 | 200 15.26 | 4.38 (3.85–4.97) | 4 539 705 |
| HIV | 34.61 | 58.06 | 1.68 | 9.39 | 12.11 | 1.29 | 5990 4949.80 | 435 7.26 | 2.45 (2.23–2.70) | 121 015 |
| Influenza | 55.86 | 237.64 | 4.25 | 5.44 | 14.10 | 2.59 | 155 41.01 | 45 29.03 | 8.23 (6.41–10.46) | 377 950 |
Abbreviations: CI, confidence interval; COPD, chronic obstructive pulmonary disease; HIV, human immunodeficiency virus.
DISCUSSION
This study provides an analysis of the prevalence and cost of fungal infections in the United States, using data from the 2018 Healthcare Cost and Utilization Project, and is the first to analyze this information in the context of fungal infection risk conditions. We found that there were 16.7 million hospitalizations of patients with comorbidities associated with increased risk of fungal disease that required, on average, more intensive and costly care than patients without comorbidities. However, additional diagnosis of these “at-risk” patients with a fungal infection was associated with doubled visit costs, lengths of hospitalization, and relative risks of mortality.
This is of serious concern, considering that >650 000 fungal infections were diagnosed during inpatient visits in the US in 2018. With an associated cost of $37.7 billion, the costs of the visits associated with these diagnoses accounted for 1.1% of the 3.6 trillion total national health expenditures in 2018 [33]. Fungal infections that were deemed directly responsible for inpatient stay and associated costs totaled $6.6 billion, more than 1.5 times that of the costs reported 4 years prior [26]. Infections with Candida, Aspergillus, Pneumocystis, and Cryptococcus accounted for $5.6 billion (84.5%) of these direct costs. An additional 6.6 million outpatient fungal infections were diagnosed during outpatient visits.
In the 4-year span since 2014 [26], the overall number of fungal infections deemed directly responsible for hospitalization, either listed as cause for admission or as having an invasive presentation of disease, moderately increased. This finding is supported by recent evidence in mortality reporting that the number of “at-risk” patients is on the rise, as are the number of fungal infections [6]. However, the number of Aspergillus infections diagnosed during inpatient visits decreased from 14 820 in 2014 to 9725 in 2018. This decrease may reflect increased physician awareness, improved diagnostic guidelines [3], and increased use of antifungal prophylaxis in transplant recipients [34]. These advances in antifungal prophylaxis appear to have some pathogen- and presentation-specific limitations. Invasive candidiasis cases increased substantially, although the increasing frequency of antifungal resistant- and non-albicans species may play a role [35].
Emerging and endemic fungi, including Mucor, Coccidioides, and Histoplasma, also present substantial risks to those infected. In the risk groups examined here, mucormycosis was associated with 20%–100% mortality in infected patients. Endemic pathogens (Coccidioides, Histoplasma, and Blastomycoses) are notable for their ability to affect relatively healthy patients. However, 95% of the infections reported here were in patients with at least 1 associated risk condition, and mortality was reported in 5%–15% of those infected. This analysis further supports known relationships between risk conditions and fungal pathogens. In patients with influenza, 20% of those additionally diagnosed with invasive aspergillosis or candidiasis died. These findings echo ongoing concerns as secondary fungal infections, including Aspergillus and Mucor, represent high-mortality complications with COVID-19 infection [22, 24].
Transplant recipients and cancer patients represent 2 of the largest and most heavily affected cohorts at risk of fungal disease. We found the most frequent invasive fungal diagnosis made in patients with a history of transplantation in 2018 was aspergillosis, followed by cryptococcosis, pneumocystosis, and then candidiasis. Previously, the Transplant-Associated Infection Surveillance Network (TRANSNET) found invasive candidiasis to be the most frequently diagnosed fungal disease in transplant recipients within the first year of receipt [7]. It is worth noting that the TRANSNET report followed patients through the first year posttransplantation, whereas the HCUP dataset does not specify the length of time from which patients received transplants. As Aspergillus infections have been diagnosed at later timepoints following solid organ transplantation compared to Candida [36], the results presented here may represent the eventual diagnosis totals, rather than those diagnosed within the initial year posttransplantation. Cancer patients were predominately diagnosed with invasive candidiasis, closely followed by invasive aspergillosis in all cancer types except leukemia. Leukemia patients had nearly twice the rate of invasive Aspergillus diagnoses compared to Candida. While both pathogens have previously reported as the primary culprits in a fungal diagnosis, there has been historical skewing toward candidiasis [37].
While some risk groups have lower frequencies of fungal infections than transplant recipients or cancer patients (autoimmune disorders, COPD, cirrhosis, and diabetes; Supplementary Tables 4 and 5), these infections have a significant impact on patient outcome. For example, only 3%–6% of these patients were diagnosed with any fungal infection; however, the associated mortality with invasive aspergillosis, candidiasis, and pneumocystosis ranged from 11% to 32%. Furthermore, in patients without any diagnosed risk conditions, fungal infections were associated with a substantial increase in length of stay, cost of stay, and risk of mortality. Despite these infections being diagnosed at a quarter of the rate of those in at-risk patients, the impacts of these infections are at least as severe. It is possible that some of these “low-risk” patients may have an associated risk condition not listed on their patient record, or a procedure or need for intensive care that could not be appreciated in this dataset. However, these results highlight the serious impacts of invasive fungal infections even in nontraditional patient cohorts. Finally, both at-risk and low-risk patient cohorts had doubled lengths and costs of stay associated with fungal diagnosis, regardless of the presence of additional comorbidities. The role of specific comorbidities in patient morbidity and mortality with fungal diagnosis represents an area for future study.
There are limitations to this analysis. The true burden of fungal disease in the US, including associated healthcare costs and mortality, is likely greater than the estimates presented here. Previous studies found that only half of invasive fungal infections are diagnosed before death [38]. The HCUP and NAMCS/NHAMCS databases are among best ways to assess the prevalence of certain diseases in the US; however, unique patients cannot be identified and, therefore, our analysis captures the prevalence of infection instead of the incidence. Average costs, as well as related mortality rates, are likely underestimated as multiple visits may be associated with a single patient. Due to the outpatient survey design, NAMCS/NHAMCS may underestimate the number of fungal infections as diagnoses requiring laboratory tests might not be captured in the data reported from the day of visit. The 2014 HCUP NIS dataset analyzed by Benedict et al utilized the ICD-9-CM reporting system, while the 2018 dataset presented here utilized ICD-10-CM. While some discrepancies between these 2 systems have been found with chronic conditions [39], the small increase in the number of reported fungal infections between 2014 and 2018 fit with previous mortality analysis showing an increasing trend in the number of fungal infections [6]. Additionally, all datasets had many “unspecified mycoses” with high associated costs and mortalities, indicating a need for more stringent diagnostic testing. Finally, this analysis focused on clinical diagnoses made in the patient record and did not incorporate procedures, such as surgeries or use of central venous catheters, that have been associated with increased risk of fungal infection. However, all diagnosed fungal infections were captured with the described analytic parameters and 89.7% of invasive cases are found on records with at least 1 of the risk conditions found in Table 1.
In conclusion, we present the current prevalence and impact of fungal disease in the US. Fungal infections are responsible for considerable morbidity and mortality in hundreds of thousands of at-risk patients, with substantial direct and associated healthcare costs that have increased in recent years. While some advances have been made in prevention and treatment of fungal disease, the continued rise in the number of infections highlights an ongoing need for standardized prophylaxis and treatment guidelines, as well as improvement in diagnostic, prophylactic, and treatment options.
Notes
Financial support. This work was supported by the National Institutes of Health (grant number 1R01 AI148365-01A1 to K. A. N.); the Georgia Research Alliance (to K. A. N.); and the University of Georgia Research Foundation.
Potential conflicts of interest. The authors: No reported conflicts of interest.
Both authors have submitted the ICMJE Form for Disclosure of Potential Conflicts of Interest. Conflicts that the editors consider relevant to the content of the manuscript have been disclosed.


Comments