


Abstract
Despite vaccine-induced decreases in US rotavirus (RV) disease, acute gastroenteritis (AGE) remains relatively common. We evaluated AGE pathogen distribution in hospitalized US children in the post–RV vaccine era.
From December 2011 to June 2016, the New Vaccine Surveillance Network (NVSN) conducted prospective, active, population-based surveillance in hospitalized children with AGE. We tested stools from 2 NVSN sites (Kansas City, Houston) with Luminex x-TAG Gastrointestinal Pathogen Panels (Luminex GPP) and analyzed selected signs and symptoms.
For 660 pediatric AGE inpatients and 624 age-matched healthy controls (HCs), overall organism detection was 51.2% and 20.6%, respectively (P < .001). Among AGE subjects, GPP polymerase chain reaction detected >1 virus in 39% and >1 bacterium in 14% of specimens. Detection frequencies for AGE subjects vs HCs were norovirus (NoV) 18.5% vs 6.6%, RV 16.1% vs 9.8%, adenovirus 7.7% vs 1.4%, Shigella 4.8% vs 1.0%, Salmonella 3.1% vs 0.1%, and Clostridioides difficile in ≥2-year-olds 4.4% vs 2.4%. More co-detections occurred among AGE patients (37/660, 5.6%) than HCs (14/624, 2.2%; P = .0024). Per logistic regression analysis, ill contacts increased risk for NoV, RV, and Shigella (P < .001). More vomiting episodes occurred with NoV and RV, and more diarrheal episodes with Shigella and Salmonella. Modified Vesikari scores were highest for Shigella and lowest for C. difficile.
NoV detection was most frequent; however, RV remained important in hospitalized AGE in the post–RV vaccine era. Continued active surveillance is important to document ongoing vaccine effects, pathogen emergence, and baseline disease burden for new vaccines.
Annually, 3–5 billion episodes of acute gastroenteritis (AGE) cause ~500000 deaths worldwide in children <5 years old [1, 2]. In the United States, >1.5 million outpatient AGE visits, 200000 hospitalizations, and ~300 deaths cost $1 billion annually [3]. Before the release of the rotavirus (RV) vaccine, RV caused 40%–50% of diarrhea-related US hospitalizations [4], but RV disease decreased 31%–55% after the release of the RV vaccine [5].
Recently, norovirus (NoV) has emerged as the leading detectable cause of AGE in children <5 years old [6–10], particularly in outpatients [6]. Other causes include adenovirus, astrovirus, and sapovirus [7–10], Shigella spp., Salmonella spp., Clostridioides difficile, Campylobacter spp., Yersinia spp., Vibrio spp., and toxin-producing E. coli [11–13]. Less commonly, parasites, for example, Giardia and Cryptosporidium, cause pediatric AGE [12].
Despite increased understanding of US AGE epidemiology from multiplex polymerase chain reaction (PCR) data [8, 14], information gaps persist. Indeed, commercial multiplex PCR testing may detect organisms unrelated to current AGE; for example, in <2-year-old children, C. difficile is typically not pathogenic [15]. Similarly, some assays’ cross-reactivity produces false positives. In low- and middle-income countries, multiplex molecular testing shows continued dominance of bacterial pathogens and RV in both inpatients and outpatients [16]. Understanding the importance of viral vs bacterial pathogens also remains important in US pediatric AGE surveillance.
Formed in 1999, the New Vaccine Surveillance Network (NVSN) conducts active, prospective, population-based surveillance at 7 US medical institutions. NVSN monitors RV vaccine effectiveness by systematically collecting clinical, epidemiologic, and laboratory-confirmed pathogen data from enrolled children with AGE and age-matched healthy controls (HCs).
The aim of this 2-site NVSN substudy was to use a sensitive molecular multiplex gastrointestinal pathogen panel (GPP) to longitudinally evaluate AGE epidemiology in hospitalized children compared with age-matched HCs during 5 consecutive post–RV vaccine years (2011–2016).
METHODS
Enrolled inpatients were age 14 days–11 years and were diagnosed with NVSN protocol–defined AGE [6] between December 2011 and June 2016 (Texas Children’s Hospital, Houston, TX, USA, and Children’s Mercy Kansas City, MO, USA—the 2 sites that used the identical Luminex GPP assay [Luminex Corp, Austin, TX, USA]). Surveillance was year-round (September through August), except the initial 2011/2012 season, which started in December 2011. Detailed methods and NVSN scope were previously described [6, 17]. Briefly, AGE was defined as ≥3 diarrhea episodes within 24 hours, ≥1 vomiting episode within 24 hours, or both; symptoms were present for <10 days. HCs were systematically enrolled at each site’s general pediatric outpatient clinic(s) and matched to enrolled AGE subjects based on age group during a scheduled well-visit that occurred within 14 days of AGE subjects’ enrollment. HCs had no history of AGE for 14 days before enrollment. AGE stools were collected within 10 days of symptom onset, and HC stools within 5 days of enrollment. HC stools were refrigerated after collection until they could be transported to each site’s laboratory within 24 hours of collection for immediate processing and freezing of aliquots at –80°C. This is the same process used for routine clinical specimens for inpatients. Families provided demographic, epidemiologic, and clinical data.
Children were enrolled via written informed consent from a parent or legal guardian. This study was reviewed and approved by the institutional review board (IRB) of both sites (Children’s Mercy–Kansas City IRB and the Baylor College of Medicine’s IRB) and of the Centers for Disease Control and Prevention (CDC).
Stools were stored at 80°C until total nucleic acid (TNA) extraction with an automated EasyMag extraction system (bioMerieux, Durham, NC, USA) [7]. Samples were tested via Luminex GPP assay (Luminex Corp, Austin, TX, USA) with positive and negative controls, per the manufacturer’s instructions [7]. Targets included viruses (RV, NoV, and adenovirus), bacteria (C. difficile, Shigella, Salmonella, Campylobacter, E. coli O157, enterotoxigenic E. coli [ETEC], Shiga-like toxin–producing E. coli [STEC], Vibrio cholera, and Yersinia), and parasites (Cryptosporidium, Giardia, and Entamoeba histolytica). NoV was genotyped as previously reported [6, 7].
Initially invalid results were repeated. If both were invalid, results were considered indeterminate. Prior publications [18, 19] and manufacturer notes have documented false-positive detections of Salmonella, E. histolytica, Giardia, and Cryptosporidium by multiplex Luminex GPP assay; hence detection of these 3 organisms led to secondary confirmation by a second assay, for example, Progastro SSSC assay or R-Pharm parasitic assay (R-Biopharm, Washington, MO, USA). Both confirmation assays were conducted per manufacturers’ instructions. If the organism detected by multiplex assay was not confirmed by repeat testing with the confirmatory assay, that sample was recategorized as no organism detected. In addition, C. difficile detections in children <2 years were also categorized as no organism detected because of uncertainty in whether C. difficile played a role in AGE symptoms at <2 years old. Samples with ≥2 detected organisms were considered co-detections.
Modified Vesikari score (MVS) calculations used a preestablished 20-point Vesikari scoring system [20, 21], with the World Health Organization Integrated Management of Childhood Illness (IMCI) dehydration criteria assessed at enrollment [20]. For this study, receipt of any dose of vaccine, but less than a complete schedule, was considered partially immunized. A complete schedule was defined as 3 doses of any vaccine or combination of vaccines, or 2 doses of monovalent vaccine.
Statistics
Patient demographics (age group, gender, race/ethnicity) and potential risk factors for AGE (eg, current day care >4h/wk, exposure to AGE in prior week, number of persons in household) were compared across pathogens by group (AGE vs HCs). Among AGE subjects, selected clinical symptoms (eg, maximum fever, any diarrhea, number of vomiting episodes) were analyzed by pathogen.
Pearson’s chi-square test was used to compare categorical distributions, while the Kruskal-Wallis test was employed for continuous outcomes. Unadjusted logistic and quantile regression models compared risk factors and clinical presentations for each organism compared with the no organism detected (negative) group. MVS scores were analyzed as a continuous variable in an unadjusted general linear model comparing the MVS across pathogens. All analyses were completed using Stata (StataCorp, LLC, College Station, TX, USA).
RESULTS
Subjects and Samples
Overall, similar numbers of subjects and stools were analyzed from Houston and Kansas City. Of 756 stools from AGE subjects, 660 had sufficient volume for complete testing, as did 624 stools from age-matched HCs (Figure 1). No differences were observed in sex or Hispanic ethnicity among AGE and HC subjects (Table 1). The majority of AGE subjects were White (71%). HCs were more likely to be Black (30%) compared with AGE subjects (14%; P < .001). Subjects from Houston were more likely Hispanic (52.6%) than those from Kansas City (17.1%; P < .001); Kansas City subjects were more likely to be Black (33.3%) than Houston subjects (9.1%; P < .001).
Overall Pediatric Patient Demography From Kansas City and Houston
| AGE Inpatients (n = 660), No. (%) | Healthy Controls (n = 624), No. (%) | Total (n = 1284), No. (%) | P Valuea | ||
|---|---|---|---|---|---|
| Age | .67 | ||||
| <6 mo | 146 (22.1) | 141 (22.6) | 287 (22.4) | ||
| 6–11 mo | 102 (15.5) | 108 (17.3) | 210 (16.4) | ||
| 12–23 mo | 125 (18.9) | 127 (20.4) | 252 (19.6) | ||
| 24–59 mo | 171 (25.9) | 153 (24.5) | 324 (25.2) | ||
| 60+ mo | 116 (17.6) | 95 (15.2) | 211 (16.4) | ||
| Gender | .086 | ||||
| Male | 369 (55.9) | 319 (51.1) | 688 (53.6) | ||
| Female | 291 (44.1) | 305 (48.9) | 596 (46.4) | ||
| Ethnicity | .082 | ||||
| Non-Hispanic | 411 (62.3) | 421 (67.5) | 832 (64.8) | ||
| Hispanic | 249 (37.7) | 202 (32.4) | 451 (35.1) | ||
| Unknown | 0 (0.0) | 1 (0.2) | 1 (0.1) | ||
| Race | <.0001 | ||||
| White | 468 (70.9) | 340 (54.5) | 808 (62.9) | ||
| Black | 89 (13.5) | 190 (30.4) | 279 (21.7) | ||
| Asian | 18 (2.7) | 25 (4.0) | 43 (3.3) | ||
| Other race | 6 (0.9) | 4 (0.6) | 10 (0.8) | ||
| Multiracial | 42 (6.4) | 36 (5.8) | 78 (6.1) | ||
| Unknown/refused | 37 (5.6) | 29 (4.6) | 66 (5.1) |
Among acute gastroenteritis inpatients (n = 660), Houston provided 300 (45.45%) while KC had 360 (54.55%). Among HCs (n = 624), Houston provided 336 (53.85%) while KC had 288 (46.15%). Pearson’s P value was .003.
Abbreviations: AGE, acute gastroenteritis; HCs, healthy controls; KC, Kansas City.
Pearson’s chi-square.
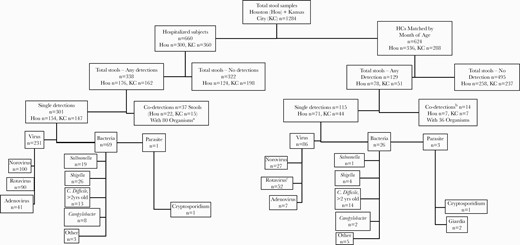
Sample distribution and detected organisms in pediatric inpatients with AGE and outpatient HCs from 2011 to 2016 in Kansas City, Missouri, and Houston, Texas. aCo-detections in hospitalized AGE subjects = 22 norovirus, 16 rotavirus, 10 adenovirus, 16 C. difficile, 2 Salmonella, 6 Shigella, 1 Campylobacter, 5 other bacteria, 2 Giardia.bCo-detections in healthy controls = 14 norovirus, 9 rotavirus, 2 adenovirus, 1 C. difficile, 2 Shigella, 2 Campylobacter, 5 other bacteria, 1 Giardia.cFifty-one of 52 HCs were EIA negative, and 50/52 were EIA negative within 7 days of RV vaccination. Abbreviations: AGE, acute gastroenteritis; EIA, enzyme immunoassay; HCs, healthy controls; RV, rotavirus.
Overall Detection
A total of 179 <2-year-olds (14% of total) had a C. difficile detection reclassified as negative—less among AGE (n = 62, 9%) than among HCs (n = 117, 19%). Detections for 73/94 Salmonella, 62/62 E. histolytica, 12/14 Cryptosporidium, and 15/30 Giardia were categorized as false positive because confirmatory tests were negative, and were thus reclassified as no organism detected (Supplementary Table 1).
After these reclassifications, no organism was detected in 817/1284 (63.6%) samples overall: 322/660 AGE patients (48.7%) and 495/624 HCs (79.3%; P < .0001) (Table 2, Figure 1). Among test-positive stools, co-detections occurred in 10.9% (51/467), 37/338 AGE and 14/129 HCs.
Summary of Pathogen Detection in Children by Subject Type and Site (n = 1284)
| Acute Gastroenteritis Subjects | Healthy Controls | |||||||
|---|---|---|---|---|---|---|---|---|
| Houston (n = 300) | Kansas City (n = 360) | Houston (n = 336) | Kansas City (n = 288) | |||||
| No. | Column % | No. | Column % | No. | Column % | No. | Column % | |
| No organism detected | 124 | 41.3 | 198 | 55.0 | 258 | 76.8 | 237 | 82.3 |
| Norovirus | 50 | 16.7 | 50 | 13.9 | 16 | 4.8 | 11 | 3.8 |
| Rotavirus, total | 32 | 10.7 | 58 | 16.1 | 31 | 9.2a | 21 | 7.3a |
| Rotavirus excluding detections <1wk postvaccine | 28 | 9.3 | 58 | 16.1 | 1 | 0.3 | 3 | 0.1 |
| Adenovirus | 27 | 9.0 | 14 | 3.9 | 6 | 1.8 | 1 | 0.3 |
| Salmonella | 13 | 4.3 | 6 | 1.7 | 1 | 0.3 | 0 | 0.0 |
| Shigella | 19 | 6.3 | 7 | 1.9 | 1 | 0.3 | 3 | 1.0 |
| Campylobacter | 8 | 2.6 | 1 | 0.3 | 1 | 0.3 | 2 | 0.5 |
| C. difficile | 5 | 1.7 | 8 | 2.2 | 9 | 2.7 | 5 | 1.7 |
| Other bacteria | 7 | 2.3 | 4 | 1.1 | 4 | 1.2 | 3 | 1.0 |
| Cryptosporidium | 1 | 0.3 | 0 | 0.0 | 1 | 0.3 | 0 | 0.0 |
| Giardia | 0 | 0.0 | 0 | 0.0 | 2 | 0.6 | 0 | 0.0 |
| Codetection | 22 | 7.3 | 15 | 4.2 | 7 | 2.1 | 7 | 2.4 |
| Total | 300 | 360 | 336 | 288 | ||||
Abbreviation: EIA, enzyme immunoassay.
51/52 were rotavirus EIA negative.
Among test-positive samples, viruses were detected overall twice as frequently (77.9%, n = 364/467) as bacteria (34.0%, 160/467; P < .0001), viruses being the most frequent in test-positive AGE subjects (78.1%, 264/338) and test-positive HCs (77.3%, 99/128). Bacterial detection in AGE patients was similar to that in HCs (28.1%, 95/338, vs 23.4%, 30/128; P = .310).
Specific Organism Detection
Among 1284 samples, RV was detected in 167 (106 AGE and 52 HCs). Among the 52 RV PCR-positive HCs, 92.0% were <6 months old and 51 had been RV enzyme immunoassay (EIA) negative. NoV (n = 163: 122 AGE and 41 HCs) was detected more frequently than adenovirus (n = 60: 51 AGE and 9 HCs). GII was the most prevalent NoV genogroup (n = 136/163, 83.4%).
Among 660 AGE samples, the rate of no organism detected was higher for Kansas City than Houston (55% vs 41.3%, respectively). Among 624 HCs, no differences between Kansas City and Houston samples were noted for those with no pathogen detected.
A confirmed bacterium was detected in 125/1284 (9.7%) samples (Figure 1). Most Salmonella (21/22) and Shigella (32/38) detections were in AGE stools; 21/32 Shigella-positive samples were from Houston. Campylobacter was detected in 12/1284 samples, 9 in AGE patients and 3 in HCs. Other bacteria were detected in 8/660 AGE and 10/624 HC samples. Parasites were confirmed in only 4/1284, 1 AGE and 3 HCs (Figure 1).
There were 51 (4%) co-detections: 37/660 (5.6%) in AGE and 14/624 (2.2%) HCs (P = .0024). The 29 Houston and 22 Kansas City co-detections contained 73 viruses, 40 bacteria, and 3 parasites (Supplementary Table 2).
Risk Factors
Compared with the no organism detected (negative) AGE group, no differences were seen across the overall group for any pathogen detected as to household size, proportions reporting ever breastfeeding, or foreign visitor contact within 7 days. History of contact with a person with AGE symptoms within 7 days, either inside or outside the household (Table 3), was more frequent for the overall AGE group with any detected pathogen (P < .0001 for each) than for the negative AGE group. Indeed, among 394 subjects with a detected pathogen, 146 sick contacts (57 outside and 89 inside the household) were noted. Day care or school attendance was more likely among those with any pathogen detected (P = .017). Foreign travel more frequently occurred among Shigella subjects (P = .003).
Risk Factors for Pediatric AGE Subjects With a Single Major Pathogen Detection Compared With AGE Plus HC Children With No Pathogen Detected (Only the Major Pathogen Groupings, Which Represent 94.3% of Pathogens)
| Norovirus | Rotavirusa | Adenovirus | C. difficile | Shigella | Salmonella | No Organism Detected | |
|---|---|---|---|---|---|---|---|
| (n = 127) | (n = 90) | (n = 48) | (n = 27) | (n = 30) | (n = 20) | (n = 817) | |
| Breastfeeding (ever) | 102 (80.3) | 70 (77.8) | 37 (77.1) | 18 (66.7) | 20 (66.7) | 18 (90.0) | 665 (81.4) |
| Attend day care currently >4h/wk | 32 (25.2) | 34 (37.8) | 17 (35.4) | 14 (51.9) | 15 (50.0) | 5 (25.0) | 254 (31.1) |
| Sick contact outside household | 23 (18.1)∗∗ | 19 (21.1)∗∗ | 6 (12.5) | 2 (7.4) | 4 (13.3) | 2 (10.0) | 48 (5.9) |
| Sick contact inside household | 41 (32.3)∗∗∗ | 25 (27.8)∗∗ | 8 (16.7) | 3 (11.1) | 5 (16.7) | 4 (20.0) | 84 (10.3) |
| Foreign travel | 2 (2.0) | 1 (1.2) | 0 (0.0) | 0 (0.0) | 3 (11.5) | 0 (0.0) | 3 (0.9) |
| Contact with foreign visitor | 5 (5.0) | 5 (5.8) | 1 (2.4) | 1 (7.7) | 4 (15.4) | 1 (5.3) | 18 (5.6) |
| Household income | |||||||
| ≤$25000 | 47 (37.0) | 32 (35.6) | 16 (33.3) | 6 (22.2) | 6 (20.0) | 7 (35.0) | 272 (33.3) |
| $25001–$50000 | 23 (18.1) | 17 (18.9) | 9 (18.8) | 4 (14.8) | 12 (40.0)∗ | 3 (15.0) | 125 (15.3) |
| $50001–$100000 | 25 (19.7) | 13 (14.4) | 10 (20.8) | 1 (3.7) | 5 (16.7) | 6 (30.0) | 98 (12.0) |
| >$100000 | 11 (8.7) | 18 (20.0) | 4 (8.3) | 6 (22.2) | 2 (6.7) | 3 (15.0) | 126 (15.4) |
| Unknown/refused | 21 (16.5) | 10 (11.1)∗∗ | 9 (18.8) | 10 (37.0) | 5 (16.7) | 1 (5.0)∗∗ | 196 (24.0) |
| Total household members | 4 [3–6] | 4 [4–5] | 4 [4–5] | 5 [3–5] | 4 [4–5] | 4 [3–6] | 4 [3–5] |
Data are presented as No. (%) or median [IQR]. Sick contacts were within 1 week before enrollment. Table 3 contains only the major pathogen groupings, which represent 94.3% of the entire sample.
Abbreviations: AGE, acute gastroenteritis; HCs, healthy controls; IQR, interquartile range; RV, rotavirus.
P < .05; ∗∗P < .01; ∗∗∗P < .001; reference group: no detections.
Rotavirus (excluding detections <1 week post–RV vaccine).
The frequency among AGE subjects was also compared for each pathogen with that of the reference negative AGE group in an unadjusted logistic model. The likelihood of each specific organism detected was not affected by having ever breastfed, foreign visitor contact, or household size. Day care or school attendance was more likely among Shigella (50.0%) and C. difficile (51.9%) subjects (P = .033 and P = .027, respectively). NoV (18.1%: P < .001) and RV (14.1%; P < .001) were detected more frequently in children with a known sick contact both outside the household and inside the household (NoV: 32.3%; P < .001; RV: 19.7%; P = .001).
Analyzing only AGE subjects, RV test–positive rates were lower in partially (11.4%, 15/132) and fully RV-vaccinated (10.8%, 33/305) subjects compared with unvaccinated subjects (26%, 58/223; P < .0001 overall). Excluding 17 AGE subjects who received RV vaccine within 14 days before specimen collection revealed similar RV-positive rates (10.4% in partially vaccinated, 9.8% in fully vaccinated, and 26% in unvaccinated).
Analyzing only HCs, RV positivity was 0/78 (0%) for the unvaccinated, 41/131 (31.1%) for the partially vaccinated, and 20/414 (4.8%) for the completely vaccinated (P < .0001); excluding HCs who had received RV vaccine within the prior 7 days, RV positivity was 0/78 (0%) in the unvaccinated, 2/348 (0.6%) in the partially vaccinated, and 2/51 (3.9%) in the fully vaccinated. Further, more RV-positive HCs had received RV vaccine within the prior 7 days (48/52, 92%) than RV-positive AGE subjects (7/90, 7.8%).
Among AGE subjects, NoV (18.0%), RV (12.0%), and adenovirus (8.0%) were the most common detections in <2-year-olds; RV detection was highest among 2–5-year-olds (18%) (Table 4). Among HCs, RV PCR detection was exclusively in subjects <9 months old; as noted above, 92% of HCs with RV detections had received the RV vaccine within 7 days of stool collection, and 51/52 had been RV EIA negative. Shigella detection (n = 37) increased in older AGE groups, from 0.5% in subjects <24 months of age to >10.0% in subjects >5 years old.
Pathogen Distribution in Children Hospitalized for Acute Gastroenteritis vs Healthy Controls by Age Group
| <24 Months | 24–59 Months | 60+ Months | ||||
|---|---|---|---|---|---|---|
| AGE Inpatient, No. (%) | Healthy Controls, No. (%) | AGE Inpatient, No. (%) | Healthy Controls, No. (%) | AGE Inpatient, No. (%) | Healthy Controls, No. (%) | |
| n = 372 | n = 375 | n = 171 | n = 153 | n = 116 | n = 95 | |
| No organism detected | 192 (51.5) | 283 (75.3) | 68 (39.8) | 128 (83.7) | 62 (53.4) | 84 (88.4) |
| Norovirus | 72 (19.3) | 23 (6.1) | 14 (8.2) | 3 (2.0) | 14 (12.1) | 1 (1.1) |
| Rotavirus, total | 48 (12.9) | 50 (13.3) | 30 (17.5) | 2 (1.3) | 12 (10.3) | 0 (0) |
| Excluding detections <1wk post–RV vaccine | 44 (11.8) | 2 (0.5) | 30 (17.5) | 2 (1.3) | 12 (10.3) | 0 (0) |
| Adenovirus | 33 (8.8) | 2 (0.5) | 5 (2.9) | 3 (2.0) | 3 (2.6) | 2 (2.1) |
| Salmonella | 10 (2.7) | 0 (0) | 7 (4.1) | 1 (0.7) | 2 (1.7) | 0 (0) |
| Shigella | 2 (0.5) | 1 (0.3) | 12 (7.0) | 2 (1.3) | 12 (10.3) | 1 (1.1) |
| Campylobacter | 2 (0.5) | 1 (0.3) | 4 (2.3) | 0 (0) | 2 (1.7) | 1 (1.1) |
| C. difficilea | 0 (0) | 0 (0) | 9 (5.3) | 9 (5.9) | 4 (3.4) | 5 (5.3) |
| Other bacteriab | 1 (0.3) | 4 (1.1) | 2 (1.2) | 1 (0.7) | 0 (0) | 0 (0) |
| Cryptosporidium | 1 (0.3) | 0 (0) | 0 (0) | 1 (0.7) | 0 (0) | 0 (0) |
| Giardia | 0 (0) | 1 (0.3) | 0 (0) | 1 (0.7) | 0 (0) | 0 (0) |
| Codetection | 12 (3.2) | 11 (2.9) | 20 (11.7) | 2 (1.3) | 5 (4.3) | 1 (1.1) |
Abbreviations: AGE, acute gastroenteritis; RV, rotavirus.
Patients with detection of C. difficile <2 years of age were not included because of uncertainty in whether C. difficile played a role in AGE symptoms at <2 years old.
Other bacteria consisted of E. coli 0157:H7, Enterotoxigenic E. coli, Shiga-like toxin–producing E. coli, Vibrio, and Yersinia.
Variation by Year or Season
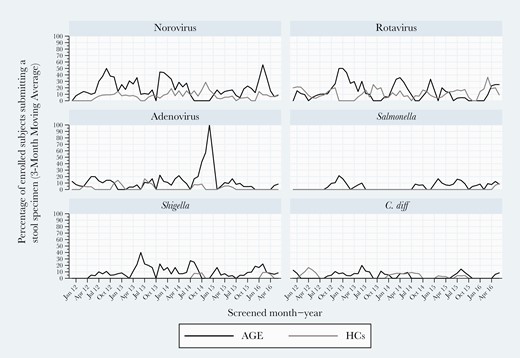
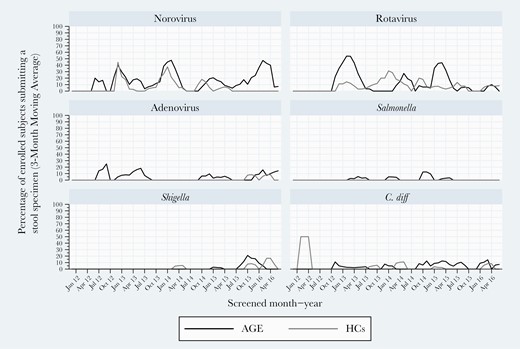
At both sites, NoV and RV were consistently detected in all 5 study years. NoV rates varied between 15% and 20%, while RV rates ranged from a 2013–2014 study year high (28%) to a 2015–2016 low of 16%. Higher RV detection frequency occurred in a biennial pattern overall and for Kansas City but less so for Houston (Figure 2). Of note, high RV detection years were lower detection rate years for NoV. Houston experienced high activity for adenovirus in 2014–2015. When analyzing detection within study years, NoV and RV peak activities occurred in winter/early spring, while adenovirus peaked in late spring (Figures 2–4). Shigella was detected mostly in winter months in Houston (Figure 2).
Three-month moving averages of select pediatric gastroenteritis pathogens detected by multiplex polymerase chain reaction testing during 2011–2016 in Houston, Texas.
Three-month moving averages of select pediatric gastroenteritis pathogens detected by multiplex polymerase chain reaction testing during 2011–2016 in Kansas City, Missouri.
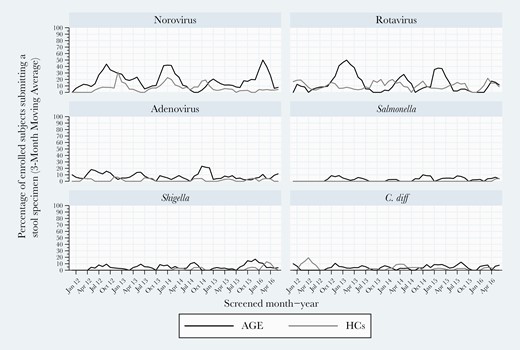
Three-month moving averages of select pediatric gastroenteritis pathogens detected by multiplex polymerase chain reaction testing during 2011–2016 at both sites combined.
Disease Characterization
When comparing subgroups by each organism detected, fever was more frequent with Shigella compared with RV and adenovirus (P = .04 and P = .03, respectively), and also more frequent with Salmonella compared with negatives, RV, and adenovirus (P = .03, P = .01, and P = .008, respectively) (Table 5).
Clinical Characteristics of Pediatric AGE Inpatients With Major Pathogens as Single Detections Analyzed by Each Organism Detected, Compared With the Pediatric Inpatient AGE Group With No Organism Detected
| Norovirus (n = 100) | Rotavirus (n = 86)a | Adenovirus (n = 41) | C. difficile (n = 13) | Shigella (n = 26) | Salmonella (n = 19) | No Organism Detected (n = 322) | |
|---|---|---|---|---|---|---|---|
| Fever, No. (%) | 49 | 67 | 21 | 10 | 24 | 15 | 223 |
| (49.0)∗∗ | (77.9) | (51.2) | (76.9) | (92.3)∗∗∗ | (78.9) | (69.5) | |
| Tmax, median [IQR] | 102 | 102 | 101 | 102 | 103 | 103 | 102 |
| [101–103] | [101–103] | [100–103] | [100–104] | [102–104] | [103–104] | [101–103] | |
| Diarrhea, No. (%) | 87 | 79 | 38 | 9 | 26 | 18 | 241 |
| (87.0)∗ | (91.9)∗∗∗ | (92.7)∗∗∗ | (69.2) | (100.0)∗∗ | (94.7)∗∗ | (74.8) | |
| Diarrhea episodes, median [IQR] | 7 | 8 | 10 | 6 | 15 | 12 | 6 |
| [3–12] | [5–15] | [5–12]∗ | [4–9] | [10–20]∗∗∗ | [8–15]∗∗ | [4–12] | |
| Emesis, No. (%) | 93 | 82 | 36 | 12 | 23 | 12 | 278 |
| (93.0) | (95.3)∗ | (87.8) | (92.3) | (88.5) | (63.2) | (86.3) | |
| Emesis episodes, median [IQR] | 7 | 8 | 4 | 3 | 3 | 2 | 5 |
| [4–12]∗ | [5–13]∗∗∗ | [3–8] | [2–7] | [2–6] | [2–3] | [3–10] | |
| LOH, median [IQR] | 1 | 2 | 2 | 1 | 2 | 2 | 2 |
| [1–3]∗∗∗ | [1–2] | [1–3] | [1–3] | [1–3] | [1–3] | [1–3] |
Abbreviations: AGE, acute gastroenteritis; IQR, interquartile range; LOH, length of hospitalization; RV, rotavirus; Tmax, highest temperature while hospitalized.
P < .05; ∗∗P < .01; ∗∗∗P < .001; reference group: No organism detected group.
Rotavirus (detections <1 week post–receipt of RV vaccine excluded).
Presence of any vomiting occurred more frequently among RV-positive AGE subjects compared with negatives, C. difficile, Shigella, or Salmonella (P = .003, P = .004, P = .004, and P = .03, respectively). Vomiting was also more frequent in NoV compared with negatives, Shigella, or Salmonella (P < .05, P = .02, and P = .001, respectively). Diarrhea occurred universally with Shigella; the number of diarrheal episodes was higher for Shigella subjects compared with all other groups (negatives P < .001, NoV P = .002, RV P = .022, adenovirus P = .03, and C. difficile P = .04). Compared with subjects with no organism detected, length of hospitalization was shorter for subjects with NoV (1 day vs 2 days; P < .001).
Data were available to calculate MVS for 92.0% of AGE subjects (607/660). Shigella and RV were associated with higher MVS, by 1.95 points (95% CI, 0.65–3.24; P = .003) and 1.43 points (95% CI, 0.70–2.17; P < .001), respectively, when compared with subjects with no organism detected. C. difficile had the lowest mean MVS (11.7; 95% CI, 9.5–13.8). MVS was not significantly different between AGE subjects with single-organism detections vs co-detections.
DISCUSSION
In this study at the 2 NVSN sites that used the same multiplex assay plus selective confirmatory testing during 5 years of the post–RV vaccine era (2011–2016), an organism was detected in prospectively collected stools of approximately half of AGE inpatients but only 20% of HCs. Viruses (NoV, RV, and/or adenovirus) were detected in 77.9% of test-positive AGE subjects, more than twice as frequently as bacteria (34.0%). Each virus was detected in each study year. Annual peaks were consistent for viral pathogens year to year and followed expected patterns: NoV (December–March), RV (February–May), and adenovirus (April–June). RV exhibited a biannual pattern overall, although this was less evident when considering only Houston data. Shigella was detected year-round but comprised a higher proportion of winter detections in Houston. The virus-dominant detection pattern at our 2 sites differs from that in developing countries, where bacteria comprise a much larger proportion of detection [16].
For AGE subjects, NoV was the most frequent detection overall. Although RV detection rates were drastically lower than in the prevaccine era [22], RV was the second most commonly detected organism in the inpatients in this study. During the 2012–2013 and 2014–2015 seasons, inpatient RV detections surpassed NoV, and our data confirm the previously reported biennial trend [23–25].
Our finding of NoV as the leading inpatient AGE pathogen in the post–RV vaccine era is consistent with reported data that combined outpatients, emergency department (ED) patients, and inpatients in prior US studies [6–10]. For example, our current NoV detection rates parallel an earlier NVSN study of medically attended (outpatients, ED attendees, and inpatients) AGE in subjects <5 years old over 2 seasons (2009–2010) in 3 different sites. When comparing only the AGE inpatients in that 2009–2010 study with HCs, the RV detection rate among AGE inpatients was 12% vs <1% in HCs; the NoV detection rate was 17.0% in AGE vs 4.0% HCs [6]. In another 1-year prospective AGE study (ED plus inpatients) during the 2012 season in children <2 years old, we previously showed that RV rates were 3.0% in AGE and 0.4% in HCs while NoV rates were 23.0% in AGE and 6.6% in HCs [7]. In contrast, lower US NoV detection rates (11.0%) detected by a different assay (FilmArray Gastrointestinal Panel) were reported in a 2-year single-site observational diarrhea study of 561 children that combined outpatients, ED patients, and inpatients <18 years old [14]. Despite a combined detection rate of only 11%, NoV was still the most commonly detected virus overall. Furthermore, NoV detection rates in their ED patients were similar (21%) to our inpatients.
NoV genogroup GII was the most prevalent NoV (92.0%) in our study, similar to previous studies [7, 8, 26]. NoV GII is the most common genogroup detected in the United States and has been linked to more severe outcomes in outbreaks [27]. In addition to our study showing that NoV is now the leading cause of pediatric hospitalizations for AGE, these data highlight the potential benefits of an effective NoV vaccine.
We hypothesize that the initially surprising and relatively high RV detection rate (10.0%) in HCs was likely vaccine related [25, 28, 29] because 92% of RV PCR-positive HCs received vaccine within 7 days of stool collection; nearly all were <6 months old (within the recommended age range for both Food and Drug Administration–approved vaccines). Further, while these HC stools were GPP RV positive, the RV EIA testing had been negative. Our a priori protocol was to only genotype samples that were EIA positive. Samples were not still available when we analyzed the HC RV GPP data, so we were not able to confirm that these HC RV-positive stools contained vaccine strains. Nevertheless, these data show the importance of taking into account recent rotavirus vaccine receipt when interpreting rotavirus PCR test results.
Bacteria (Salmonella, Shigella, and Campylobacter) were uncommon, detected in <10% of samples. Shigella is known to cause sporadic outbreaks in different geographical sites across the United States. Most Shigella detections occurred in Houston and in children >5 years old with a history of foreign travel or an ill contact. Excluding C. difficile detected in young children age <2 years (most likely not disease-producing) reduced C. difficile from the most common to the fourth most common bacterium. Confirmed parasites were rare in this population. All E. histolytica and most Cryptosporidium detections by this GPP were false positive; previous studies evaluating Luminex xTAG GPP assays have documented false-positive detections for Salmonella and NoV [18, 19]. Co-detections were less frequent in our study (4%) than the 10%–17% in prior studies, likely due to our exclusion of C. difficile detections in those <2 years old.
Unsurprisingly, AGE subjects with bacterial detections appeared sicker than those with viral detections when analyzing individual symptoms. For example, Shigella subjects had more diarrheal episodes per illness. Shigella and Salmonella patients also had the highest median Tmax. However, NoV and RV subjects had more vomiting episodes than any of the other groups.
For MVS, Shigella and RV AGE groups had significantly higher median scores than subjects with no organism detected. AGE subjects >2 years old with C. difficile had among the lowest MVS, suggesting it was not necessarily contributing to disease.
Our data raise 2 additional caveats about the use and interpretation of highly sensitive multiplex molecular testing. The detection of at least 1 organism in ~20% of HCs with no AGE symptoms indicates that organism detection per se, even in children with AGE symptoms, is not necessarily proof of causation for the AGE symptoms. Additionally, our detection of C. difficile in 5% of 2–8-year-old HCs suggests that the mere detection of C. difficile does not prove it as being AGE causative even in older children. Careful interpretation based on clinical presentation, age, and exposure history is critical in using sensitive PCR results for attribution. Further, these data confirm that testing should only be performed in symptomatic patients.
The limitations of our study include having only 2 sites’ data. The other 5 NVSN sites used other multiples assays, so their data were not included. While minor racial/ethnic site differences existed between sites, the 2-site aggregate population resembles the overall US population. Additionally, sapovirus and astrovirus were not targets in the GPP; including these targets likely would have increased overall detection rates [30]. Furthermore, data collected after 2016 may show different detection rates or seasonal/annual patterns.
Despite these limitations, our study strength is the number of prospectively systematically enrolled inpatients in a population-based protocol using the same multiplex molecular assay on stools over a 5-year period. We confirmed ongoing reduction in, but persistence of, RV inpatient disease and confirmed dominance of NoV, particularly GII strains. Interestingly, most RV detections in HCs were in recent RV vaccine recipients who had EIA-negative results. While our 5 years of data from 2 geographically different sites (Midwest and Southwest United States) are midcontinental, our subject diversity parallels that of the United States overall, so our results can inform strategies for public health AGE initiatives while supplying a foundation for monitoring effects of new vaccines, for example, NoV vaccines.
Supplementary Data
Supplementary materials are available at Open Forum Infectious Diseases online. Consisting of data provided by the authors to benefit the reader, the posted materials are not copyedited and are the sole responsibility of the authors, so questions or comments should be addressed to the corresponding author.
Acknowledgments
The authors would like to acknowledge and thank the patients and their families for participation in the study.
Financial support. This work was supported by the US Centers for Disease Control and Prevention (cooperative agreement number CDC-RFA-IP16-004).
Disclaimer. The findings and conclusions in this report are those of the authors and do not necessarily represent the official position of the Centers for Disease Control and Prevention.
Potential conflicts of interest. Dr. Harrison’s institution receives research funding from Astra-Zeneca, GlaxoSmithKline, Merck, and Pfizer for vaccine studies on which he is an investigator. The other authors have indicated that they have no financial relationships relevant to this article to disclose. Since completion of the study, Dr. Hassan is employed by Sanofi US. The other authors have indicated that they have no conflicts of interest relevant to this article to disclose. All authors have submitted the ICMJE Form for Disclosure of Potential Conflicts of Interest. Conflicts that the editors consider relevant to the content of the manuscript have been disclosed.


Comments