


Abstract
Short-term readmission is an important outcome reflecting the poor trajectory of sepsis survivors. The aim of this study was to identify the major risk factors for 30-day readmission among patients with gram-negative bacteremia.
This was a retrospective cohort study including all consecutive adults hospitalized in the medical departments in a referral hospital in Israel with gram-negative bacteremia between 2011 and 2020, who were discharged alive. Predictors for 30-day readmission were investigated, considering death after discharge as a competing event. Cephalosporin resistance was our predictor of interest. Subdistribution hazard ratios (HRs) of the cumulative incidence function were investigated using the Fine and Gray multivariable competing-risk regression model. The prediction models were cross-validated using the k-fold method.
Among 2196 patients surviving hospitalization with gram-negative bacteremia, the mean age was 70 ± 16 years and 432 (19.6%) were readmitted within 30 days. Variables associated with readmission hazards were Arab ethnicity, active malignancy, conditions requiring immunosuppression, anxiolytics or hypnotics, anticoagulant or antiplatelet therapy, discharge with a nasogastric tube, higher predischarge heart rate, duration of antibiotic therapy during hospitalization, and bacteremia caused by cephalosporin-resistant bacteria (HR, 1.23 [95% confidence interval {CI}, .99–1.52]). The area under the receiver operating characteristic curve for this model was 75.5% (95% CI, 71.3%–79.1%). In secondary models, cephalosporin resistance, inappropriate empirical antibiotic treatment, and lower predischarge albumin were significantly associated with readmission.
Thirty-day readmissions among patients with gram-negative bacteremia surviving the index admission were high. Readmission was related to comorbidities and infections caused by multidrug-resistant infections.
Main point: Among 2196 adults surviving hospitalization with gram-negative bacteremia, 432 (19.6%) were rehospitalized within 30 days. Comorbidities, inappropriate empirical antibiotic treatment, bacteremia caused by cephalosporin-resistant bacteria, predischarge heart rate, and albumin were associated with readmissions.
Mortality rates in patients with gram-negative bacteremia are approximately 12% in low-risk patients but may be as high as 38% when complicated by the presence of sepsis, shock, or multiorgan failure or when caused by a multidrug-resistant strain of bacteria [1, 2]. Predictors of short-term as well as long-term mortality have been extensively studied over the years. The Sequential Organ Failure Assessment (SOFA) score, which was initially named the Sepsis-Related Organ Failure Assessment score, is used today, alongside a practical subscore termed quick SOFA (qSOFA) score [3–5]. More specific scores for prediction in sepsis include the Pitt bacteremia score and more recently, the INCREMENT score [6, 7].
With improved sepsis care and reduction of in-hospital mortality, many sepsis survivors are being discharged with new disability and suffer long-term sequelae [8–11]. As can be expected, these patients very often have their health-related quality of life and activities of daily living severely diminished [12, 13]. Hospital readmission is a crude, but easily measurable, indicator of physical, personal, and other quality of life disruption among sepsis survivors [14, 15]. Despite it being an outcome frequently evaluated for other conditions [16, 17], less is known about how to reduce postsepsis readmission rates [18, 19].
The aim of this study was to identify the major risk factors for readmission in the 30 days following hospitalization with gram-negative bacteremia. We hypothesized that bacteremia caused by multidrug-resistant bacteria will be independently associated with a high rate of readmission.
METHODS
Study Design. This was a retrospective cohort analysis. The study was approved by the hospital’s ethics committee, with a waiver of informed consent given the noninterventional study design.
Setting and Study Population. This analysis was conducted at Rambam Health Care Campus (RHCC), a 1000-bed teaching hospital and a tertiary medical center for all of northern Israel, situated in Haifa. The study population comprised adults (>18 years) hospitalized in 1 of 6 medical departments with gram-negative bacteremia diagnosed between 1 January 2011 and 1 January 2020. The departments are not specialized; patients are admitted to the medical departments from the emergency room by rotation. Only the first bacteremic episode for each patient was included in the analysis.
Dependent Variable (Outcome) and Exposure Variable. Thirty-day readmission was defined as any unplanned readmission to the same hospital within 30 days of index discharge resulting in hospitalization (emergency room visits were not included). Death before readmission, within the 30-day follow-up period, was considered as a competing event. The exposure variable was bacteremia caused by cephalosporin-resistant gram-negative bacteria (GNB), including also carbapenem-resistant GNB.
Other Risk Factors and Confounders. We collected a broad data set of variables representing the patients’ demographics, comorbidities, the index (first) hospitalization (including vital signs and laboratory values on arrival at the hospital and before discharge, the use of nasogastric tube or parenteral nutrition, and length of stay at the hospital), place of bacteremia acquisition (ie, community, hospital, other health institution), sepsis signs at onset of bacteremia, and empirical antibiotic treatment. Coding of the variables is defined in Supplementary Appendix 1.
Data Collection. Data were collected from electronic patient files using MDClone, a tool for mining large datasets from medical records (https://www.mdclone.com/). RHCC operates a full electronic patient file from 2011. Data were extracted anonymously. Postdischarge mortality data are updated in the electronic patient files from the Israeli Ministry of Home Affairs’ database.
Main Model and Secondary Analyses. The main model included all patients. The appropriateness of empirical antibiotic treatment could be assigned only when the pathogen was tested to the assigned antibiotic or by European Committee on Antimicrobial Susceptibility Testing expert rules and intrinsic resistances (https://www.eucast.org/expert_rules_and_intrinsic_resistance/), and albumin was not examined for all patients. We conducted secondary analyses including these variables in separate models.
Sample Size. Planning to analyze at least 10 risk factors for readmissions, including the exposure variable, we required at least 100 readmitted patients for a 10:1 events to variable ratio in the regression analysis [20]. Assuming a 30-day readmission rate of 10%, we computed a sample of at least 1000 patients included in the regression analysis.
Statistical Analyses. We compared between patients experiencing readmission or death within 30 days and readmissions alone on univariate analysis. Differences between categorical variables were assessed using the χ 2 test and between continuous variables using t test or nonparametric tests. Independent risk factors were investigated using the multivariable competing-risk regression model proposed by Fine and Gray with readmission being the event of interest and deaths the competing event [21]. The Fine and Gray model computes the subdistribution hazard of the cumulative incidence function in presence of a competing event that precludes the occurrence of the event of interest, in contrast with classic Cox regression models, which inappropriately censure these observations [22]. Variables were selected for entry to the regression analysis by clinical and statistical significance on univariate analysis (P < .05), selecting from variables associated with readmission or death or with readmissions alone. Clinically or statistically correlated (R > 0.6) variables were excluded. All selected variables were entered initially to a model and nonsignificant variables were dropped until achieving the lowest Bayesian information criteria (BIC) to maximize goodness of fit and avoid overfitting in the final model [23]. BIC differences of <10 were disregarded [24]. Model performance was assessed with calibration plots evaluating the graphical agreement between observed and predicted risks at 1–30 days [25, 26]. The area under the receiver operating characteristic curve (AUC) was calculated [27]. The performance of each model was cross-validated on the entire cohort using the k-fold cross-validation method [28]. Analyses were conducted using SPSS version 24 and R version 4.0.3 software.
RESULTS
Among 3222 patients with gram-negative bacteremia, 2196 patients were discharged alive and included in our analysis (Figure 1). A total of 142 (6.4%) patients died within 30 days of the index discharge without being readmitted to the hospital and 432 (19.6%) patients were rehospitalized within 30 days, of whom 71 subsequently died during or after rehospitalization and within 30 days of index discharge (Figure 1). Median time to readmission was 7 days (interquartile range, 2–14 days). Nearly a third of all rehospitalizations were for infection (132/432 [30.0%]).
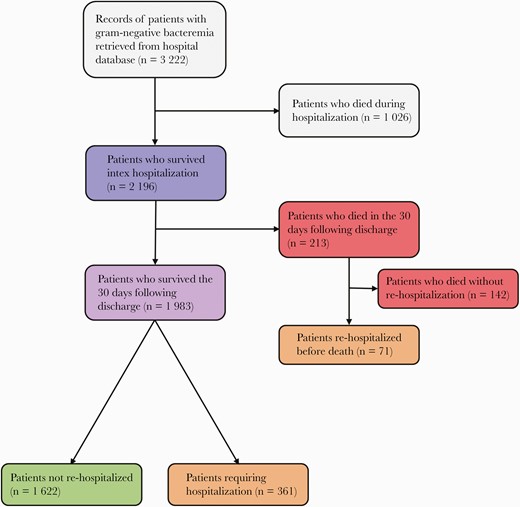
Patient flow.
The patients’ mean age was 70 years (standard deviation, 16 years); 1525 (69%) were aged >65 years, and 1095 (49.9%) were female. A quarter of patients (554 [25.2%]) received a main diagnosis of infection in the index admission (eg, bacteremia, sepsis, septic shock, cellulitis, urosepsis); less common reasons for admission were acute renal failure or acute electrolyte disturbances (330 [15%]), malignancies (240 [10.9%]), and acute myocardial infarction or congestive heart failure exacerbation (201 [9.2%]). The bacteremia was hospital-acquired in 1082 (49.3%) and healthcare-associated (acquired at a nursing home or a long-term care facility) in 168 (7.7%). The most common pathogens isolated in blood were Escherichia coli (997 [45.4%] patients), followed by Klebsiella spp (329 [14%]) and Pseudomonas spp (202 [9.2%]). Information on cephalosporin and/or carbapenem resistance was available in 2047 of 2196 (93.2%) patients. Of those, 549 (26.8%) demonstrated resistance to all cephalosporins tested. Carbapenem resistance was found in 50 of 1989 (2.5%) patients.
Significant predictors for readmission or death (n = 2196 patients) on univariate analysis included being a nursing home resident, nasogastric feeding, several comorbidities and the Charlson score (Table 1). Among variables collected in the index hospitalization, impaired consciousness, critical illness (defined as need for vasopressors or anesthetics used for mechanical ventilation), and hospitalization duration were associated with readmission or death. Among sepsis-related variables, hospital-acquired bacteremia, cephalosporin resistance, inappropriate empirical antibiotic treatment in the first 24 hours (but not in the first 4 hours), broad-spectrum antibiotics, and longer duration of antibiotic therapy during the index hospitalization were significantly associated with readmission, whereas E coli bacteremia and urinary tract source of infection were associated with no readmission. Among measurements in the 72 hours before discharge, higher heart rate and several laboratory measurements, such as higher leukocyte count, lower hemoglobin, and lower albumin, were associated with readmission or death. Examining separately predictors for readmission alone (n = 1983, excluding the patients who died in the 30 days after discharge) showed similar trends, with the addition of older age, Arab ethnicity, diabetes treated with insulin, and several drug therapies indicating heart disease, hypertension, and psychiatric disease as significant variables (Supplementary Appendix Table 1). Cephalosporin resistance and the related antibiotic markers were significantly associated also with readmissions alone.
Comparison Between Patients Who Were Readmitted or Died Within 30 Days and Those Who Did Not—Univariate Analysis
| Characteristic | 30-Day Readmission or Death | No 30-Day Readmission or Death | P Value |
|---|---|---|---|
| (n = 574 [26.1%]) | (n = 1622 [73.9%]) | ||
| Demographic characteristics | |||
| Age, y, mean (SD) | 70.62 (15.77) | 70.25 (17.01) | .716 |
| Sex, female | 270 (47.0%) | 825 (50.9%) | .115 |
| Ethnicity, Arab | 126 (22.0%) | 297 (18.3%) | .057 |
| Nursing home resident | 237 (41.3%) | 498 (30.7%) | .000 |
| HMO | .923 | ||
| Clalit | 390 (68.1%) | 1111 (69.0%) | |
| Leumit | 37 (6.5%) | 108 (6.7%) | |
| Meuhedet | 32 (5.6%) | 80 (5.0%) | |
| Maccabi | 114 (19.9%) | 311 (19.3%) | |
| Comorbidities | |||
| Cardiovascular disease (HTN, IHD, PVD, CHF) | 445 (77.5%) | 1249 (77.0%) | .798 |
| HTN | 354 (61.7%) | 1012 (62.4%) | .760 |
| PVD | 47 (8.2%) | 93 (5.7%) | .039 |
| CHF | 123 (21.4%) | 280 (17.3%) | .027 |
| Insulin-treated DM (type 1 or 2) | 104 (18.1%) | 266 (16.4%) | .344 |
| Atrial fibrillation | 100 (17.4%) | 259 (16.0%) | .418 |
| CVA | 114 (19.9%) | 272 (16.8%) | .094 |
| COPD | 58 (10.1%) | 140 (8.6%) | .290 |
| Malignancy | 193 (33.6%) | 372 (22.9%) | .000 |
| Cirrhosis | 25 (4.4%) | 38 (2.3%) | .013 |
| Renal failure | .019 | ||
| No | 439 (76.5%) | 1328 (81.9%) | |
| Acute | 76 (13.2%) | 162 (10.0%) | |
| Chronic | 59 (10.3%) | 132 (8.1%) | |
| Charlson comorbidity index | .003 | ||
| Healthy (0) | 23 (4.0%) | 88 (5.4%) | |
| Mild (1–2) | 25 (4.4%) | 132 (8.1%) | |
| Moderate (3–4) | 71 (12.4%) | 229 (14.1%) | |
| Severe (≥5) | 455 (79.3%) | 1173 (72.3%) | |
| Home therapy | |||
| Long-term nasogastric tube | 194 (33.8%) | 357 (22.0%) | .000 |
| Immunosuppressants | 92 (16.0%) | 185 (11.4%) | .004 |
| Anticoagulants | 239 (41.6%) | 623 (38.4%) | .173 |
| Oral antidiabetics | 125 (21.8%) | 356 (21.9%) | .932 |
| Lipid-lowering | 190 (33.1%) | 597 (36.8%) | .112 |
| β-blockers | 239 (41.6%) | 648 (40.0%) | .479 |
| Calcium channel blockers | 149 (26.0%) | 399 (24.6%) | .518 |
| Diuretics | 180 (31.4%) | 507 (31.3%) | .964 |
| RAAS inhibitors | 196 (34.1%) | 579 (35.5%) | .556 |
| Psycholeptics | 195 (34.0%) | 513 (31.6%) | .302 |
| Hospitalization characteristics | |||
| Impaired consciousness | 85 (14.8%) | 178 (11.0%) | .015 |
| Critically ill | 75 (13.1%) | 130 (8.0%) | .000 |
| Blood products | 15 (2.6%) | 48 (3.0%) | .669 |
| Hospitalization duration, d, mean (SD) | 16.9 (26.2), n = 573 | 14.3 (23.9), n = 1616 | .000 |
| Infection characteristics | |||
| Infection acquisition | .000 | ||
| Community | 174 (30.3%) | 772 (47.6%) | |
| Health institution | 47 (8.2%) | 121 (7.5%) | |
| Hospital | 353 (61.5%) | 729 (44.9%) | |
| Escherichia coli bacteremia | 234 (40.8%) | 763 (47.0%) | .009 |
| Pseudomonas spp (including P aeruginosa) bacteremia | 55 (9.6%) | 147 (9.1%) | .712 |
| UTI | 173 (30.1%) | 623 (38.4%) | .000 |
| Cephalosporin and/or carbapenem resistance | 197/549 (36.9%) | 352/1498 (23.5%) | .000 |
| Cephalosporin resistance | 192/545 (35.2%) | 344/1494 (23.0%) | .000 |
| Ceftazidime resistance | 189/424 (44.6%) | 350/1081 (32.4%) | .000 |
| Carbapenem resistance (CRE) | 16/533 (3.0%) | 34/1456 (2.3%) | .400 |
| Aminoglycoside resistance | 10/530 (1.9%) | 51/1460 (3.5%) | .066 |
| Broad-spectrum antibiotics therapy during hospitalization | 248 (43.2%) | 510 (31.4%) | .000 |
| Inappropriate empirical antibiotic therapy in the first 4 h | 336/463 (72.6%) | 852/1204 (70.8%) | .465 |
| Inappropriate empirical antibiotic therapy in the first 24 h | 234/463 (50.5%) | 477/1204 (39.6%) | .000 |
| Total duration of antibiotic therapy, d, mean (SD) | 7.2 (5.7), n = 540 | 6.0 (5.5), n = 1431 | .000 |
| Time to appropriate antibiotics, h, mean (SD) | 34.0 (35.8), n = 463 | 28.8 (35.2), n = 1204 | .001 |
| 72-h predischarge laboratory values | |||
| Heart rate median, bpm, mean (SD) | 83 (15), n = 567 | 78 (13), n = 1610 | .000 |
| Body temperature median, °C, mean (SD) | 36.8 (0.39), n = 567 | 36.8 (0.31), n = 1611 | .201 |
| Oxygen saturation–RA median, %, mean (SD) | 95.1 (3.3), n = 499 | 95.5 (2.9), n = 1451 | .183 |
| WBC median, 109 cells/L, mean (SD) | 10.2 (6.7), n = 440 | 8.9 (756), n = 1219 | .000 |
| ANC median, 109 cells/L, mean (SD) | 7.2 (4.7), n = 363 | 5.9 (3.6), n = 1010 | .000 |
| ALC median, 109 cells/L, mean (SD) | 1.28 (0.8), n = 348 | 1.41 (1.4), n = 980 | .056 |
| Hemoglobin median, mg/dL, mean (SD) | 10.1 (1.9), n = 440 | 10.6 (1.9), n = 1219 | .000 |
| RDW median, %, mean (SD) | 16.3 (2.4), n = 356 | 15.5 (2.3), n = 1052 | .000 |
| Glucose median, mg/dL, mean (SD) | 133.4 (61.8), n = 458 | 132.3 (57.1), n = 1276 | .979 |
| Creatinine median, mg/dL, mean (SD) | 1.36 (1.0), n = 454 | 1.22 (1.0), n = 1259 | .053 |
| BUN median, mg/dL, mean (SD) | 29.6 (25.1), n = 455 | 23.5 (17.4), n = 1260 | .000 |
| Sodium median, mg/dL, mean (SD) | 137.0 (5.1), n = 461 | 137.4 (3.9), n = 1282 | .026 |
| Calcium median, mg/dL, mean (SD) | 8.2 (0.78), n = 358 | 8.4 (0.64), n = 1072 | .001 |
| Bilirubin average, mg/dL, mean (SD) | 1.21 (2.9), n = 273 | 0.65 (0.9), n = 833 | .006 |
| Albumin median, g/dL, mean (SD) | 2.42 (0.59), n = 245 | 2.78 (0.55), n = 779 | .000 |
| Lactate median, mmol/L, mean (SD) | 1.99 (1.5), n = 171 | 1.70 (0.8), n = 423 | .038 |
Data are presented as No. (%) unless otherwise indicated.
Abbreviations: ALC, absolute lymphocyte count; ANC, absolute neutrophil count; bpm, beats per minute; BUN, blood urea nitrogen; CHF, congestive heart failure; COPD, chronic obstructive pulmonary disease; CRE, carbapenem-resistant enterobacteriaceae; CVA, cerebral vascular accident; DM, diabetes mellitus; HMO, health maintenance organization; HTN, hypertension; IHD, ischemic heart disease; PVD, peripheral vascular disease; RA, room air; RAAS, renin angiotensin aldosterone system; RDW, red blood cell distribution width; SD, standard deviation; UTI, urinary tract infection; WBC, white blood cell.
In the main competing hazards model (n = 1832; 364 patients were excluded due to missing values), the variables that retained statistical significance were Arab ethnicity, active malignancy, median heart rate in the 72 hours before discharge, discharge with a nasogastric tube, immunosuppressive therapy, anticoagulant or antiplatelet drugs, anxiolytic or hypnotic therapy, and total duration of antibiotic therapy following bacteremia (Table 2). Bacteremia caused by cephalosporin-resistant bacteria improved the model, but was not statistically significant (hazard ratio [HR], 1.230 [95% confidence interval {CI}, .995–1.520]). Calibration curves obtained with cross-validation showed an AUC of 75.5% (95% CI, 71.3%–79.1%), with good calibration mainly in the 0–40% readmission risk range (Supplementary Appendix Figure 1).
Hazard for 30-Day Readmissions: Competing Events Modela
| Variable | Subdistribution HR (95% CI) | P Value |
|---|---|---|
| Ethnicity, Arab | 1.420 (1.103–1.820) | .006 |
| Malignancy | 1.360 (1.091–1.690) | .006 |
| Long-term nasogastric tube (home) | 1.830 (1.470–2.280) | <.001 |
| Immunosuppressants (home)b | 1.410 (1.082–1.840) | .011 |
| Anticoagulants or antiplatelet drugs (home)c | 1.510 (1.212–1.870) | <.001 |
| Anxiolytic or hypnotics (home)d | 1.320 (1.062–1.630) | .012 |
| Cephalosporin resistance | 1.230 (0.995–1.520) | .055 |
| Total duration of antibiotic therapy (1-day increments) | 1.015 (1.004–1.027) | .006 |
| Heart rate (median, 10-bpm increments) | 1.240 (1.144–1.340) | <.001 |
Abbreviations: bpm, beats per minute; CI, confidence interval; HR, hazard ratio.
aThe analysis includes 1832 of 2196 patients; 364 were omitted due to missing values. Variables entered in the equation but not retained: age, congestive heart failure, insulin-treated diabetes mellitus, cirrhosis, renal failure, Charlson comorbidity index, oral antidiabetics, β-blockers, calcium channel blockers, diuretics, renin angiotensin aldosterone system inhibitors, impaired consciousness, critically ill, hospitalization duration, place of infection acquisition, Escherichia coli bacteremia, urinary tract infection, broad-spectrum antibiotic therapy during hospitalization.
bImmunosuppressants included long-term use of glucocorticoids or a chemotherapeutic immunosuppressant (eg, methotrexate, azathioprine, cyclosporin, tacrolimus).
cAnticoagulation or antiplatelet drugs included aspirin, clopidogrel, prasugrel, heparin, enoxaparin, fondaparinux, warfarin, apixaban, rivaroxaban, and dabigatran.
dAnxiolytic or hypnotic therapy included diazepam, lorazepam, oxazepam, zolpidem, zopiclone, haloperidol, olanzapine, buspirone, etc.
In a secondary model including the appropriateness of empirical antibiotic treatment (n = 1534), resistance to cephalosporins (HR, 1.290 [95% CI, 1.015–1.630]) and inappropriate empirical antibiotic treatment in the first 24 hours (HR, 1.316 [95% CI, 1.049–1.647]) were significantly associated with readmission (Table 3). In the model including albumin (n = 905 with available albumin measurement within 72 hours before discharge), higher albumin levels were associated with a lower hazard for readmission, duration of antibiotic therapy was associated with readmissions, and cephalosporin resistance optimized the model without statistical significance (Supplementary Appendix Table 2). In both secondary analyses, ethnicity lost significance and cirrhosis was associated with readmissions when adjusting to albumin. Performance evaluation of the secondary models yielded an AUC of 78.2% (95% CI, 66.3%–85.3%) for the model including the appropriateness of empirical antibiotic treatment and an AUC of 69.4% (95% CI, 52.7%–79.2%) for the model including albumin levels.
Hazard for 30-Day Readmissions: Competing Events Model Including Inappropriate Empirical Antibiotic Therapy in the First 24 Hoursa
| Variable | Subdistribution HR (95% CI) | P Value |
|---|---|---|
| Malignancy | 1.300 (1.034–1.667) | .030 |
| Long-term nasogastric tube (home) | 1.840 (1.455–2.319) | <.001 |
| Immunosuppressants (home)b | 1.540 (1.175–2.026) | .001 |
| Anticoagulants or antiplatelet drugs (home)c | 1.450 (1.146–1.831) | .001 |
| Anxiolytics or hypnotics (home)d | 1.420 (1.131–1.794) | .002 |
| Cephalosporin resistance | 1.290 (1.015–1.630) | .037 |
| Inappropriate empirical antibiotic therapy in the first 24 h | 1.316 (1.049–1.647) | .018 |
| Heart rate (median, 10-bpm increments) | 1.290 (1.180–1.402) | <.001 |
Abbreviations: bpm, beats per minute; CI, confidence interval; HR, hazard ratio.
aThe analysis includes 1534 of 2196 patients; 662 were omitted due to missing values.
bImmunosuppressants included long-term use of glucocorticoids or a chemotherapeutic immunosuppressant (eg, methotrexate, azathioprine, cyclosporin, tacrolimus).
cAnticoagulation or antiplatelet drugs included aspirin, clopidogrel, prasugrel, heparin, enoxaparin, fondaparinux, warfarin, apixaban, rivaroxaban, and dabigatran.
dAnxiolytic or hypnotic therapy included diazepam, lorazepam, oxazepam, zolpidem, zopiclone, haloperidol, olanzapine, buspirone, etc.
DISCUSSION
In the current study, we used demographic, comorbidity, clinical and laboratory data, and the infectious event to identify the risk factors for hospital readmission shortly after discharge among patients with gram-negative bacteremia. In our cohort, 19.6% of sepsis survivors were rehospitalized within 30 days and another 6.4% died within 30 days without readmission. The cumulative risk for readmission or death was associated mainly with background patient characteristics, including cardiovascular disease requiring anticoagulants or antiplatelet drugs, malignancy and immunosuppression, cognitive or psychiatric conditions requiring therapy, and the need for enteral feeding most commonly due to poor functional status. However, infection and acute disease-related factors also contributed to the adverse event of readmission or death. Inappropriate empirical antibiotic treatment, higher median heart rate and lower albumin before discharge, and longer antibiotic treatment duration were associated with the adverse outcome. Cephalosporin resistance contributed to all models and was associated with the outcome in a model adjusted for appropriateness of the empirical antibiotic treatment (HR, 1.290 [95% CI, 1.015–1.630]).
Many background and hospitalization-related risk factors identified as significant predictors in our study were known from previous studies of postsepsis readmissions, such as the presence of comorbidities, discharge to short-term/long-term care facility, the use of parenteral nutrition, and lower discharge hemoglobin/sodium/serum albumin [18, 19, 29, 30]. Strikingly, the 30-day all-cause readmission rates were similar in ours and previous studies in the United States (US). In an analysis of the Healthcare Cost and Utilization Project’s National Readmission Database during 2013 and 2014, among 898 257 patients who survived hospitalization with sepsis in the US, 17.5% were readmitted within 30 days [18]. In a retrospective study of 3 hospitals belonging to the University of Pennsylvania Health System in 2012, the 30-day unplanned readmission rate was 23.4% among 444 sepsis survivors [19]. Indeed, previous studies examining postdischarge trajectory of bacteremia have described the rapid functional and cognitive decline among sepsis survivors [31]. Hospital readmission, closely following discharge, probably reflects only the most severe adverse effects of sepsis on survivors.
Sepsis-specific risk factors relating to the pathogen, resistance, and antibiotic therapy were investigated by fewer studies. In a single-center study including 1697 intensive care unit patients discharged following bacteremia between 2008 and 2012 in the US, an extended-spectrum β-lactamase (ESBL) phenotype and Bacteroides spp bacteremia were independently associated with 30-day readmission, while a urinary tract source and E coli were inversely associated with readmission [15]. The use of inappropriate empirical antibiotics in the 24 hours following blood culture collection was not significantly associated with readmission in this study. In a database-driven multicenter study in the US focusing on hospital costs, among 4984 patients receiving inappropriate empirical antibiotics in the first 2 days the crude 30-day readmission rate was significantly higher than among 32 710 patients who received covering empirical antibiotics (25.6% vs 21.1%, respectively) [32, 33]. In our analysis, in multivariable survival models for readmission with postdischarge death a competing risk, an ESBL or carbapenem-resistant phenotype was nonsignificant in the main model including all patients (odds ratio, 1.23 [95% CI, .995–1.52]), but it contributed to the fit of the model. In a secondary analysis considering the appropriateness of empirical antibiotic treatment in the first 24 hours, both cephalosporin resistance and inappropriate empirical antibiotic treatment were significantly associated with readmission, probably showing better the complete toll of antibiotic resistance on patients’ postdischarge morbidity. Place of acquisition, the bacterial strain, source of infection, and the use of broad-spectrum antibiotics were not associated with readmission after adjustment. Sepsis severity measures were similarly significant on univariate analysis but not retained in the multivariable model.
Several strengths and limitations of our study should be noted. Previous studies used International Classification of Diseases (ICD) codes to identify sepsis in the index admission, whereas we defined our cohort more stringently by the presence of bacteremia. We further avoided contaminants by focusing only on gram-negative bacteremia that are almost always of clinical importance and rarely cause contamination [34]. While postdischarge deaths were not considered in the previous studies, we used a competing risk model for the cumulative hazard of readmission considering postdischarge death as a competing event. This analysis modified some variables such as younger age that was associated with readmissions alone, but not when considering the competing risk of death. As in previous studies, we collected data on unplanned readmissions only. Admissions to hospitals other than RHCC were not considered. However, RHCC is the only tertiary care hospital in northern Israel, and patients usually return to the same hospital they were discharged from for various logistic and clinical reasons. We extracted data from patients’ file using a query tool affecting the granularity of the data available for this study; with manual data extraction information such as baseline functional and cognitive status, source of bacteremia and source control could have been better extracted. Some data on bacterial susceptibility and antibiotic treatment and coverage were lost in the data transfers; these data were missing at random. Missing data were not imputed, but we ran separate analyses including the important variables with missing data. Ethnicity, remaining in the final model, is a correlate of comorbidities and socioeconomic status in Israel [35, 36], rather than an effect of religion or ethnic origin. The factor as is cannot be used outside of Israel; however, it draws attention to possible adverse outcomes in underprivileged subpopulations. Also in the US, a study showed an association between residence in socioeconomically disadvantaged neighborhoods and high readmission rates following sepsis [37].
In summary, readmissions and deaths among patients with gram-negative bacteremia surviving the index admission were all too common in our study, as in previous studies, and have not changed with time in the last decade. These reflect the ominous effect of infection, beyond mortality. Readmission was not related to age but to comorbidities and to infections caused by multidrug-resistant infections. Our analysis highlights the burden of resistance beyond mortality. The identified risk factors help us understand the reasons for the poor trajectory of sepsis survivors and can be used to triage patients for postdischarge interventions to improve recovery from bacteremia.
Notes
Author contributions. All authors contributed to study conception, building the study database, obtaining the data, and data analysis. Y. P. wrote the manuscript, and all authors critically reviewed the manuscript.
Patient consent statement. The design of the work was approved by the Rambam Health Care Campus ethics committee.
Financial support. This study was conducted without external funding and as part of the MD thesis of Y. P. at the Ruth and Bruce Rappaport Faculty of Medicine, Technion–Israel Institute of Technology.
Potential conflicts of interest. All authors: No potential conflicts of interest.
All authors have submitted the ICMJE Form for Disclosure of Potential Conflicts of Interest. Conflicts that the editors consider relevant to the content of the manuscript have been disclosed.
Presented in part: 31st European Congress of Clinical Microbiology and Infectious Diseases, Virtual, 9–12 July 2021.


Comments