


Abstract
In central Africa, millions of individuals infected with Loa loa have received the anthelminthic drug ivermectin (IVM) as part of mass drug administration (MDA) campaigns targeting onchocerciasis control or elimination. Nonetheless, the parasitological surveys that are occasionally conducted to evaluate the impact of IVM treatments on Onchocerca volvulus do not include an assessment of the extra benefits of those MDA campaigns on L. loa.
We conducted a systematic review of trials on the effect of a single standard (150–200 μg/kg) dose of IVM on L. loa microfilarial density (MFD). The dynamics of MFD over 365 days of treatment were described using multilevel regression and latent class modeling.
IVM brings about a rapid, dramatic, and sustained decrease, with reduction rates of 60%, 75%, 85%, and 90% on day 1 (D1), D2, D7, and D365, respectively. At D365, no participants (0/238) with an initial MFD of <20 000 microfilariae (mf)/mL were at risk of postivermectin severe adverse events, and only 1/57 individuals with an initial MFD of ≥20 000 mf/mL presented with an MFD above this value. The main predictor of post-treatment MFD was the pretreatment value, but this post-treatment value varied little between D8 and D365 regardless of the pretreatment level.
A single dose of IVM is very effective at substantially reducing L. loa MFD for at least a year, irrespective of the initial level of parasitemia. Individuals treated with IVM are probably not any more at risk of severe adverse events when retreated 1 year later.
The broad-spectrum anthelmintic drug ivermectin (Mectizan) has been the mainstay of programs against onchocerciasis for the last 25 years. Ivermectin is also used, in combination with albendazole, against lymphatic filariasis (LF) in areas where onchocerciasis is also endemic. In 2017, 368 million treatments were approved by the Mectizan Expert Committee and donated by Merck & Co., Inc., for mass treatment of onchocerciasis and/or LF [1]. In large parts of central Africa, onchocerciasis coexists with loiasis [2, 3], and individuals can be co-infected with Loa loa and Onchocerca volvulus. For example, 15% of residents were found to harbor both L. loa and O. volvulus microfilariae in a rural area of Central Cameroon [4], whereas less impressive figures have been reported in the rainforest communities of Southwestern Nigeria (2.7%) [5] and Cameroon (5.6%) [6]. Consequently, in areas under mass drug administration (MDA) of ivermectin, millions of individuals infected with L. loa have received the drug, with contrasting outcomes: from self-reported improvement of loiasis-related signs and symptoms to potentially fatal serious adverse events (SAEs). The reason for SAEs is that ivermectin rapidly kills the embryonic stages of L. loa or microfilariae (mf)—the so-called “microfilaricidal effect.” When the L. loa microfilarial density (MFD) exceeds 30 000 mf/mL, the rapid paralysis and death of these mf leads to the blockage of blood capillaries in various organs, including the brain, and to inflammatory processes and deposition of fibrin clots on the walls of the vessels [7, 8].
In addition to the microfilaricidal effect, the long-lasting reduction in L. loa MFD after treatment [9, 10] suggests that ivermectin, in a similar manner to that observed for O. volvulus, temporarily disrupts the production or release of mf by the female worms—a phenomenon referred to as an “embryostatic effect.”
Outside the context of ivermectin treatment, it has been demonstrated that high L. loa MFD is associated with excess mortality in untreated individuals [11]. Therefore, in areas where loiasis is endemic, ivermectin MDA organized to eliminate onchocerciasis might have a supplementary beneficial effect by reducing the pathogenic processes associated with high L. loa MFD.
Here, we present the first systematic review and analysis of individual and aggregated data on the effect of a single standard (150–200 μg/kg) dose of ivermectin on L. loa MFD. The objectives of this analyses were (1) to gain insight into the impact of ivermectin MDA on the microfilarial reservoir of L. loa and (2) to assess whether an individual already treated with ivermectin may still be at risk of SAEs after a subsequent treatment.
METHODS
Search Strategy
We searched the PubMed and ISI Web of knowledge databases using the terms “(loiasis OR loase OR Loa loa) AND (ivermectin$) AND (trial OR therapeuti$)” for articles published in English or French. We also checked the references of all studies identified by the above methods.
Data Extraction
Two authors (S.D.P., M.B.) independently assessed eligibility and study quality and extracted data (Figure 1). Eligible trials had to present data on (1) individuals with L. loa infection, defined by the presence of mf in the blood (clinical trials), or (2) a population living in an endemic community eligible for treatment regardless of L. loa microfilarial status (community trials). Only trials during which ivermectin was given as a single standard dose (150–200 µg/kg of body weight) were included. Outcome measures were L. loa microfilaremia prevalence and MFD. Basic parasitological and demographic information from each eligible study was entered into a purpose-built database. The extracted data included demographics of participants (age range and sex ratio) and methods used to select the subjects and for parasitological examinations. In addition, the authors of the included studies were contacted and asked to share the raw data of these trials.
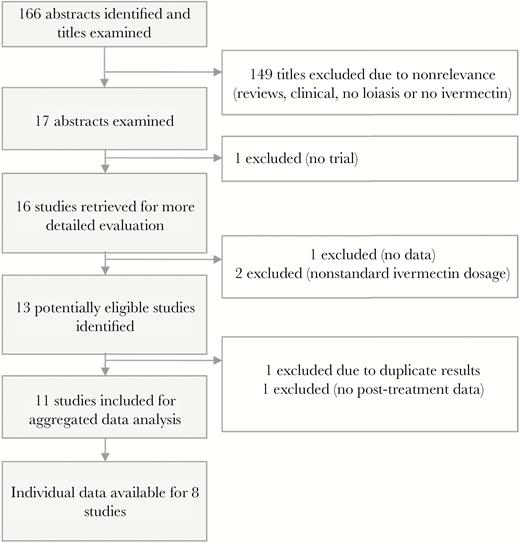
Flowchart summarizing the results of the literature search of a standard dose of ivermectin on Loa loa microfilarial density.
Data Analysis
Average Trend Analysis
The effect of a single dose of ivermectin was illustrated by the change (expressed as a percentage) in the pooled geometric mean (GM) of MFD from baseline (pretreatment) values. The pooled GM of this ratio at time t was calculated as a weighted GM in which the sample size of each study was used as a proxy measure for the inverse of the variance (Appendix, Equation 1).
Analysis of Individual Factors Associated With the Effect of Ivermectin on L. loa MFD
Using individual participant data, we assessed whether the individuals’ age, gender, and pretreatment L. loa MFD were associated with the dynamics of post-treatment L. loa MFD (dependent variable). The pretreatment L. loa MFD was coded in 4 different categories, according to the 4 quartiles: 0–166 (n = 216), 167–3139 (n = 208), 3140–16 179 (n = 212), and 16 180–198 660 mf/mL (n = 211). To account for the nature of the data (repeated measures on sets of individuals from different trials), we built a 3-level regression model: A random intercept was set at the study level, and a random intercept was nested in the study-level random effect to account for repeated measures on individuals. Intraclass correlations were calculated to quantify the variance attributable to interstudy and interindividual heterogeneity. This analysis was performed using the xtmixed procedure in Stata software [12]. This analysis was conducted separately for the 7-day period after treatment (when ivermectin exerts its microfilaricidal effect) and the period from day 8 (D8) to D365. The same random-effects regression model was used for both periods. In addition to this main analysis, we performed latent class modeling to test for the existence of different subtypes of responders, defined as the possible “latent classes” ( Appendix).
RESULTS
Study Characteristics
Eleven published studies [9, 10, 13–21] provided usable results for the purpose of this analysis (Table 1). The studies were conducted in Cameroon, Gabon, and the Republic of Congo. The dates on which post-treatment L. loa MFD were measured (and the number of subjects examined at each time point) were D1 (24 hours after treatment; 73 subjects), D2 (72), D3 (103), D4 (69), D5 (13), D6 (13), D7 (140), D8 (8), D15 (44), D20 (60), D22 (33), D30 (31), D50 (53), D60 (31), D90 (86), D180 (216), and 365 (256) (Figure 2). Individual data were available for 8 [9, 10, 14–17, 19, 20] of the 11 included studies, representing a pool of 847 individuals, of whom 757 had L. loa mf at baseline (Figure 2).
Ivermectin Trials Providing Results on Loa loa Microfilaremia Included in the Analysis
| Reference | Country | Sex, Age Range, y | Inclusion Criteria for IVM Treatment | Blood Sample/Processing | IVM Dose, µg/kg | No. of Participantsa | Initial MFD (WGM) [range], mf/mL |
|---|---|---|---|---|---|---|---|
| [13] | Republic of Congo | M+F, NA | MFD >0 mf/mL | 2 × 20 µL/leucoconcentration if no mf in blood smears | 200 | 28 | 5850 [2500–46 000] |
| [14] | Cameroon | M+F, >5 | MFD >0 mf/mL | 30 µL | 200 | 80 | 1914 [33–139 086] |
| [15] | Cameroon | M+F, 19–60 | MFD >30 mf/mL | 30 µL | 200 | 112 | 15 725 [633–164 550] |
| [10] | Gabon | M+F, 15–76 | MFD >0 mf/mL | 10 µL + 4 mL if no mf in blood smear | 200 | 71 | 39 [0.25–35 700] |
| [9] | Cameroon | M+F, ≥15 | Random sampling in 7 microfilaremia strata | 50 µL | 150 | 533 | 503.8 [0–198 660] |
| [16] | Cameroon | M+F, 18–70 | 5 ≤ MFD ≤ 150 mf/mL | 50 µL | 150 | 13 | 535 [80–2240] |
| [17] | Cameroon | M+F, ≥15–70 | 100 ≤ MFD ≤ 15 000 mf/mL | 50 µL | 150 | 31 | 3261 [420–16 220] |
| [18] | Gabon | M+F, 7–78 | Symptoms of loiasis | 4 mL/leucoconcentration if no mf found in 10-µL aliquot | 200 | 84 | 129.3 [NA] |
| [19] | Cameroon-Gabon | M+F, NA | MFD >0 mf/mL | NA | 200 | 7 | 1222 [300–11 150] |
| [20] | Cameroon | M+F, 2–81 | Not documented | 30 µL | 200 | 448 | 8813 [67–101 690] |
| [21] | Gabon | M, 18–70 | Moderate loiasis | 3–5 mL/leucoconcentration | 150 | 5 (group 1) | 290 [NA] |
| M, 18–70 | MFD >0 mf/mL & infected with O. volvulus | 200 | 5 (group 2) | 292 [NA] | |||
| M+F, 13–72 | 200 | 17 (group 3) | 222 [NA] |
Abbreviations: IVM, ivermectin; MFD, microfilarial density; WGM, Williams geometric mean.
aWith at least 1 post-treatment measure.
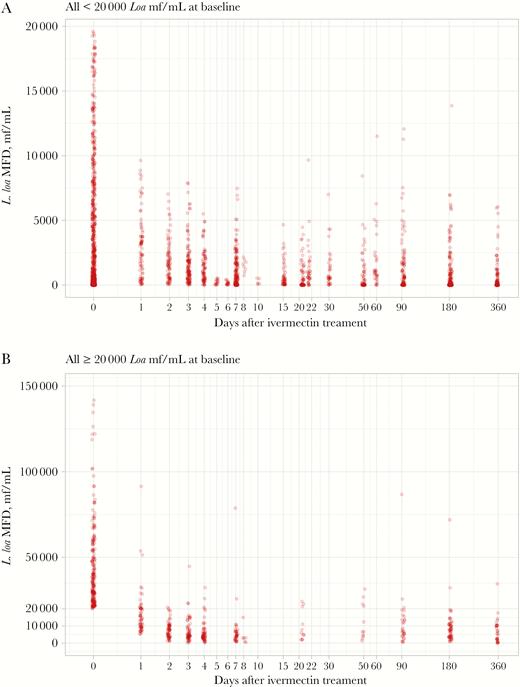
Loa loa microfilarial density before (time = 0) and after ivermectin treatment in individuals with initial microfilaremia (A) below 20 000 mf/mL and (B) above 20 000 mf/mL. Abbreviation: MFD, microfilarial density.
General Trend in L. loa MFD After Ivermectin Treatment
Seventy-five point four percent (571/757) of the initially microfilaremic subjects remained microfilaremic after treatment. Nonetheless, when compared with the pretreatment values, L. loa MFD decreased sharply within the week after treatment, with reduction rates of about 60%, 75%, and 85% on D1, D2, and D7, respectively (Figure 3). The minimum MFD, corresponding to about 90% reduction of pretreatment value, was reached 3 weeks after treatment, with the MFD remaining substantially decreased until D365. At this latter date, the MFDs of individuals from quartiles 1, 2, 3, and 4 were reduced, on average, by 65.3% (95% confidence interval [CI], 31.9%–98.7%), 72.5% (95% CI, 52.5%–92.6%), 81.2% (95% CI, 76.4%–85.9%), and 83.3% (95% CI, 79.9%–86.7%), respectively.
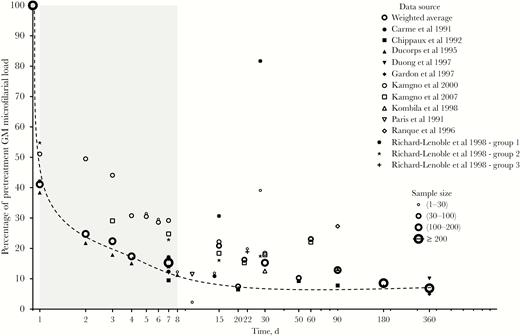
Weighed geometric mean of Loa loa microfilarial density after ivermectin treatment. The dashed line is a hand drawing representing the average trend in microfilarial density.
Complete disappearance of L. loa microfilaremia was not observed before D4 (0/124 on D1, 0/122 on D2, 0/153 on D3, and 2/118 on D4). The proportion of individuals with undetectable L. loa microfilaremia subsequently fluctuated between 20% and 75% from D15 to D365 in the lowest L. loa density group (<167 mf/mL) but remained very low in the higher L. loa density group throughout the follow-up period.
At D0, 666 individuals presented strictly less than 20 000 mf/mL, a threshold that has been used for implementing safe treatment with ivermectin using a “test and treat” approach in an area where onchocerciasis is co-endemic with loiasis [22]. No individuals presented an L. loa MFD above this value at any time after treatment (Figure 2A). A group of 199 microfilaremic individuals with MFD <20 000 mf/mL at D0 were re-examined 1 year after treatment; their MFD ranged from 0 to 13 160 mf/mL after a median decrease (interquartile range [IQR]) of 95.1% (75%–100.0%) (Figure 2A).
At D0, 181 individuals presented at least 20 000 mf/mL. One year after treatment, 57 of those individuals were re-examined; their MFD ranged from 0 to 34 540 mf/mL following a median decrease (IQR) of 89.6% (75.2%–94.2%). Thirty-five (61.4%) and 21 (36.8%) had an MFD below 8000 mf/mL and between 8000 and 20 000 mf/mL, respectively. Only 1 individual (1.3%) still presented an MFD above 20 000 mf/mL despite a significant decrease from 74 140 to 34 540 mf/mL (Figure 2B).
Ninety individuals were amicrofilaremic at baseline, among whom 39 were reexamined at D180 and 51 others at D365. At each of these time points, only 1 subject was found microfilaremic (1/39 and 1/51), both of them with an MFD of 20 mf/mL.
Effect of Individual Factors on the Dynamics of L. loa MFD
The regression model using the data collected from D1 to D7 indicated that, on average, the level of MFD after ivermectin is positively correlated with the pretreatment level (quartile effect all significant in Table 2, Figure 4); however, the dynamics of MFD over this period of time did not depend on the pretreatment level (P = .313, .178, and .521 for the second, third, and fourth quartiles, respectively) (Table 2), and the decrease rates were similar in the 4 quartiles. The MFD reduction rate increased minimally with age (P = .012) and did not differ between sexes.
Multilevel Regression of Loa loa MFD Over the First Week of Treatment
| D0-D7 | Coef. | 95% CI Lower Limit | 95% CI Upper Limit | P |
|---|---|---|---|---|
| Time, d | –0.2370 | –0.3924 | –0.0815 | .003 |
| Quartile of pretreatment density (ref: 0–166 mf/mL) | ||||
| 167–3139 mf/mL | 3.2746 | 2.0505 | 4.4986 | .0001 |
| 3140–16 179 mf/mL | 5.3553 | 4.1415 | 6.5691 | .0001 |
| 16 180–198 660 mf/mL | 7.0997 | 5.8848 | 8.3146 | .0001 |
| Pretreatment density × time | ||||
| 167–3139 mf/mL × time | 0.0847 | –0.0800 | 0.2493 | .313 |
| 3140–16 179 mf/mL × time | 0.1133 | –0.0514 | 0.2780 | .178 |
| 16 180–198 660 mf/mL × time | –0.0541 | –0.2193 | 0.1111 | .521 |
| Sex (ref: females) | –0.1569 | –0.4227 | –0.1089 | .0247 |
| Age | –0.0113 | –0.0201 | –0.0025 | .012 |
| Constant | 3.3148 | 2.0809 | 4.5487 | .0001 |
| Random effect (SD) | Estimate | 95% CI Lower Limit | 95% CI Upper Limit | |
| Study | 0.1403 | 0.0291 | 0.6752 | |
| Individual | 1.0105 | 0.9040 | 1.1297 | |
| Residual | 0.6213 | 0.5797 | 0.6659 |
Abbreviations: CI, confidence interval; MFD, microfilarial density.
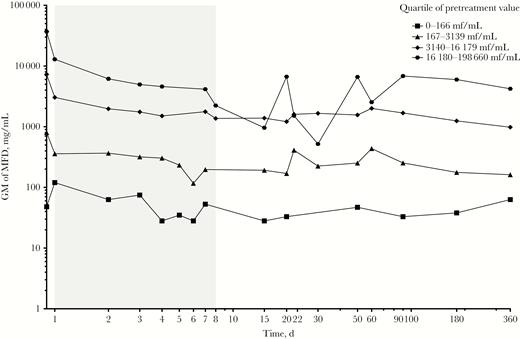
Geometric mean of Loa loa microfilarial density after ivermectin treatment in the 4 different quartiles of pretreatment density. Abbreviations: GM, geometric mean; MFD, microfilarial density.
Intraclass correlations indicate that only 1.4% of the total variance in L. loa MFD is explained by an interstudy effect and that 71.6% is explained by interindividual variations. Of note, when the quartile of pretreatment L. loa MFD was not included in the model, the fraction of variance explained by interindividual variation was barely affected (72.2%), indicating that the variability around the post-treatment value is not correlated with the pretreatment value.
When applied to the following period (D8 to D360), the regression model indicated that L. loa MFDs remain stable in patients belonging to 3 of the pretreatment MFD categories. Only individuals belonging to the second quartile (167–3139 mf/mL) showed a slight but significant (P = .004) decrease of approximately 1.5% when compared with the reference group (Table 3, Figure 4). The part of the total variance explained by interstudy variation was negligible, whereas that explained by interindividual variations was 74.4%. When the quartile of pretreatment L. loa MFD was not included in the model, the fraction of variance explained by interindividual variation increased to 80.4%, indicating again a weak association between the variability around the post-treatment MFD and the level of initial MFD.
Multilevel Regression of Loa loa MFD Over the Period D8–D365 After Treatment
| D8-D360 | Coef. | 95% CI Lower Limit | 95% CI Upper Limit | P |
|---|---|---|---|---|
| Time, d | –0.0003 | –0.0026 | 0.0020 | .809 |
| Quartile of pretreatment density (ref: 0–166 mf/mL) | ||||
| 167–3139 mf/mL | 3.8833 | 3.1102 | 4.6563 | .0001 |
| 3140–16 179 mf/mL | 6.7864 | 6.0258 | 7.5470 | .0001 |
| 16 180–198 660 mf/mL | 8.3234 | 7.4741 | 9.1726 | .0001 |
| Pretreatment density × time | ||||
| 167–3139 mf/mL × time | –0.0044 | –0.0074 | –0.0014 | .004 |
| 3140–16 179 mf/mL × time | –0.0020 | –0.0050 | 0.0011 | .216 |
| 16 180–198 660 mf/mL × time | –0.0019 | –0.0051 | 0.0013 | .251 |
| Sex (ref: females) | 0.0363 | –0.2337 | 0.3063 | .792 |
| Age | 0.0024 | –0.0057 | 0.0104 | .565 |
| Constant | 0.4417 | –0.2698 | 1.1533 | .224 |
| Random effect (SD) | ||||
| Study | 0 | 0 | 0.3757 | |
| Individual | 1.5937 | 1.4803 | 1.7159 | |
| Residual | 0.9353 | 0.8520 | 1.0267 |
Abbreviations: CI, confidence interval; MFD, microfilarial density.
Two latent classes were identified from latent trajectory modeling. Latent class 1 comprised 50.8% of all included individuals, and their median pretreatment L. loa MFD (IQR) was 480 (100–2240) mf/mL. Latent class 2 comprised 49.2% of individuals, and their median pretreatment L. loa MFD (IQR) was 17 780 (8676–35 582) mf/mL. During the first week after treatment, the mean trends of L. loa MFD for both latent classes were similar. After the first week, the trends were different between the 2 latent classes: MFD tended to increase over time for latent class 2, whereas the MFD for latent class 1 remained stable and low over this period (Figure 5). The MFD reduction rate was positively and significantly associated with age in latent class 1 but was not associated with age in latent class 2 (Table 4). Pretreatment MFD was the only individual factor significantly associated with the probability of belonging to one or the other latent class; individuals from the first and second quartiles of pretreatment L. loa MFD were more likely to belong to latent class 1 than individuals from the upper quartiles (Table 5).

Predicted and observed geometric mean of Loa loa microfilaremia. Predicted geometric means were obtained using a latent trajectory model with 2 latent classes. Solid lines: observed geometric mean of L. loa microfilarial density. Dashed lines: predicted geometric mean of L. loa microfilarial density.
Characteristics Associated With Loa loa MFD Evolution After Ivermectin Treatment in Each Latent Class
| Microfilaremia at Initiation | Coefficient | 95% CI | P |
|---|---|---|---|
| Class 1 | |||
| Age | –0.04 | (–0.05 to –0.03) | <.001 |
| Time | 1.81 | (0.29 to 0.33) | .02 |
| Time2 | –1.16 | (–2.23 to 0.09) | .03 |
| Time3 | 3.50 | (–0.72 to 7.74) | .1 |
| Time × age | –0.06 | (–0.09 to 0.02) | .003 |
| Time2 × age | –0.04 | (–0.07 to 0.01) | .002 |
| Time3 × age | –0.16 | (–0.26 to 0.05) | <.001 |
| Class 2 | |||
| Age | 0.001 | (–0.01 to 0.01) | .76 |
| Time | –1.84 | (–2.62 to 1.06) | <.001 |
| Time2 | –1.9 | (–2.53 to 1.28) | <.001 |
| Time3 | 1.10 | (–1.34 to 3.55) | .38 |
| Time × age | 0.03 | (0.01 to 0.05) | .004 |
| Time2 × age | –0.01 | (–0.03 to 0) | .06 |
| Time3 × age | –0.04 | (–0.1 to 0.02) | .27 |
Abbreviations: CI, confidence interval; MFD, microfilarial density.
Risk Factor Associated With Each Latent Class (Reference Class 2)
| Risk Factor | OR | 95% CI | P |
|---|---|---|---|
| Microfilaremia at initiation | |||
| 0–167 | 6124 | (699 to 53 630) | <.001 |
| 168–3139 | 1236 | (138 to 11 121) | <.001 |
| 3140–16 179 | 1.8 | (0.55 to 5.9) | .33 |
| 16 180–198 660 | 1 | ||
| Male | 0.7 | (0.25 to 2.17) | .58 |
| Age | 1 | (0.95 to 1.03) | .62 |
Abbreviations: CI, confidence interval; OR, odds ratio.
DISCUSSION
The first trials of ivermectin on L. loa were conducted after demonstration of the high effectiveness and safety of ivermectin against onchocerciasis. All trials conducted so far have been unanimous in proving the high microfilaricidal efficacy of a single standard dose of ivermectin on L. loa. However, although the very first trials [14, 19, 21] concluded the total acceptability and safety of ivermectin for treatment of loiasis, subsequent trials warned about [13]—or confirmed [15]—the possible occurrence of SAEs in individuals with very high L. loa microfilaremia. In 1997, the risk threshold for postivermectin Loa-related SAEs was estimated to be 30 000 mf/mL [23]. The database gathered to conduct the analyses presented in this paper is therefore unique as it includes a large number of individuals with a known pretreatment L. loa MFD as part of a trial or individual treatment.
Ivermectin starts acting within hours of intake and, in some individuals, total clearance is observed within 4–5 days. This rapid disappearance of a proportion of microfilariae suggests a direct effect of the drug on L. loa mf. Although the mode of action of ivermectin on L. loa has not been specifically addressed, this drug is known to act on helminths by altering neuromuscular functions, resulting in paralysis of the parasite [24]. Clinical description of postivermectin SAEs indicates that some embolization processes occur at the cerebral level, pointing out that mf exposed to ivermectin are indeed paralyzed and accumulate in microcirculation rather than being rapidly cleared from the bloodstream. Besides this, it has been demonstrated that ivermectin treatment induces a passage of the mf from the blood into the urine and the cerebrospinal fluid [8, 15], which could lead to the occurrence of adverse events.
Analysis of aggregated data indicate that, on average, MFD is reduced by 90% a few weeks after treatment and that this decrease is sustained for at least a year. Analysis of individual data shows some heterogeneity in the dynamics of MFDs after ivermectin treatment. It is important to note that interstudy heterogeneity was found to be minimal compared with interindividual heterogeneity, suggesting little if any study-related bias in the data, and that we could pool the data together to conduct multivariate analyses.
Multivariate regression indicated that the MFD reduction rate during the first week after treatment was very homogeneous; average MFD was weakly (positively) correlated with pretreatment value, but the evolution between D1 and D8 was similar and showed little variation across the different quartiles of initial MFD. In other words, all MFDs were drastically and very rapidly reduced regardless of their pretreatment value.
After 1 week, the Loa MFD remained positively correlated with the pretreatment value and remained low up to 1 year after treatment. This dependence on the initial MFD value was confirmed by latent class modeling, which demonstrated that the data are consistent with the existence of 2 distinct individual profiles: (1) individuals with low initial MFDs and whose MFDs were sustainably reduced for at least 1 year and were frequently below the threshold of detectability and (2) individuals with higher initial MFDs, whose post-treatment MFDs were higher than in the first group and tended to increase very slightly over time. The main result from an epidemiological perspective is that even individuals in the highest MFD quartile still had their MFD reduced by about 85% 1 year after treatment.
As with observed effects on O. volvulus, the microfilaricidal effect of ivermectin on L. loa MFD is only partial. Indeed, total clearance of L. loa microfilaremia was nearly entirely observed in individuals with low L. loa microfilaremia. This indicates that a proportion of microfilariae would escape the effect of the drug. Whether it is due to a suboptimal exposure to the drug, related to parasite sensitivity to the drug, or related to another kind of mechanism should be investigated.
To date, there are no markers to estimate the number of L. loa adult worms harbored by a given individual, and the effects of ivermectin on the parasite rely mainly on the dynamics of L. loa MFD after treatment. This is the result of (1) the microfilaricidal effect of the drug (and marginally the natural death of mf) and (2) the production and release of new mf by fertilized adult female worms. From results obtained in an L. loa/baboon experimental model, it was estimated that a single female adult worm can produce between 12 000 and 39 000 mf per day [25]. The fact that MFD remains at a very low level for several months after ivermectin treatment could therefore potentially be the result of any of the following 4 processes acting separately or in synergy: (1) a temporary or permanent cessation of mf production (embryogenesis) by the female worms, (2) a long-lasting cessation of the release of mf (embryostatic effect), (3) an increased efficacy of the immunological response leading to an increased destruction of the released mf, and (4) a partial macrofilaricidal effect. Unfortunately, no attempt has been made to collect adult worms migrating under the conjunctiva in patients who have received ivermectin recently. The examination of such worms might help to assess whether the embryostatic effect of ivermectin seen in O. volvulus also exists for L. loa. Whether the frequency of “eyeworm” episodes decreases after ivermectin treatment has also never been investigated. Given these uncertainties, mathematical modeling similar to that conducted for O. volvulus [26] might be useful to assess the respective role of each of the possible effects of ivermectin on L. loa.
Based on the observed MFD dynamics after a first ivermectin treatment, one could expect that community-directed treatment with ivermectin (CDTI) could have a significant and rapid impact on the transmission of L. loa. One year after a first ivermectin treatment, the MFD of most individuals should be reduced to such low levels that an additional treatment with ivermectin might result in mf clearance. A study conducted in Cameroon whose objective was to compare entomological indicators measured in 2000 and 2012 in an area benefitting from annual CDTI showed that the infection rates of Chrysops had decreased significantly but that the infective rates and mean number of L. loa infective larvae per infective fly did not differ significantly between the 2 investigation periods [27]. We assume that this result, which was unexpected given the promising observations made in another area treated with ivermectin every 3 months [28], might be due to a relatively low therapeutic coverage (see figures reported by the National Programme for Onchocerciasis Control in [27]) or to a high proportion of individuals who never take the drug because of fear of SAEs. The latter parameter was not assessed during the aforementioned study (in Kokodo [27]). However, in a health district (Yabassi) located some 200 km west of Kokodo and where the endemicity levels for loiasis were lower, the proportion of individuals who had never taken ivermectin during the last 5 MDAs was 15.4% (95% CI, 11.5%–20.5%) [29]. The proportion of systematic noncompliers might have been higher in Kokodo than in Yabassi.
This fear of SAEs could be overcome using a test-and-treat strategy during which the MFD of every participant is assessed before treatment. Such a strategy typically leads to the exclusion of less than 3% of the population from ivermectin treatment [22]. Given the phenomenon of increased Chrysops mortality after ingesting a high number of mf [30, 31], the possibility that those few individuals constitute a group of super-spreaders enabling widespread maintainance of L. loa transmission in the community should be assessed.
In individuals with L. loa microfilaremia, ivermectin is highly efficacious: a single oral dose is able to drastically and rapidly reduce the MFD, leading to reductions that are sustained for at least a year. In onchocerciasis-hypoendemic areas where CDTI cannot be implemented but where a test-and-treat strategy can be applied, our results indicate that individuals treated with ivermectin do not need to be retested for L. loa 1 year later, during the next test-and-treat campaign. Testing only those who did not receive ivermectin 1 year before would have a huge impact on lowering the costs of the campaign, which could reach very low levels after several years. In onchocerciasis-meso-hyperendemic areas, CDTI has been in place for many years, but one of the main challenges is to convince the systematic noncompliers (who can represent up to 20% of the total population) to take ivermectin treatment. The data presented here might help program managers to develop specific messages directed toward this subpopulation. By highlighting that (1) ivermectin is very effective against the parasite inducing the SAEs, (2) that the drug received for many years by the population has reduced the transmission of this parasite and thus the infection intensity and the risk of SAEs in the whole population, and (3) that a single test just before ivermectin treatment would ensure that, if they are below a given threshold, they would not need to be retested every year, managers would have strong arguments that could convince at least a proportion of people systematically refusing treatment.
Presently, control of loiasis is not considered a priority, even if evidence is emerging that this disease is a significant public health problem [11]. Our results suggest that ivermectin distribution, should a good coverage be achieved, might have a significant impact on reducing L. loa transmission and help decrease the burden related to loiasis. More information is needed to evaluate to what extent this is true. Measuring L. loa infection levels systematically during impact assessment surveys for onchocerciasis and LF programs would provide data useful to refining the parameters of the L. loa transmission models that are currently being developed.
Acknowledgments
Financial support. As a literature review and meta-analysis, this study did not receive any funding.
Potential conflicts of interest. All authors: no reported conflicts of interest. All authors have submitted the ICMJE Form for Disclosure of Potential Conflicts of Interest. Conflicts that the editors consider relevant to the content of the manuscript have been disclosed.
References
APPENDIX
AVERAGE TREND ANALYSIS OF LOA LOA MICROFILARIAL DENSITY AFTER IVERMECTIN TREATMENT
where nti is the sample size (number of participants) at time t of study i; kt is the number of studies that reported MFD at time t; and Nt is the total number of patients eligible for analysis at time t (the sum of sample sizes across kt studies). The weighting by the sample size implicitly assumes that all studies in the analysis had the same underlying variance for changes in the MFD.
LATENT CLASS MODELING TO TEST FOR THE EXISTENCE OF DIFFERENT GROUPS OF RESPONDERS
where f(.,) function f represents orthogonal polynomials of degree ≤5 of time ti; ail is the parameters vector of the orthogonal polynomial for latent class l, l = 1,…,k; ui is the vector of individual parameters; and ei is the vector of residuals.
We examined the stability of the latent classes determined when the covariates were successively added to the model. Indeed, the addition of significant covariates to the model did not widely modify the percentage of subjects in each trajectory.
Table A1. Hypothetical Results for Determination of the Optimal Number of Latent Classes Using BIC
| Models | BIC | Percentage of Sample Size Per Class Based on Most Likely Class Membership |
|---|---|---|
| Model with 1 class without covariate | 11 386.13 | 100/0 |
| Model with 2 latent classes without covariate | 10 058.23 | 55.2/44.8 |
| Model with 3 latent classes without covariate | 10 437.2 | 53/20.9/26.1 |
| Model with 4 latent classes without covariate | 10 220.8 | 39.7/24.6/17.7/17.9 |
| Model with 2 class with covariate (final model) | 8992.4 | 50.9/49.1 |
The model without a covariate with the lowest BIC was the model with 2 latent classes. Thus the optimal number of latent classes chosen was 2 latent classes. When we added a significant covariate in the model, we observed little variation of the percentages of subjects in each latent class: 7.1% of the subjects were reassigned from latent class 1 to latent class 2, and 2.8% of the subjects were reassigned from latent class 2 to latent class 1.
The second step consisted of estimating, for each individual, (1) the probability of belonging to each latent class by maximum likelihood estimation and (2) the latent trajectory of MFD over time in each homogeneous latent cluster. The model estimated the membership probabilities for each patient, and a unique latent trajectory was assigned to each patient based on the maximal membership probability. This model assumes that repeated observations of the same individual are independent, conditional on latent trajectory, meaning that the within-person correlation structure is explained completely by the estimated trajectory curve for each person in a given latent cluster. The association between the probability of belonging to each latent class and individual risk factors, namely age, sex, and initial microfilaremia, was assessed by logistic regression. Different models were fitted and compared with the BIC. This analysis was performed using the latent classes mixed model (lcmm) package from R-Cran software [32].
Abbreviation: BIC, Bayesian Information Criterion.


Comments