


Abstract
Integrase strand transfer inhibitors (INSTI) have been associated with weight gain, but their effect on short-term overweight and obesity incidence, blood pressure (BP), and metabolic markers has not been described in treatment-naïve people with HIV(PWH).
Medical records of treatment-naïve persons starting antiretroviral therapy (ART) at the HIV Clinic of University Hospital of Elche, Spain, between January 2007 and July 2019 were reviewed retrospectively. Standard procedures included measurements of weight, BP, and metabolic assessment. Data at baseline, 48, 72, and 96 weeks post ART initiation were analyzed. We used Cox mixed-effects model to generate predictions of body mass index (BMI) over time and generalized additive mixed models to relax the linearity assumptions and generate 95% confidence intervals in the multivariable adjustment.
Among 219 (median age, 44.0 years; interquartile range [IQR], 37.0–53.5; 46 females) participants. Baseline weight mean (standard deviation) was 70.4 (13.7) kg without difference between regimens; 66% had a BMI <25 kg/mt2. The incidence of overweight and obesity was significantly greater in persons starting INSTI-based regimens: 15 (36.6%) of 41 patients treated with INSTI versus 30 (28.9%) of 104 treated with other ART regimens (hazard ratio, 2.3; 95% CI, 1.2–4.4; P = .011). In contrast to other ART regimens, patients treated with INSTI showed a significant increase in systolic BP (SBP) (adjusted increase, 7.0 mmHg; 95% CI, 0.3–13.7; P = .039) that was correlated with weight gain (r = 0.13; 95% CI, 0.10–0.16; P < .001). Patients who reached overweight and obesity in INSTI-based ART showed a significant increase in LDL cholesterol.
Integrase strand transfer inhibitors-based ART was associated in the short-term with a greater risk of overweight and obesity and SBP elevation. Patients developing overweight and obesity increased low-density lipoprotein cholesterol with no other metabolic disturbances.
INTRODUCTION
Integrase strand transfer inhibitors (INSTI) have been associated with weight gain [1–3], but it remains unknown if this effect leads to clinically significant changes in body weight or increases the risk of metabolic and cardiovascular diseases. Compared with the general population, the rate of acute myocardial infarction is estimated to be double and the risk of cardiovascular death increases up to 4.5 times in people with HIV (PWH) with traditional cardiovascular risk factors [4, 5]. Small increments in body mass index (BMI) have been linked to a 2-fold increase in the risk of developing congestive heart failure in the long term [6]; therefore, abrupt increases in BMI, even without reaching obesity and after change from a normal weight to overweight status, could be considered deleterious and strongly associated with all-cause mortality [7]. In addition, changes in BMI have an independent effect on arterial blood pressure (BP), potentially contributing to the development of major cardiovascular events, especially stroke, which is strongly associated with systolic blood pressure (SBP) [8–12]. Recent observational data suggest that obesity after antiretroviral therapy (ART) initiation may be frequent [3], particularly in women and subjects with lower baseline CD4+ T lymphocyte counts and lower baseline BMI [13–17]. A number of cohort studies have shown statistically significant increases in body weight and BMI following initiation of ART with different ART regimens [2, 3, 18] and have reported greater weight gains with INSTI- compared with non-INSTI–based regimens, including increased visceral fat [19–21]. Inflammatory markers have been measured and linked with body weight changes, suggesting that weight gain following ART initiation in overweight and obese populations predicts an increase in the inflammatory status [22]. In a Brazilian cohort, the development of obesity was 7 times more likely in PWH who started ART with an INSTI-based regimen than in those who started a nonnucleoside reverse-transcriptase inhibitor (NNRTI) or protease inhibitor (PI)-based ART [3]. In the Vanderbilt cohort, which compared the weight gain in treatment-naïve PWH who started INSTI, NNRTI, and PI-based ART, a dolutegravir-based regimen was associated with a greater weight gain than the other regimens, even amongst INSTI drugs [21]. In the same cohort, within virologically suppressed PWH on efavirenz (EFV)-based regimens, people who switched to INSTI-based ART gained more weight compared with those remaining on EFV-based ART [2]. Mechanisms explaining the association between INSTIs and weight gain and its clinical implications, such as the potential metabolic and cardiovascular consequences, are currently unknown.
In this study, we analyzed data from patients initiating ART therapy in a single medical center since the introduction of INSTI. The study aimed specifically to compare changes in body weight after ART initiation with different ART regimens and to explore their effects on BP and on different metabolic markers, including fasting blood glucose, lipid panel, and hepatic steatosis indexes.
METHODS
We conducted a retrospective database analysis of all treatment-naïve HIV-infected adults (age ≥18 years) enrolled in the outpatient clinic of the University General Hospital of Elche (Spain), who initiated ART between January 1, 2007, and July 11, 2019. Standard procedures in the clinic throughout the study period included measurement of BMI, BP, and metabolic assessment at cohort entry and at each visit.
Collected data included history of hypertension and diabetes, HIV acquisition mode, date of ART initiation and ART regimen, baseline CD4+ and CD8+ T cell count, plasma HIV-1 RNA, fasting blood glucose (FBG), serum alanine aminotransferase (ALT), serum aspartate aminotransferase (AST), low-density lipoprotein (LDL) cholesterol, high-density lipoprotein (HDL) cholesterol, triglycerides before and after ART initiation at every timepoint, triglyceride and glucose index (TyG), and hepatic steatosis index (HSI). Measurements from 10 weeks before ART initiation to the day of ART initiation were used to define baseline levels and the nearest measurement (with a window period of up to 10 weeks) were used for each timepoint of analysis. Triglyceride and glucose index was calculated by the formula Ln (fasting triglyceride [mg/dl] × fasting plasma glucose [mg/dl]/2) and HSI as (8 × [ALT/AST ratio] + BMI [+2, if female; +2, if diabetes mellitus]). Weight was measured at routine clinic visits using a single measurement on the same mechanical scale and BP by a validated automatic sphygmomanometer. Body mass index (defined as weight in kilograms/height in meters squared) was calculated for each patient using the first height and the weight registered within a period from 10 weeks before ART initiation to the day of ART initiation. Net weight gain was defined as the difference between each subsequent weight measurement and the baseline weight; each subsequent weight measurement and baseline height were used to calculate BMI and its changes, defining normal weight as a BMI of 18.5 to 24.9 kg/mt2 and overweight and obesity as a BMI ≥ 25 kg/mt2. The absolute change of BP was defined as the difference between each subsequent BP and the baseline BP, both expressed in mmHg. Impaired fasting glucose was defined as FBG ≥ 100 and <126 mg/dl, insulin resistance was defined as a TyG > 4.68 and nonalcoholic fatty liver disease (NAFLD) when this index was above 8.5 or an HIS > 6.
Demographic, clinic, and laboratory information was saved in the same electronic database, including the date of the beginning and the end date of each treatment. Research staff systematically obtained and assessed laboratory and clinical data of each enrolled patient. For all of the analyses, we excluded patients in which weight, height, and BP data have not been collected at least 10 weeks before ART initiation, patients who switched to another ART regimen at any timepoint of the study, and women who were pregnant or became pregnant during the study period. Patients with diagnosis of hypertension at baseline were excluded from the BP analysis.
To register the change of defined variables in visits at 48, 72, and 96 weeks after the beginning of ART, we used weight and BP variables with a maximum of 10 weeks before and after each visit, as well as for CD4+ and CD8+ T cell count, plasma HIV-1 RNA, FBG, ALT, AST, and lipid panel.
The study was approved by Ethics Committee of the University General Hospital of Elche, and the requirement for an informed consent was waived. All patient personal information was anonymized prior to analysis.
Statistical Analysis
We compared demographic variables and baseline characteristics among ART regimens, dividing them into INSTI and non-INSTI groups of treatment. For comparisons between categorical variables in the 2 groups, we used χ 2; continuous variables were compared using t test for independent samples and the Wilcoxon rank sum test as applicable. To contrast the increase in net weight compared with the initial weight and to compare the increase of BP among different ART regimens at 48, 72, and 96 weeks post ART initiation, we used Mann-Whitney test for dependent variables; these variables were adjusted by age, sex, HIV acquisition mode, history of hypertension, baseline HIV-1 RNA and CD4 T-cell count, TDF (tenofovir disoproxil fumarate) backbone, baseline weight for weight gain analysis, and BMI for BMI change analysis, using generalized additive mixed models to relax the linearity assumptions and generate 95% confidence intervals (CIs). We conducted a subanalysis to compare the weight gain with each NNRTI, PI, and INSTI-based regimens and a sensitivity analysis restricting the comparisons with patients who started DTG.
We used the Cox mixed-effects model and dependent time covariables to generate risk estimators (hazard ratio [HR]) for overweight and obesity, adjusted by baseline characteristics mentioned above, and year of ART initiation to eliminate the bias of underlying trends, graphing the cumulative survival function by Kaplan Meir curves. Pearson correlation analysis was used to establish the correlation between weight gain and BP increase and a grade II polynomial model for graphing the predictions of SBP in treatment-time interactions. Significance level was set at 5% (P < .05). All analyses were conducted in R Core Team 2019, Vienna, Austria, version 3.6.0.
RESULTS
Baseline Characteristics
A total of 219 patients were included in the weight analysis; of them, 54 (24.7%) patients started ART on INSTI-based regimens; 45 (83.3%), 7 (13.0%), and 2 (3.7%) started dolutegravir, raltegravir, and elvitegravir, respectively. One hundred sixty-five (75.3%) patients started a different regimen to INSTI, of which, 79 (47.9%) started a PI- and 86 (52.1%) a NNRTI-based regimen. Tenofovir disoproxil fumarate and emtricitabine were the most frequent nucleoside backbone for NNRTI, PI, raltegravir-, and elvitegravir-based ART; for dolutegravir, abacavir/lamivudine was the most frequent. Most of PI-based regimens were ritonavir-boosted. Tenofovir alafenamide (TAF) backbone was not used in any regimen during the study period.
Baseline characteristics are presented in Table 1. Patients who started ART in INSTI-based regimens were younger than those starting with other regimens (mean age [±standard deviation {SD}]; 42.7 [11.1] vs 46.8 [11.2] years) and had lower ALT values. There was no difference among groups in the rest of the baseline characteristics. Baseline body weight (mean [±SD]) was 70.4 [13.7] kg, without difference among groups of ART regimens. Patients initiating INSTI-based and non-INSTI–based regimens started ART with a similar baseline Log10 HIV-1 RNA (mean ± SD), 4.9 (0.6) and 4.9 (0.8), respectively.
Baseline Characteristics by Group of Treatment
| Characteristics | INSTI-Based Regimen (n = 54) | Non-INSTI–Based Regimen (n = 165) | P value |
|---|---|---|---|
| Agea | 42.7 (11.1) | 46.8 (11.2) | .020 |
| Sex | |||
| Male, n (%) | 42 (77.8) | 131 (79.4) | .800 |
| Female, n (%) | 12 (22.2) | 34 (20.6) | |
| HIV acquisition mode | |||
| IDU, n (%) | 5 (9.3) | 29 (17.6) | .143 |
| Other, n (%) | 49 (90.7) | 136 (82.4) | |
| History of hypertension, n (%) | 9 (16.7) | 48 (29.1) | .071 |
| History of diabetes, n (%) | 3 (5.7) | 14 (8.5) | .505 |
| Heighta | 1.7 (0.1) | 1.7 (0.1) | .282 |
| Weight(kg)a | 70.1 (12.0) | 70.5(14.3) | .733 |
| BMI (kg/mt2)a | 23.5 (3.0) | 24.1 (4.5) | .865 |
| CD4+ T cell count (cells/μL)a | 276.8 (162.3) | 263.7 (173.3) | .408 |
| CD8+ T cell count (cells/μL)a | 789.2 (395.9) | 766.7 (441.4) | .441 |
| Log10 HIV-1 RNA (copies/mL)a | 4.9 (0.6) | 4.9 (0.8) | .875 |
| Fasting blood glucose (mg/dL)a | 88.1 (8.6) | 91.1 (26.9) | .111 |
| Triglycerides (mg/dL)a | 116.5 (57.6) | 133.6 (87.8) | .410 |
| HDL cholesterol (mg/dL)a | 40.5 (10.7) | 40.7 (14.1) | .472 |
| LDL cholesterol (mg/dL)a | 96.5 (23.9) | 102.0 (36.1) | .811 |
| ALT (UI/L)a | 29.1 (16.9) | 42.5 (38.8) | .007 |
| AST (UI/L)a | 29.4 (14.5) | 36.3 (29.8) | .097 |
| TyGa | 4.6 (0.2) | 4.6 (0.3) | .504 |
| HSIa | 32.1 (4.6) | 33.7 (5.7) | .157 |
| Systolic blood pressurea | 131.5 (19.7) | 135.2 (19.9) | .216 |
| Diastolic blood pressurea | 78.4 (12.3) | 82.4 (12.7) | .068 |
Abbreviaitons: ALT, serum alanine aminotransferase; AST, serum aspartate aminotransferase; HIS, hepatic steatosis index calculated using the formula (8 × [ALT/AST ratio] + BMI [+2, if female; +2, if diabetes mellitus]); IDU, injection drug use; INSTI, integrase strand transfer inhibitors; TyG, triglyceride and glucose index calculated using the formula Ln (fasting triglyceride [mg/dl] × fasting plasma glucose [mg/dl]/2).
aMean (standard deviation).
Weight Gain
A modest increase in body weight was observed in patients starting INSTI- and non-INSTI–based ART regimens that was not statistically different between groups. Patients starting INSTI-based regimens had a mean (± SD) weight gain of 2.7 (4.5) kg, 3.1 (5.4) kg, and 4.1 (5.7) kg at 48, 72, and 96 weeks post ART initiation, respectively. In the adjusted model, independent factors associated with weight gain at 48, 72, and 96 weeks after ART initiation were injection drug use (IDU) as category of HIV transmission (adjusted weight gain [95% CI] at 48, 72, and 96 weeks, 3.3 [1.0 – 5.7], 3.6 [1.1 – 6.1], and 4.2 [0.8 – 7.5], respectively); along with HIV-1 RNA >105 copies/mL and lower baseline CD4+-T cell count (Supplementary Table 1). The adjusted weight gain (95% CI) for the INSTI-based regimens at 48, 72, and 96 weeks post ART initiation was 0.5 (-1.6 – 2.7) kg, 0.3 (-1.8 – 2.4) kg, and 2.0 (-0.7 – 4.7) kg, respectively.
A subanalysis was performed to assess the weight gain with each class of antiretrovirals: INSTI, PIs, and NNRTIs (Supplementary Table 2). Patients starting INSTI gained greater weight than those initiating NNRTI-based regimens (mean [±SD] weight gain at 48, 72, and 96 weeks of 2.7 [4.5] kg vs 1.5 [5.6] kg [P = .565]; 3.1 [5.4] kg vs 1.7 [5.1] kg [P = .352]; and 4.1 [5.7] kg vs 0.9 [5.1] kg [P = .013], respectively) and nondifferent than patients starting PIs (mean [±SD] of 4.1 [7.5] kg [P = .493], 3.9 [6.2] kg [P = .668], and 4.7 [8.2] kg [0.990], respectively). In the sensitivity analysis, patients who started DTG gained greater weight than those initiating NNRT-based regimens (mean [±SD] of 2.3 [4.5] kg [P = .986], 2.2 [4.9] kg [P = .926], and 3.7 [5.5] kg [0.035], respectively; Supplementary Table 3).
Time to Reach the Overweight and Obesity
Figure 1 shows survival analysis to reach the overweight and obesity status according to ART regimen at a maximum time of 96 weeks of treatment. The incidence of overweight and obesity was significantly greater in patients starting INSTI-based ART and was reached sooner than with non-INSTI–based regimens (P = .011). Of the total population, 66.2% were enrolled with a BMI <25 kg/mt2, 41 patients with INSTI-based and 104 with non-INSTI–based regimens, of which, 15 (36.6%) and 30 (28.9%), respectively, changed their BMI category to overweight and obesity. In the Cox mixed-effects model, the risk of becoming overweight and obese was significantly higher among patients starting with INSTI-based regimens (HR, 2.3; 95% CI, 1.2 – 4.4; P = .011). The results of the adjusted model are shown in Table 2.
Factors Associated With the Development of Overweight and Obesity Post Antiretroviral Therapy Initiation
| Factor | Adjusted HR (95% CI) | P value |
|---|---|---|
| INSTI-based ART | 2.3 (1.2–4.4) | .011 |
| Baseline HIV-1 RNA >100 000 copies/mL | 1.4 (0.8–2.5) | .250 |
| Female | 1.1 (0.7–1.8) | .710 |
| IDU | 1.1 (0.6–2.0) | .810 |
| Baseline BMI | 1.2 (1.2–1.3) | <.001 |
| Baseline CD4+ T cell count | 1.0 (0.9–1.0) | .300 |
| CD4+ T cell count | 1.0 (1.0–1.1) | .670 |
| CD8+ T cell count | 1.0 (1.0–1.1) | .063 |
| Baseline CD4+/CD8+ T cell ratio | 0.8 (0.3–2.4) | .740 |
| Age | 1.0 (1.0–1.1) | .430 |
| Year of ART initiation | 0.9 (0.8–1.0) | .160 |
Abbreviations: ART, antiretroviral therapy; BMI, body mass index; CI, confidence interval; IDU, injection drug use; INSTI, integrase strand transfer inhibitors.
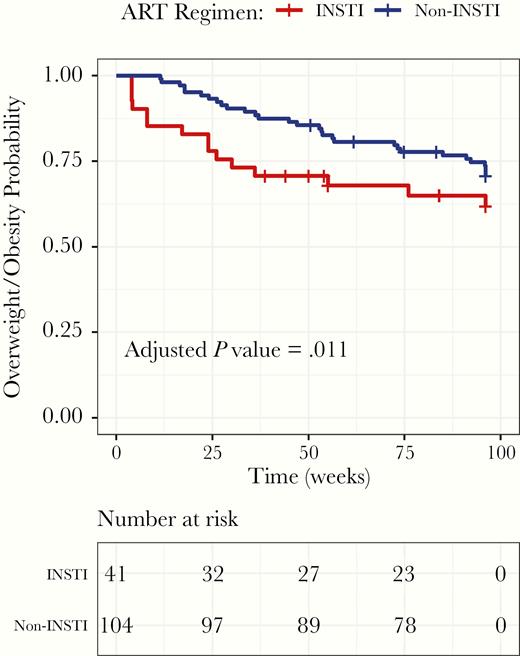
Kaplan-Meier Curve of Progression to Overweight and Obesity According to Antiretroviral Therapy Regimen Initiation ART indicates antiretroviral therapy; INSTI, integrase strand transfer inhibitors.
A higher risk of overweight and obesity also was seen in the sensitivity analysis (Supplementary Table 4) restricted to patients starting DTG-based regimens (HR, 3.6; 95% CI, 1.5 – 8.8; P = .006).
Change in Blood Pressure and Metabolic Parameters
Patients who started ART with INSTI-based regimens showed a significant increase in SBP in contrast to those who started non-INSTI–based regimens at 48, 72, and 96 weeks post ART initiation with no significant changes in diastolic BP. There was a weak positive linear correlation between weight gain and SBP increase (r = .13; 95% CI, 0.10–0.16; P < .001). In a multivariable model, independent factors significantly associated with elevation of SBP at 96 weeks were baseline BMI, IDU, female sex, and starting ART with INSTI-based regimens (Table 3). The adjusted estimated difference in SBP for starting with INSTI-based compared with non-INSTI regimens was 7.0 mmHg (95% CI, 0.3–13.7; P = .039; Figure 2). Supplementary Table 5 shows the changes in metabolic markers among patients initiating INSTI-based regimens who reached the overweight and obesity category and those who maintained a BMI < 25 kg/mt2. In contrast to those who did not reach the overweight and obesity status with INSTI-based regimens, patients who became overweight and obese had a significant increase in LDL cholesterol. No differences were found in fasting blood glucose, HDL cholesterol, triglycerides, hepatic steatosis index, and triglyceride and glucose index.
Multivariable Model for Factors Associated With Systolic Blood Pressure Elevation at 72 and 96 Weeks Post Antiretroviral Therapy Initiation
| Factor | Estimated Difference in SBP (95% CI) 72 weeks | P value | Estimated Difference in SBP (95% CI) 96 weeks | P value |
|---|---|---|---|---|
| INSTI-based ART | 5.4 (0.4–13.1) | .095 | 7.0 (0.3–13.7) | .039 |
| Baseline HIV-1 RNA >100 000 copies/mL | 3.7 (-5.8–6.9) | .260 | 5.0 (-1.5–11.4) | .130 |
| Female | 11.8 (4.2–19.7) | .002 | 8.5 (1.1–16.0) | .026 |
| IDU | 18.1 (-0.7–16.7) | <.001 | 11.4 (2.0–20.9) | .018 |
| Baseline BMI | 3.0a | .112 | 3.4a | .047 |
| Baseline CD4+ T cell count | 1.0a | .677 | 1.0a | .406 |
| Age | 2.4a | .162 | 1.4a | .489 |
Abbreviaitons: ART, antiretroviral therapy; BMI, body mass index; CI, confidence interval; IDU, injection drug use; INSTI, Integrase Strand Transfer Inhibitors; SBP, systolic blood pressure.
aNonlinear, adjusted by generalized additive mixed model.
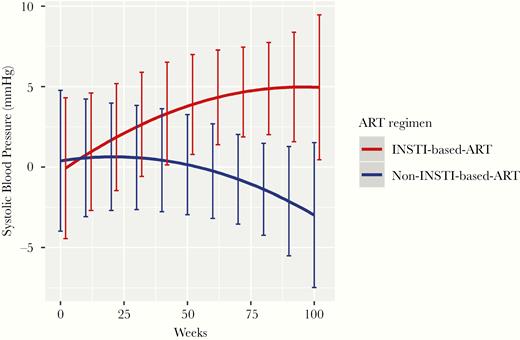
Predicted Systolic Blood Pressure Elevation Among Antiretroviral Therapy Regimens at 48, 72, and 96 Weeks Post Treatment Initiation ART indicates antiretroviral therapy; INSTI, integrase strand transfer inhibitors; P = 0.039 (at 96 weeks).
DISCUSSION
We confirmed a modest increase in body weight following initiation of ART. This is a well-described phenomenon that may be considered as a “return to health” effect of ART, and it has been associated with greater HIV disease severity and survival benefits for those who are not initially overweight [23, 24]. In our study, the increases in BMI were greater for patients with higher HIV plasma viral load and lower baseline CD4+ T cell count. In contrast to other studies [2, 21], the increase in body weight was not statistically different with INSTI- and non-INSTI–based regimens. The mean increase in body weight to week 96 was +4.1 kg with INSTI versus +2.7 kg with non-INSTI–based regimens. In the multivariate model controlling for age, sex, baseline body weight, CD4 count, plasma viral load, TDF backbone, and HIV transmission category, adjusted average weight gain at 96 weeks was greater with INSTI-based regimens, although that difference did not reach statistical significance. In the subanalysis conducted to establish the differences in weight gain among NNRTI, PI, and INSTI-based regimens, we found a greater weight gain in patients initiating INSTI-based ART compared with those starting an NNRTI regimen at 96 weeks, but we could not find any difference between INSTI- and PI-based regimens. However, patients starting with INSTI were significantly more likely to become overweight and obese than individuals given non-INSTI–based regimens. After 3 years on ART, a greater proportion of individuals on INSTI regimens with a normal BMI at baseline had become overweight and obese, supporting the association between use of INSTI and clinically significant weight gain found in recent observational studies [1, 3]. Patients starting ART with INSTI-regimens in our study were 2.3 times more likely to become overweight and obese during the study period than those initiating with non-INSTI–based regimens, and the results were similar when we restricted the analysis to patients starting dolutegravir.
Although some observational studies have suggested that weight gain following INSTI-based ART are more likely to occur among women, blacks and persons of older age [25], our adjusted model disclosed IDU as an independent factor associated with weight gain, along with inmunovirological markers of HIV disease severity. Indeed, after adjusting for multiple covariates, including baseline body weight, the estimated difference in weight gain at 48, 72 and 96 weeks after starting ART was largest in injection drug users. Although increases in BMI at 72 and 96 weeks tended to be greater in women, the differences were not statistically significant.
The greater weight gain observed in injection drug users during ART had not been reported previously and the potential mechanism behind this association is unknown. The use of illicit drugs put PWH at increased risk of weight loss [26] and has been associated with distinct inflammatory profiles in HIV-infected individuals under ART [27]. Therefore, ART might have differential effects in this particular HIV population. Previous studies had reported weight gain in injection drug users of up to 3 kg during the first 6 months after ART with larger increases in patients with more advanced HIV infection at baseline [28].
Although weight gain during ART has been shown to be beneficial among underweight individuals, it may be detrimental for those who are overweight or obese. A number of observational studies have reported an increasing prevalence of overweight and clinical obesity in HIV-infected patients starting ART [3, 14, 29], raising concerns for obesity-related complications, particularly cardiovascular events [30]. Indeed, in a multinational cohort study, weight gain among overweight and obese persons starting ART heightened systemic inflammation, [22] and, in the D.A.D. cohort, short-term gain in BMI after ART in individuals with pre-ART BMI in the normal range increased the long-term risk of cardiovascular events [31]. Nevertheless, it is still unclear whether the modest body weight gains following initiation of ART, as those observed in our study and in other cohorts, are clinically relevant, particularly if they have cardiometabolic implications. We addressed this critical question by analysing many metabolic parameters, including BP, FBG, lipid panel, and hepatic steatosis indexes. We did find an increase in LDL cholesterol in persons who became overweight and obese with INSTI-based regimens, but no associations of weight gain with other metabolic disturbances nor changes in nonalcoholic fatty liver indicators were found.
Interestingly, the study showed a significant increase in SBP at 96 weeks of ART initiation that was weakly correlated with weight gain, in accordance with a recent report of weight gain and increase of BP found in pretreated women who switched to INSTI-based ART [32]. The interaction of BMI and blood pressure has been long recognized. Changes in BMI have an independent effect on change in systolic and diastolic BP in both women and men, and people who increase their BMI are at increased risk for hypertension [8, 33]. The close association between BMI and BP recently have been confirmed in a large study across tens of thousands of individuals where the increase of BP per unit of BMI ranged from 0.8 to 1.7 mmHg/(kg/m2) [9]. Weight gain, however, does not explain completely the SBP elevation observed in our cohort. In addition to BMI, in the adjusted model, female sex (estimated difference in SBP [95% CI], 8.5 [1.1 – 16.0] mmHg), IDU (estimated difference in SBP [95% CI], 11.4 [2.0 – 20.9] mmHg) and initiating INSTI-based ART treatment (estimated difference in SBP [95% CI], 7.0 [0.3 – 13.7] mmHg) were independently associated with SBP elevation. Pathophysiological mechanisms other than weight gain explaining a potential link between exposure to INSTI and high BP are unclear. Available data suggest that the effect of antiretroviral drugs on BP appears to be mediated through an increase in BMI [34], but other mechanisms, such as endothelial damage [35] and activation of the renin-angiotensin system [36], could potentially be implicated. Both elevated SBP and excess BMI are established risk factors for cardiovascular disease [6, 10], being particularly important in the development of stroke, which is strongly associated with SBP [11, 12, 33].
The present study does have limitations, including single center and mostly male cohort, that limit the generalizability to other settings. The sample size was relatively small and even though we found a higher incidence of overweight and obesity associated to INSTI, the small number of patients taking INSTI other than dolutegravir prevented comparing the effect of different INSTI drugs and limited the number of analyses and adjustments we could perform. Therefore, our results only may be applicable to patients starting therapy with dolutegravir-based regimens. Finally, several lifestyle factors, such as nutritional habits, physical activity, and drug consumption that may have an effect on weight gain and SBP, were not collected. Unfortunately, neither data on waist circumference, dual-energy absorptiometry, or computed tomography nor biochemical markers that could mediate the effect of a specific ART regimen on BMI and SBP were unavailable for the analysis. Despite these limitations, the study informs further on the magnitude of weight changes in patients starting ART and on the lack of effects on several metabolic parameters and is the first to report changes in BP in patients starting with INSTI-based regimens, adding to the clinical relevance of INSTI-associated weight gain.
In summary, our findings highlight that INSTI-based ART among treatment-naïve PWH is associated in the short term with an elevation of SBP and with a greater risk of overweight and obesity than non-INSTI–based regimens. Patients developing overweight and obesity increased the LDL cholesterol with no other metabolic disturbances. Further research is needed to confirm our results and to understand the mechanisms and long-term clinical implications of these findings.
Supplementary Data
Supplementary materials are available at Open Forum Infectious Diseases online. Consisting of data provided by the authors to benefit the reader, the posted materials are not copyedited and are the sole responsibility of the authors, so questions or comments should be addressed to the corresponding author.
Acknowledgments
Financial support. This work was supported by the RD16/0025/0038 project as a part of the Plan Nacional R + D + I and cofinanced by ISCIII-Subdirección General de Evaluación y Fondo Europeo de Desarrollo Regional (FEDER), FIS [PI08/893], FIS [PI13/02256], FIS [PI16/01740], FIS [PI18/01861], Contrato de Intensificación de la Actividad Investigadora [INT 14/00207], Contrato Río Hortega [CM15/00187], and by FISABIO: FISABIO [UGP-14–197] and Contrato Predoctoral FISABIO 2015 [UGP-15–152].
Potential conflicts of interest. All authors: No reported conflicts of interest. All authors have submitted the ICMJE Form for Disclosure of Potential Conflicts of Interest. Conflicts that the editors consider relevant to the content of the manuscript have been disclosed.
References
Author notes
F. G. and M. M. contributed equally to this work.


Comments