


Abstract
Prior studies have used International Classification of Disease (ICD) diagnosis codes in administrative data to identify patients with infective endocarditis (IE) associated with intravenous drug use (IVDU). Little is known about the accuracy of ICD codes for IVDU-IE.
We used 2 previously described algorithms to identify patients with potential IVDU-IE admitted to 125 Veterans Administration hospitals from January 2010 through December 2018. Algorithm A identified patients with concurrent ICD-9/10 codes for IE and drug use during the same admission. Algorithm B identified patients with drug use coded either during the IE admission or during outpatient or other visits within 6 months of admission. We reviewed 400 randomly selected patient charts to determine the positive predictive value (PPV) of each algorithm for clinical documentation of IE, any drug use, IVDU, and IVDU-IE, respectively.
Algorithm A identified 788 patients, and B identified 1314 patients, a 68% increase. PPVs were high for clinical documentation of diagnoses of IE (86.5% for A and 82.6% for B) and any drug use (99.0% and 96.3%). PPVs were lower for documented IVDU (74.5% and 64.1%) and combined diagnoses of IVDU-IE (65.0% and 55.2%), partly because of a lack of ICD codes specific to IVDU. Among patients identified by algorithm B but not A, 72% had clinical documentation of drug use during the IE admission, indicating a failure of algorithm A to capture cases due to incomplete recording of inpatient ICD codes for drug use.
There is need for improved algorithms for IVDU-IE surveillance during the ongoing opioid epidemic.
Infective endocarditis (IE) associated with intravenous drug use (IVDU) is a morbid, costly, and difficult-to-treat condition [1, 2]. A recent study estimated that hospital costs for endocarditis in patients with drug dependence increased 18-fold in the state of North Carolina from 2010 to 2015, from $1.1 million $22.2 million [3]. This occurred in the context of a national epidemic of opioid abuse and increasing rates of IVDU [4, 5].
There is need for accurate case-finding algorithms to identify patients with IVDU-IE, both for epidemiologic surveillance and quality improvement applications. Prior studies relied on case-finding algorithms that used inpatient administrative data to identify patients with International Classification of Disease (ICD) 9 or 10 diagnosis codes for both IE and drug use [3, 6–9]. Some studies also included patients with codes for both IE and hepatitis C infection as a marker of potential IVDU [9, 10]. These algorithms suffered from at least 3 problems. First, ICD codes in administrative data may be entered in error and not accurately reflect diagnoses of IE and drug use made by clinicians during admissions (ie, “false-positive” ICD codes) [11, 12]. Second, there are no ICD 9 or 10 codes that are specific to intravenous drug use, requiring use of nonspecific codes for drug use that may occur by nonintravenous routes unrelated to IE (eg, oral or inhalational use) [10]. Thus, prior studies identified cases of drug use-associated IE but not necessarily IVDU-IE.
Third, prior studies that used state and national inpatient data were unable to examine the impact of including drug use diagnosis codes from outpatient encounters surrounding hospital admissions for patients with IE, leading to possible undercounting of IE cases potentially related to IVDU. ICD codes for drug use may not be recorded in administrative records for patients hospitalized with drug use–related infections. Using data from 3 states, Miller et al. found that rates of drug use–associated IE increased 48.6% when they included patients with inpatient or emergency department ICD codes for drug use in the 6 months before or after hospital admissions for IE, in addition to patients with concurrent drug use codes recorded during the IE admission [6]. This suggested that algorithms using drug use ICD codes from endocarditis admissions missed patients with drug use–associated IE because of patients failing to acknowledge drug use during the admission, providers failing to diagnose and document drug use in clinical notes, or coders failing to enter ICD codes for drug use in discharge records. In addition, most prior studies that used administrative data to identify IVDU-IE cases were unable to review patient charts, leaving the positive predictive values (PPVs) of these algorithms for cases of IVDU-IE uncertain.
To explore these issues, we analyzed national administrative data from the Veterans Administration (VA) health care system and conducted chart reviews to examine the performance of 2 algorithms for identifying patients with IVDU-IE. In contrast to prior studies, use of integrated VA administrative and electronic health record data allowed us to link multiple inpatient and outpatient care episodes for individual patients and to conduct chart reviews for patients admitted to hospitals across the nation to confirm diagnoses. Algorithm A identified patients with concurrent ICD 9/10 codes for IE and drug use during the same admission. Algorithm B identified patients who had drug use coded either during the IE admission or during outpatient or other visits within 6 months of admission. We compared the yields of each algorithm and explored reasons for “missed cases” using algorithm A (ie, cases missed by A but identified by B). We also determined the PPVs of each algorithm for clinical documentation of diagnoses of IE, any drug use, IVDU, and simultaneous documentation of IVDU-IE, respectively.
METHODS
Data Source and Case-Finding Algorithms
We obtained data from the Corporate Data Warehouse in Veterans Affairs Informatics and Computing Infrastructure (VInCI), including ICD codes assigned for all inpatient, outpatient, and emergency department encounters in VA care sites from January 1, 2010, through December 31, 2018. We identified all patients with an admission to inpatient medicine or surgery units with primary or other ICD codes for IE and examined data surrounding the first IE admission for each patient, ignoring subsequent admissions. Algorithm A identified patients with inpatient diagnosis codes for IE who also had any ICD codes for drug use (ie, opioid, amphetamine, cocaine, or sedative) recorded during the same admission, the algorithm used in many prior studies (Figure 1). Algorithm B identified patients with inpatient IE codes who had either a concurrent drug use code from the admission or drug use codes recorded in association with inpatient, outpatient, or emergency department encounters in the VA within 6 months before or after the IE admission. Patients identified by algorithm B but not A represented potentially missed cases of IVDU-IE using algorithm A.
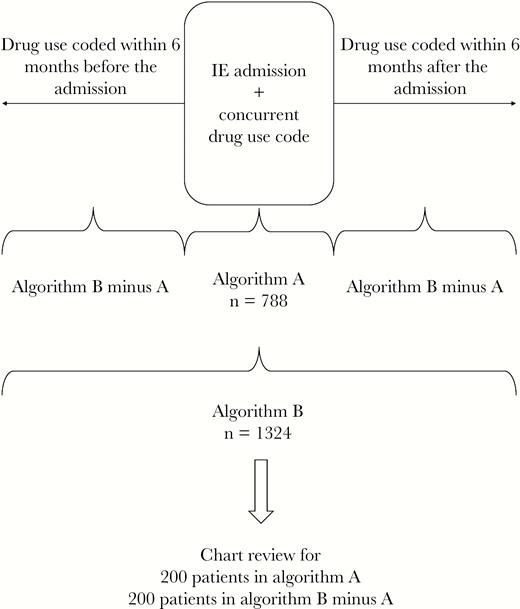
Summary of case-finding algorithms. Algorithm A: patients who had ICD codes for IE and drug use during the same admission. Algorithm B: patients who had IE and drug use codes either during the same admission or within 6 months of the IE admission. Abbreviations: ICD, International Classification of Disease; IE, infective endocarditis.
Some prior studies also identified patients with ICD codes for both IE and hepatitis C virus (HCV) infection as a marker of IVDU, in addition to patients with codes for IE and drug use, and also limited case finding to patients aged ≤55 because older patients may be more likely to develop endocarditis for age-related reasons unrelated to drug use [10]. We therefore created modified versions of algorithm B that also included patients with codes for both IE and HCV and stratified patients identified by this algorithm into those aged ≤55 and ≥56 to determine algorithm yields and PPVs by age. Supplementary Table 1 lists the ICD 9/10 codes used in this study.
IVDU-IE Incidence and Patient Characteristics
We determined the annual incidence of cases of IVDU-IE identified by each algorithm and created variables describing patient characteristics at the time of first IE admission, including age, sex, race/ethnicity, gender, and rural vs urban residence. We used ICD codes recorded in the year before the IE admission—but excluding codes from the admission—and the methods of Quan and Elixhauser to create indicator variables for comorbidities (ie, HIV infection, hepatitis B, hepatitis C, valvular heart disease, renal failure, alcohol abuse or dependence, depression, psychosis, and liver disease) [13]. Rural vs urban patient residence was determined using Rural Urban Commuting Area (RUCA) codes linked to ZIP codes [14].
We compared the characteristics of patients with drug use ICD codes recorded during IE admissions (ie, identified by algorithm A) with patients with drug use codes recorded within 6 months of IE admission but unrecorded during IE admissions (ie, missed by A but identified by B) using chi-square tests for categorical variables and Kruskal-Wallis tests for continuous variables. We fit a multivariable logistic regression model to determine associations between patient characteristics and the odds of being identified by algorithm B but not A using generalized estimating equations (GEEs) to account for clustering of patients in hospitals.
Chart Review and Determination of Positive Predictive Values
We randomly selected 200 patients with ICD codes for drug use during IE admissions (ie, identified by algorithm A) and 200 patients with drug use ICD codes from within 6 months of IE admissions but not during IE admissions (ie, identified by B but missed by A). We then used the VA’s Compensation and Pension Record Interchange (CAPRI) application to review the clinical notes in each patient’s electronic health record. CAPRI allowed complete access to charts from all VA care sites. We reviewed health care provider notes, nursing notes, mental health notes, and substance use care notes from the admission for IE and all encounters in VA care sites during the 6-month periods before and after the admission.
We extracted information from notes during the index admission to determine clinical documentation of diagnoses of (1) IE, (2) prior or current drug use by any route, and (3) prior or current drug use with documentation that use occurred by injection (IVDU), respectively. We also identified clinical diagnoses of drug use and IVDU documented in notes within 6 months of the admission for IE. Patients with clinically documented drug use but no documentation of IVDU were further categorized as having documentation of nonintravenous use only or no clear documentation of route of use. We classified drug use as either prior or current use because it was difficult to determine timing of use from clinical notes. Chart review was performed using an extraction sheet by an infectious disease fellow (T.K.).
We used findings from charts to calculate the PPV of each algorithm for clinically documented diagnoses of (1) IE during the index admission, (2) any clinically documented drug use in notes from the IE admission or encounters within 6 months, (3) IVDU documented in any notes, and (4) combined diagnoses of IVDU-IE, defined as clinical documentation of both IVDU and IE, a combination of #1 and #3. Confidence intervals were based on findings from sampled charts, assuming statistical independence of samples.
We examined the timing of clinical documentation of diagnoses of drug use for each of the 400 patients included in the chart review (ie, documentation in notes during the index IE admission or notes from encounters within 6 months of admission). We did this to explore whether patients with drug use identified by algorithm B but missed by algorithm A represented a failure by clinicians to diagnose and clinically document drug use during the IE admission or a failure to enter ICD codes for drug use in hospital discharge records when a clinical diagnosis of drug use was documented during the admission chart.
Finally, we conducted analyses to determine the sensitivity of findings to including ICD codes for HCV in algorithm B and the impact of restricting by patient age. We reviewed 100 charts for patients identified with the modified algorithm B including HCV diagnoses with age ≤55 and 100 for patients aged ≥56.
Statistical analyses were conducted using SAS Enterprise Guide, version 7.1 (SAS Institute, Cary, NC, USA). The institutional review board of the University of Iowa and the Research & Development Committee of the Iowa City VA Healthcare System approved this study.
RESULTS
IVDU-IE Incidence
There were 10 555 patients with a first hospitalization with ICD 9/10 codes for IE between 2010 and 2018 (Supplementary Table 2). Algorithm A identified 788 patients with potential IVDU-IE, and algorithm B identified 1314, a 68% increase (Figure 2). The incidence of hospitalizations for IE in the VA was relatively stable between 2010 and 2018 (1138 cases in 2010 and 1206 in 2018), but the proportion of IE cases with drug use diagnoses by algorithm B increased from 113 (9.9%) in 2010 to 168 (13.9%) in 2018.

Incidence of intravenous drug use–associated infective endocarditis in the national Veterans Affairs health care system, 2010–2018. Algorithm A: patients who had ICD codes for IE and drug use during the same admission. Algorithm B: patients who had IE and drug use codes either during the same admission or within 6 months of the IE admission. Abbreviations: ICD, International Classification of Disease; IE, infective endocarditis.
Characteristic of Patients With Algorithm A vs Algorithm B Minus A
Compared with patients with ICD codes for drug use entered during endocarditis admissions (ie, identified by algorithm A), patients with drug use codes only during visits within 6 months of admissions (ie, missed by A but identified by B) were older (median, age 67 vs 60 years; P < .001), more likely to live in rural areas (26.3% vs 18.1%; P = .002), and more likely to have diagnoses of renal failure (33.4% vs 22.9%; P < .001), psychosis (16.2% vs 12.2%; P = .038), and heart failure (34.9% vs 24.0%; P < .001) (Table 1). In a multivariable logistic regression model, factors associated with identification by algorithm B but not A were higher age (Table 1), rural residence (odds ratio [OR], 1.93; 95 CI, 1.49–2.52), and renal failure (OR, 1.44; 95% CI, 1.09–1.91).
Comparison of Patients Identified by Algorithm A and Patients Identified by Algorithm B But Missed by A (B – A)
| Algorithm A (n = 778) | Algorithm B Minus A (n = 536) | P Value | Multivariable ORa (95% CI) | |
|---|---|---|---|---|
| Age | ||||
| Median (IQR), y | 57 (46–63) | 60 (54–64) | <.0001 | |
| <35 y, No. (%) | 104 (13.4) | 26 (4.9) | Ref | |
| 35–49 y, No. (%) | 126 (16.2) | 41 (7.6) | 1.29 (0.76–2.2) | |
| 50–64 y, No. (%) | 426 (54.8) | 345 (64.4) | 3.34 (2.04–5.47) | |
| 65–79 y, No. (%) | 118 (15.2) | 110 (20.5) | 3.78 (2.18–6.57) | |
| 80+ y, No. (%) | 4 (0.5) | 14 (2.6) | 12.73 (3.97–40.81) | |
| Missing, No. (%) | 0 (0) | 0 (0) | ||
| Residence, No. (%) | ||||
| Rural | 141 (18.1) | 141 (26.3) | .0017 | 1.93 (1.49–2.52) |
| Urban | 636 (81.7) | 394 (73.5) | Ref | |
| Missing | 1 (0.1) | 1 (0.2) | ||
| Race, No. (%) | ||||
| Black | 256 (32.9) | 191 (35.6) | .4191 | 0.87 (0.67–1.12) |
| Other | 20 (2.6) | 17 (3.2) | 1.14 (0.54–2.39) | |
| White | 481 (61.8) | 319 (59.5) | Ref | |
| Missing | 21 (2.7) | 9 (1.7) | 0.63 (0.21–1.94) | |
| Gender, No. (%) | ||||
| Male | 726 (93.3) | 512 (95.5) | .0923 | 1.09 (0.64–1.86) |
| Female | 52 (6.7) | 24 (4.5) | Ref | |
| Comorbidities, No. (%) | ||||
| Renal failure | 178 (22.9) | 179 (33.4) | <.0001 | 1.44 (1.09–1.91) |
| Alcohol abuse | 333 (42.8) | 234 (43.7) | .7585 | 1.08 (0.88–1.34) |
| Valvular disease | 454 (58.4) | 319 (59.5) | .6745 | 1 (0.79–1.27) |
| Depression | 668 (85.9) | 392 (73.1) | .1704 | 0.87 (0.69–1.1) |
| Psychosis | 95 (12.2) | 87 (16.2) | .0381 | 1.34 (0.98–1.85) |
| HBV | 31 (4) | 21 (3.9) | .9514 | 0.98 (0.5–1.92) |
| HCV | 348 (44.7) | 229 (42.7) | .4714 | 0.75 (0.54–1.05) |
| HIV | 33 (4.2) | 33 (6.2) | .1183 | 1.68 (0.93–3.03) |
| Heart failure | 187 (24) | 187 (34.9) | <.0001 | 1.27 (0.95–1.69) |
| Liver disease | 302 (38.8) | 220 (41) | .4174 | 1.23 (0.88–1.72) |
aOdds ratios are from a multivariable logistic regression model comparing patients identified by algorithm A with patients missed by A but identified by B (ie, with codes for drug use within 6 months of IE admission but not during admission). See the “Methods” section for details.
Abbreviations: HBV, hepatitis B virus; HCV, hepatitis C virus; IQR, interquartile range; OR, odds ratio.
Positive Predictive Values for Clinical Diagnoses of IE, Drug Use, and IVDU
Positive predictive values for combined clinical diagnoses of IVDU-IE (ie, chart documentation of clinical diagnoses of both IE and IVDU) were low for each algorithm (algorithm A: 65.0%; 95% CI, 58.4%–71.6%; algorithm B: 55.2%; 95% CI, 52.6%–57.8%) (Table 2), largely because of low PPVs for clinical diagnoses of IVDU. Considered individually, PPVs for clinical diagnoses of IE were high for each algorithm (algorithm A: 86.5%; 95% CI, 81.8%–91.2%; algorithm B: 82.6%; 95% CI, 80.6%–84.6%) (Table 2). False-positive inpatient ICD codes for IE (ie, patients without a clinical diagnosis of IE in the chart) were uniformly related to patients who were admitted with an initial suspicion for IE, but the diagnosis of IE was ruled out with additional evaluation. PPVs were high for clinical diagnoses of drug use by any route (algorithm A: 99.0%; 95% CI, 97.6%–100%; algorithm B: 96.3%, 95% CI, 95.3%–97.3%), but lower for clinically documented diagnoses of IVDU (algorithm A: 74.5%; 95% CI, 68.5%–80.5%; algorithm B: 64.1%; 95% CI, 61.6%–66.6%). Among patients without clinically documented IVDU, most had clinical documentation of drug use but not the route of drug use (72% for algorithm A and 54% for B).
Positive Predictive Values of Algorithms A and B for Clinical Documentation of Diagnoses of Infective Endocarditis, Any Drug Use, Injection Drug Use, Drug Use–Associated Infective Endocarditis, and Intravenous Drug Use–Associated Endocarditis
| Positive Predictive Value | Algorithm A (95% CI), % | Algorithm B (95% CI), % |
|---|---|---|
| Infective endocarditis | 86.5 (81.8–91.2) | 82.6 (80.6–84.6) |
| Drug use ever | 99.0 (97.6–100) | 96.3 (95.3–97.3) |
| Drug use–associated infective endocarditisa | 85.5 (80.6–90.4) | 79.6 (77.4–81.4) |
| Injection drug use ever | 74.5 (68.5–80.5) | 64.1 (61.6–66.6) |
| Injection drug use–associated infective endocarditisb | 65.0 (58.4–71.6) | 55.2 (52.6–57.8) |
aDocumented infective endocarditis and any documented drug use.
bDocumented infective endocarditis and documented intravenous drug use.
Reasons for Unrecorded Drug Use ICD Codes During IE Admissions
Among patients with drug use ICD codes entered during visits within 6 months of IE admissions but not during IE admissions (ie, identified by algorithm B but not A), most (72%) had a drug use diagnosis documented in clinical notes from the IE admission, even though no discharge ICD codes for drug use were present in administrative data from the admission (Figure 3). This suggests that algorithm A often missed potential IVDU-IE diagnoses because of a failure to enter ICD codes for clinically documented drug use diagnoses in discharge records.
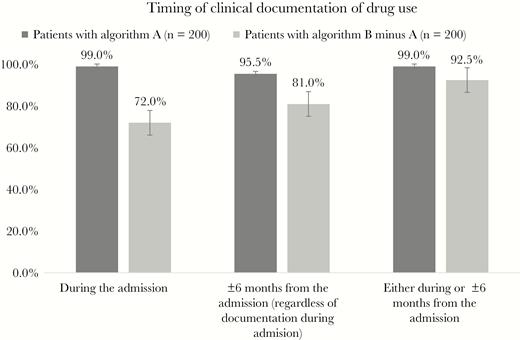
Timing of drug use documentation among patients identified by A and patients identified by B but missed by A (algorithm B minus A).
Sensitivity Analyses With Addition of HCV and Age Restriction
Adding HCV codes increased the algorithm B yield from 1314 to 2094 patients, a 59% increase (Supplementary Figure 1). However, the PPV of this algorithm with HCV codes included was overall poor for clinically documented IE (77%) and IVDU-IE (41%), regardless of age. We also found that PPVs for any drug use and IVDU were lower for patients aged 56 and older compared with younger patients (72% and 42%, respectively). Thus, excluding patients over 55 improved PPVs for IVDU-IE but led to our missing a substantial number of chart-confirmed cases among patients aged 56 years and older. Based on rough estimates generated by multiplying the algorithm yield by the PPV for IVDU-IE in each age stratum, restricting case finding to patients aged 55 years and younger would have missed an estimated 542 (64%) of the 850 total “chart-confirmed” cases of clinically documented IVDU-IE in the VA.
DISCUSSION
We used nationwide data and multisite chart review in the VA’s integrated electronic health record to examine the performance of case-finding algorithms that used ICD codes to identify patients with potential IVDU-IE. We found that an algorithm using ICD codes for drug use from outpatient and other visits within 6 months of IE admissions identified patients who were missed by an algorithm using only ICD codes for drug use from IE admissions. We also found that PPVs were high for clinically documented diagnoses of IE and any drug use, but lower for documented diagnoses of IVDU and IVDU-IE. Together, these findings indicate that ICD codes may not reliably identify patients with clinically diagnosed IVDU-IE, and there is a need for improved methods for IVDU-IE surveillance during the ongoing opioid epidemic.
Our study in the national VA health care system has strengths and weaknesses that must be considered in the context of prior studies conducted outside the VA. Several prior studies used state or national inpatient sample data to identify patients admitted with potential IVDU-IE in large samples of non-VA hospitals [9, 15, 16]. These prior studies could produce more generalizable descriptions of patients with IVDU-IE admissions than our study in the VA care system, partly because the VA cares for predominantly men with a higher average age than patients admitted to non-VA hospitals. In addition, the increase in IVDU-IE from 2010 to 2018 was more modest in our VA cohort compared with what has been described outside the VA for similar time periods and involved a preponderance of older individuals. This suggests that the dynamics of IVDU-IE in the VA population may be different than in the general population [3, 7, 8].
However, prior studies were unable to conduct chart reviews to confirm diagnoses indicated by ICD codes, leaving the accuracy of case-finding using ICD codes uncertain. Prior studies were also unable to evaluate how inclusion of data from outpatient visits could enhance identification of patients with drug use surrounding hospital admissions for endocarditis.
A study by Ball et al. conducted chart reviews in a series of 200 patients with endocarditis admitted to 2 hospitals in London, Ontario. The ability to review charts for all patients with endocarditis in these 2 hospitals made it possible to confirm diagnoses and calculate the sensitivities and specificities of case-finding algorithms for IE and drug use compared with a gold standard of chart review. However, the generalizability of this 2-hospital study was potentially limited.
In contrast, use of integrated national VA administrative and electronic record data allowed us to link outpatient and inpatient care episodes for individual patients and to conduct chart reviews to confirm clinical diagnoses of IE and drug use in samples of patients from over 100 VA hospitals. However, our study lacked a gold standard for diagnoses of IE, drug use, IVDU, and combined IVDU-IE because there is no curated registry of confirmed IE cases in the national VA system. This prevented us from calculating true sensitivities and specificities for each algorithm against an external gold standard, leading us to report algorithm yields and PPVs. In summary, our study in the VA was limited by potentially lower generalizability to populations receiving care outside the VA and a lack of nationwide “gold standards” for diagnoses of IE and drug use, but it also had unique strengths that produced findings that complemented prior studies.
There were variable reasons for false-positive identification of IVDU-IE cases using ICD codes. False-positive inpatient ICD codes for diagnoses of IE were mainly found for patients admitted with a suspicion for IE that was not subsequently confirmed during the admission. False-positive identification of IVDU was related to drug use not documented as occurring by injection—a predictable consequence of the unavailability of specific ICD codes for IVDU. Many patients with drug use mentioned in clinical notes did not have documentation of the route of drug use, indicating a problem related to history taking and documentation of routes of drug use in clinical practice. It is likely that some of the patients reporting any drug use did not disclose recent intravenous use because of stigma around IVDU or other factors, but it is difficult to estimate the frequency of underreporting of IVDU. Given the high prevalence of drug use by oral or other nonintravenous routes, it is also possible that some of these patients had exclusively nonintravenous drug use and IE related to other risk factors. This deficiency in the specificity of ICD codes—combined with incomplete history taking and/or clinical documentation related to IVDU—limits both epidemiologic surveillance for IVDU-IE and efforts to improve care.
Our findings indicate the need to develop more accurate case-finding algorithms for IVDU-IE that do not rely entirely on currently available ICD codes. Case finding could be improved by creation of ICD codes specific to IVDU coupled with efforts to improve the clinical documentation of route of drug use, but these changes would be difficult to implement. Natural language processing applied to clinical notes may improve case finding, to the extent that intravenous drug use is diagnosed and documented in notes. In addition, IVDU-IE case finding may be improved by identifying patients with other infections potentially acquired through IVDU, such as skin and soft tissue infections, HIV, or hepatitis C. Our sensitivity analyses indicated that the addition of ICD codes for HCV infection increased the yield of case-finding algorithms but generated lower PPVs for IE and combined IVDU-IE.
In conclusion, a case-finding algorithm using ICD codes for drug use from visits within 6 months of IE admissions identified many patients missed using only ICD codes from admissions, largely due to a failure to enter ICD codes for clinically documented diagnoses of drug use during admissions. Algorithms using ICD codes had poor PPVs for diagnoses of IVDU and combined diagnoses of IVDU-IE. There is a need for improved algorithms for IVDU-IE surveillance during the ongoing opioid epidemic.
Supplementary Data
Supplementary materials are available at Open Forum Infectious Diseases online. Consisting of data provided by the authors to benefit the reader, the posted materials are not copyedited and are the sole responsibility of the authors, so questions or comments should be addressed to the corresponding author.
Acknowledgments
Financial support. This work was supported in part by the Veterans Affairs Office of Rural Health (Award #7351).
Disclaimer. The views expressed herein are those of the authors and do not necessarily reflect the views of the United States Department of Veterans Affairs.
Potential conflicts of interest. Dr. Ohl reports serving as a consultant for Gilead Science for issues unrelated to this work. All authors have submitted the ICMJE Form for Disclosure of Potential Conflicts of Interest. Conflicts that the editors consider relevant to the content of the manuscript have been disclosed.
Author contributions. Kobayashi and Ohl had full access to all the data in the study and take responsibility for the integrity of the data and the accuracy of the data analysis. Study concept and design: Kobayashi, Miller, Polgreen, and Ohl. Acquisition, analysis, or interpretation of data: Kobayashi, Beck, Miller, Polgreen, O’Shea, and Ohl. Drafting of the manuscript: Kobayashi and Ohl. Critical revision of the manuscript for important intellectual content: Kobayashi, Miller, Polgreen, and Ohl. Statistical analysis: Kobayashi, Beck, O’Shea, and Ohl. Administrative, technical, or metatrail support: Kobayashi, Beck, Miller, Polgreen, O’Shea, and Ohl. Study supervision: Kobayashi, Beck, Miller, Polgreen, O’Shea, and Ohl.


Comments