


Abstract
Chronic hepatitis C virus (HCV) infection diminishes immune function through cell exhaustion and repertoire alteration. Direct acting antiviral (DAA)-based therapy can restore immune cell subset function and reduce exhaustion states. However, the extent of immune modulation following DAA-based therapy and the role that clinical and demographic factors play remain unknown.
We examined natural killer (NK) cell, CD4+, and CD8+ T cell subsets along with activation and exhaustion phenotypes across an observational study of sofosbuvir-based treatment for chronic HCV infection. Additionally, we examined the ability of clinical variables and duration of infection to predict 12 weeks of sustained virologic response (SVR12) immune marker outcomes.
We show that sofosbuvir-based therapy restores NK cell subset distributions and reduces chronic activation by SVR12. Likewise, T cell subsets, including HCV-specific CD8+ T cells, show reductions in chronic exhaustion markers by SVR12. Immunosuppressive CD4+ regulatory T cells decrease at 4-weeks treatment and SVR12. We observe the magnitude and direction of change in immune marker values from pretreatment to SVR12 varies greatly among participants. Although we observed associations between the estimated date of infection, HCV diagnosis date, and extent of immune marker outcome at SVR12, our regression analyses did not indicate any factors as strong SVR12 outcome predictors.
Our study lends further evidence of immune changes following sofosbuvir-based therapy. Further investigation beyond SVR12 and into factors that may predict posttreatment outcome is warranted.
Hepatitis C virus (HCV) establishes chronic infections in 50%–75% of individuals [1] by evading and overcoming the initial immune response [2, 3]. Natural killer (NK) cells represent a diverse class of innate immunity with central roles in HCV infection clearance and regulation [2, 3]. CD4+ and CD8+ T cells are critical adaptive immune components to HCV infection [2, 3]. An inadequate response by both NK and T cells facilitate chronic HCV (cHCV) infection development. Over time, the continuous immune response to cHCV infection alters NK and T cell composition and phenotypes.
Chronic HCV infection promotes adverse NK cell subsets expansion and activation phenotypes. During cHCV infection, mature NK cell frequency decreases, while immature NK cells frequency increases [4, 5]. NK receptors (NKRs) control NK cell activation and inhibition through a complex balance of signaling [6]. Killer immunoglobulin receptors (KIR) are the most prevalent NKRs, serving as ligands for human leukocyte antigen (HLA) molecules [7]. Other NKRs include the C-type lectin receptor family, such as CD94/NKG2 [8], and natural cytotoxicity receptors, such as NKp30 and NKp46 [9]. Additionally, NK cell inhibition occurs through pathways involving T cell immunoglobulin and mucin-domain containing-3 (TIM-3) and T cell immunereceptor with Ig and ITIM domains (TIGIT) [10]. During cHCV infection, NK cells exhibit a chronic activation phenotype in which CD94/NKG2A [11, 12], NKp30, and NKp46 [11, 13] expression increases, while KIR+ [14] and NKG2D [15] expression decreases.
Chronic HCV infection perpetuates T cell exhaustion phenotypes and increases regulatory T cell (Treg) frequency. Loss of function, excessive activation, high apoptosis, and decreased proliferation characterize the T cell exhaustion phenotype [16]. Exhausted T cells express higher levels of the CD28 family costimulatory and coinhibitory receptor, programmed cell death protein 1 (PD-1), TIM-3 [17], and TIGIT [18]. Additionally, these T cells exhibit high CD28 expression [19] and human leukocyte antigen DR-isotype (HLA-DR) [20]. Circulating Tregs upregulate during cHCV infection suppressing CD4+ and CD8+ T cell responses and functions [21, 22].
Antiviral therapies, including those for HCV infections, may restore altered immune subsets as well as exhaustion and activation phenotypes comparable to those found in healthy individuals. This “immune recovery” is a significant antiviral therapy measure that plays an important role in long-term patient outcomes. For HCV infections, direct-acting antiviral (DAA)-based therapy provides a sustained virologic response (SVR) in ≥95% of treated persons [23]; however, the immune system response following HCV clearance remains unclear. Numerous studies show a reversal in NK cell subset distribution [24, 25] and decreases in NK cell activation states [11, 24–26], and T cell exhaustion phenotypes [26, 27] following therapy. However, studies also show DAA-based therapy does not restore NK and T cell function [15, 25, 28, 29], normalize NK subsets and activation states [28], or reduce Treg frequency [30]. Additionally, it remains unknown what clinical or demographic factors may influence the immune system after viral eradication and are an important aspect to consider in DAA-based therapy use.
Here, we investigate immune cell markers within an observational, longitudinal cHCV patient cohort receiving sofosbuvir-based DAA therapy. Our population-based cohort includes comprehensive demographic and clinical history information, which can impact immune modulation magnitude [16, 31, 32]. To evaluate immune recovery outcomes, we measured immune markers indicative of recovery in NK cells, CD4+, CD8+, and HCV-specific CD8+ T cells before, during, and after sofosbuvir-based DAA therapy and analyzed clinical and demographic data to elucidate predictors of improved immune outcome.
METHODS
Study Participants
From the Alaska Hepatitis C longitudinal cohort study, we recruited 40 Alaska Native or American Indian persons scheduled for sofosbuvir-based therapy. All participants were enrolled and eligible for care at the Alaska Native Medical Center (ANMC; Anchorage, AK). Inclusion criteria were ≥18 years old, HCV genotype 1a or 1b, confirmed cHCV by presence of anti-HCV antibodies and HCV RNA, treatment naïve, and eligible for sofosbuvir-based therapy. Exclusion criteria were ineligibility for care at ANMC; incarceration; coinfection with hepatitis B virus, human immunodeficiency virus, or both; decompensated cirrhosis; autoimmune disease; or immunosuppressive therapy within six months of treatment. This study received approval by the Alaska Area (Indian Health Service) and University of Alaska Anchorage Institutional Review Boards. This study also received approval from the Alaska Native Tribal Health Consortium and Southcentral Foundation Executive Committee. All participants provided written informed consent.
Sample Collection
All participants provided an additional 10mL of whole blood to clinically requested phlebotomy at scheduled clinical appointments: pretreatment (PreT), week 4 of treatment (WK4), end of treatment (EOT), and 12 weeks of SVR (SVR12). Peripheral blood mononuclear cells (PBMCs) were isolated by Ficoll density gradient centrifugation [33]. Isolated PBMCs were cryopreserved in fetal calf serum and 5% dimethyl sulfoxide in liquid nitrogen until analysis.
Data Abstraction
Data abstracted from electronic health records included the following: age, sex, body mass index (BMI), medical conditions related to HCV infection comorbidities, HCV infection transmission risk, and estimation of liver fibrosis using vibration-controlled transient elastography (FibroScan, Echosens, Waltham, MA), AST to platelet ratio index, and fibrosis-4 score. Additional data abstracted included HCV RNA levels, complete blood count, comprehensive metabolic panel, and interleukin (IL)-28 genotype. Estimated date of infection (EDI) was determined using the patient interview and testing data collection methods described previously [34].
PBMC Staining
Cryopreserved PBMCs were thawed, washed, and resuspended in staining buffer (1X Dulbecco’s phosphate-buffered saline/2% FCS) at 5.0 x 10⁶ cells/ml. Antibodies were purchased from Biolegend (San Diego, CA). Staining panels were constructed as follows. For T cells, αCD3-APC700, αCD4-PerCP/Cy5.5, and αCD8-APC-750 Fire. For Tregs, αCD25-APC and αCD127-BV421. For NK cells, αCD56-PE/CY7, αCD16-FITC, αCD94-APC, αNKp46-BV421, αNKp30-PE, αKIR3DL1-APC, and αKIR2DL1-PE. For memory phenotypes, αCD45RA-FITC and αCCR7-APC. For cell exhaustion and senescence, αPD-1-PE (T cell only), αTIGIT-APC, αTIM-3-BV421, αCD28-BV660 (T cell only), αHLA-DR-BV660, and αCD57-PE. Stained PBMCs were acquired on a Beckman Coulter 13-color Cytoflex flow cytometer utilizing the CytExpert 2.0 software (Beckman Coulter, San Diego, CA). Background and isotype controls were included where appropriate. Raw data were analyzed using CytExpert 2.0 and FCS Express v6.06.0014 (DeNovo Software, San Jose, CA).
HLA-A24:02 Pentamer Staining
To determine HLA-A typing, DNA was extracted from whole blood at the PreT sample point and sent to ProImmune Inc. (Oxford, UK). HLA-A24:02-1031 (AYSQQTRGL; HCV NS3 ProImmune) was the most prevalent HLA-A (n = 17) and only those participants were included in the HCV-specific CD8+ T cell analysis. Cell and pentamer staining were done per manufacturer protocol and 100 000 events were recorded. Antibodies used to identify HCV-specific CD8+ T cells included αCD3-APC700, αCD8-APC750 Fire, and α24:02-APC. To eliminate nonspecific staining, αCD19-BV660 and αCD4-PerCP/Cy5.5 were used in an exclusion channel. Antibodies αPD-1-FITC, αTIGIT-PE, and αTIM-3-BV421 then were applied to determine exhaustion phenotype.
Statistical Analysis
For all antibody data, significant differences among PreT and all other sample points (ie, PreT vs WK4, EOT, or SVR12) were assessed via paired t tests. We examined correlations between both clinical and immune marker data graphically as well as via Pearson correlation coefficients. To examine factors influencing immune marker outcome at SVR12, beta regression was utilized for immune markers reported as proportions, and simple linear regressions for those markers with outcomes measured as mean fluorescence intensity. An example of simple linear regression is as follows:
Covariates examined in our multivariable models of SVR outcome are indicated by the following equation:
Per participant, differences from PreT to SVR12 values (or SVR12 outcome) for exhaustion and activation markers were classified into four heat map groups defined by immune cell type: (1) Tregs, (2) NK, (3) CD4+ and CD8+ T cells, and (4) HCV-specific CD8+ T cells. Values were normalized (both pre- and postmeasurements, centered and scaled to PreT values), and the mean difference in pre- and postnormalized values across all markers for a participant served as a marker group score for the participant. These scores then were used to create a color scale defined to a range between +/- one unit of these standardized averaged scores. Values in green indicate exhaustion or activation markers that decrease from PreT to SVR12, whereas values in red indicate exhaustion and activation markers that increase from PreT to SVR12. Heat maps with all exhaustion or activation markers were constructed for all groups. All analyses were performed using R version 3.4.3 (Vienna, Austria).
RESULTS
Cohort Description
Of the 40 participants, all 40 achieved SVR. One participant stopped therapy at WK4 of treatment. Twenty-nine participants (73%) were women. The mean age was 53.5 ± 12.4 years, and mean BMI was 27.1 ± 4.8 kg/m2 (Table 1). The mean EDI was 23.6 ± 13.4 years with a range of 3–51 years. The mean HCV diagnosis date was 10.3 ± 6.9 years. Mean PreT viral load was 4.0 x 10⁶ IU/ml and ranged from 431–24.9 x 10⁷ IU/ml. No participant had a detectable viral load after WK4. Treatment duration was 8 (n = 6) or 12 weeks (n = 33) (Table 1). No significant differences in immune marker results were detected among participants differing in length of treatment or medication combination used (data not shown).
Characteristics of the Patient Cohort Upon Study Enrollment
| Characteristics | n (%) | |
|---|---|---|
| Completed therapy | 39 (98%) | |
| Previously treated | 0 (0%) | |
| Treatment length, 8 weeks | 6 (15%) | |
| Treatment length, 12 weeks | 33 (85%) | |
| Ledipasvir-Sofosbuvir treatment regimen | 37 (92%) | |
| Sofosbuvir-Velpatasvir treatment regimen | 3 (8%) | |
| Ribavirin | 0 (0%) | |
| HCV genotype 1a | 37 (92%) | |
| HCV genotype 1b | 3 (8%) | |
| Female | 29 (73%) | |
| IL-28b CCa | 18 (46%) | |
| IL-28b TTa | 0 (0%) | |
| IL-28b CTa | 21 (54%) | |
| Body mass index ≥ 30 (kg/m2) | 7 (17.5) | |
| Advanced fibrosis (FibroScan Score > 9.5 kPa) | 6 (15%) | |
| Cirrhosis (FibroScan Score > 12.5 kPa) | 3 (8%) | |
| HCV RNA > 6.0 × 10⁶ (IU/ml) | 8 (20%) | |
| HCV RNA viral load at WK4 | 2 (5%) | |
| Characteristics | Mean (SD) | Range (min,max) |
| Age (years) | 53.5 (12.4) | 23,70 |
| Body mass index (kg/m2) | 27.1 (4.8) | 17.0,48.2 |
| Estimated duration of infection (years) | 23.6 (13.4) | 3.0,51.0 |
| HCV diagnosis date (years) | 9.0 (6.9) | 1.0,23.0 |
| FibroScan Score at PreT | 5.5 (4.1) | 3.0,26.3 |
| FibroScan Score at SVR12 | 4.8 (2.2) | 2.8,15.1 |
| Pretreatment HCV RNA (IU/ml) | 1.4 × 10⁶ (6.0 × 10⁶) | 4.3 × 102,2.5 × 107 |
Abbreviations: CC, TT, CT, genotypes; HCV, Hepatitis C virus; PreT, pretreatment; SVR12, 12 weeks of sustained virologic response.
aIL - 28 genotype known for 39 persons.
bFibroScan, utilizing vibration-controlled transient elastography, was used to measure liver fibrosis; values are reported as FibroScan Score.
Observed Decreased NK Cell Activation and Immature NK Cell Frequency Following Treatment Completion
Overall, NK cells demonstrated decreased activation states and suggested a restoration of altered cell subsets by SVR12. Total NK cells increased at EOT compared to PreT (P = .02), but not at WK4 or SVR12 (Figure 1A and B). Immature NK cells decreased by WK4 (P = .01), and this pattern maintained through SVR12 compared to PreT (Figure 1C). We found no significant differences in mature NK cells at any sample point compared to PreT, although mean and median mature NK values increased from WK4–SVR12 compared to PreT (Figure 1D). Only mature NK cells were examined for activation and exhaustion phenotypes. NKp30 and NKp46 expression, both decreased from PreT to SVR12 (P = .03 and <.01 respectively). Additionally, CD94 expression decreased at WK4 through SVR12 compared to PreT (P = .02 to <.01; Supplementary Figure S1). Further activation and exhaustion state analyses saw TIM-3 expression decreased at EOT through SVR compared to PreT (P = .01 and <.01 respectively; Supplementary Figure S1). TIGIT expression also decreased at SVR, and additionally at WK4, compared to PreT (P < .01 and .03 respectively; Supplementary Figure S1) but not at EOT. For KIR receptors, KIR3DL1 expression increased from PreT to SVR12 (P = .01), and KIR2DL1 did not differ significantly at any time point (Supplementary Figure S1).
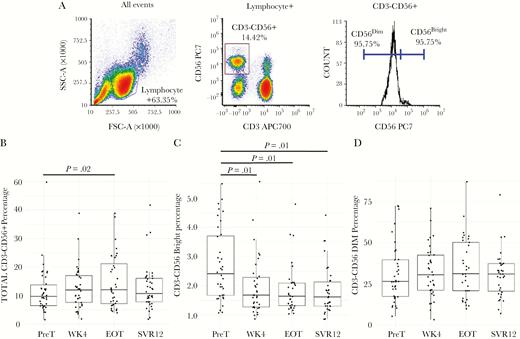
Natural killer cell subsets show partial restoration during and following treatment. (A) Natural killer (NK) cells were defined as lymphocytes that were CD3–CD56+. NK cells subsets were defined by CD56 expression, immature NK cells being CD56bright, and mature NK cells being CD56dim. Boxplots for total NK cells (B), immature NK cells (C), and NK cells (D) are in percentages by sample point. Lines above boxplots represent a significant difference between two sample points. Comparisons made between pretreatment (PreT) and 12-weeks following sustained virologic response (SVR12) were assessed via paired t tests. Samples were determined to be statistically different if P < .05.
CD4+ T Cells Exhibit Reduced Treg Cell Frequency, Exhaustion, and Activation Phenotypes
Total (CD3+CD4+CD25+CD127–) Treg frequency decreased and total CD4+ T cells exhibited decreased exhaustion and activation states by EOT and SVR12. Compared to PreT, Tregs decreased as early as WK4 (P < .01), and at SVR12 (P = .02; Figure 2A and B). Although, Treg frequencies at EOT did not significantly differ, the mean and median values remained below PreT values (Figure 2C). Additionally, CD3+ lymphocytes did not significantly differ at any sample point compared to PreT (data not shown). Total CD4+ T cell PD-1 expression significantly decreased at EOT, but not SVR, compared to PreT (P = .04 and .06 respectively). For Total CD4+ T cells TIGIT expression, significant decreases were only observed at SVR12 compared to PreT (P < .01; Supplementary Figure S2). Total CD4+ T cell TIM-3 expression showed no significant changes at any sample point compared to PreT. For total CD4+ T cell activation markers, HLA-DR and CD28 expression both significantly decreased at SVR12 compared to PreT (P < .01 and P = .03 respectively; Supplementary Figure S2). No significant changes were detected in total CD4+ T cell memory subsets (date not shown).
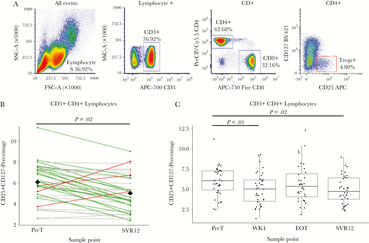
CD4+ regulatory T cell percentages decrease early in and following treatment. (A) Flow cytometry gating strategy for CD4+ regulatory T cells (Treg) were defined as lymphocytes that were CD3+CD4+CD25+CD127–. (B) The line graph of Treg percentages compares individual differences between pretreatment (PreT) and 12-weeks following sustained virologic response (SVR12) values. Green lines indicate negative differences (positive immune outcome) from PreT–SVR12, red lines indicate positive differences (negative immune outcome), and grey lines indicate unchanged differences (less than ± 1 standard deviation change). The black diamonds at both PreT and SVR12 represent the mean value among all participants. (C) For Treg boxplots by sample point, lines above boxplots represent a significant difference between two sample points. Comparisons made between PreT and SVR were assessed via paired t tests. Samples were determined to be statistically different if P < .05.
Total and HCV-specific CD8+ T Cells Exhibited Reduced Exhaustion and Activation Phenotypes
Although outcomes varied, we observed a reduction in exhaustion and activation states within total and HCV-specific CD8+ T cells. PD-1 expression in total and HCV-specific CD8+ T cell populations decreased at SVR12 compared to PreT (P = .01 [Figure 3A and B] and <.01 [Figure 4A and B]). Total CD8+ T cells additionally had decreased TIM-3 frequencies between PreT and SVR12 (P = .04; Figure 3C). For HCV-specific CD8+ T cells, TIM-3 expression did not significantly differ at any time point compared to PreT (Figure 4C). However, 13 individuals with decreased TIM-3 expression in HCV-specific CD8+ T cell at SVR12 also had decreased PD-1 frequencies (Figure 5B). Neither CD8+ T cell populations showed significant changes in TIGIT expression (Figure 3D and 4D). Additionally, no significant difference in HCV-specific CD8+ T cell percentages were detected (Supplementary Figure S3). Among activation markers, total CD8+ T cells showed decreased HLA-DR at SVR12 compared to PreT (P < .01; Supplementary Figure S4). Additionally, CD28 expression decreased at WK4 (P = .03) through SVR12 (P < .01; Supplementary Figure S3). No significant differences were detected in total CD8+ T cell memory subsets (data not shown).
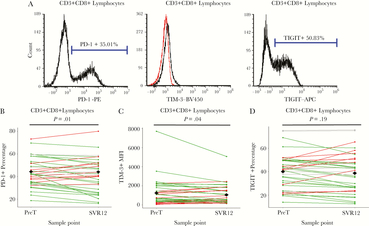
Total CD8+ T cells exhibit a partial reduced exhaustion phenotype following treatment in comparison to baseline values. (A) Flow cytometry gating strategy was used for programmed cell death protein (PD-1; left), T cell immunoglobulin and mucin domain 3 (TIM-3; middle), and T cell immunoreceptor with Ig and IGIT domains (TIGIT; right) positive CD3+CD8+ lymphocytes. (B) For PD-1, the line graph of marker percentages compares individual differences between pretreatment (PreT) and 12-weeks following sustained virologic response (SVR12). (C) For TIM-3, values were determined by mean fluorescence intensity. A mouse Ig1 isotype control was used to determine background. The line graph of marker percentages compares individual differences between PreT and SVR12 values. (D) For TIGIT, the line graph of marker percentages compares individual differences between PreT and SVR12 values. For B–D, green lines indicate negative differences (positive immune outcome) from PreT–SVR12, red lines indicate positive differences (negative immune outcome), and grey lines indicate unchanged differences (less than ± 1 standard deviation change). The black diamonds at both PreT and SVR12 represent the mean value among all participants. Comparisons made between PreT and SVR were assessed via paired t tests. Samples were determined to be statistically different if P < .05.
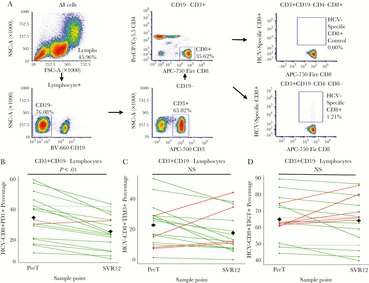
Hepatitis C virus (HCV)-specific CD8+ T cells exhibit a partial reduced exhaustion phenotype following treatment in comparison to baseline values. (A) Flow cytometry gating strategy was used to identify HCV-specific CD8+ T cells. Of the 40 participants in our cohort, 17 individuals with HLA-A24:02-1031 (AYSQQTRGL; HCV NS3) were utilized for the analysis. (B) For PD-1, the line graph of marker percentages compares individual differences between pretreatment (PreT) and 12-weeks following sustained virologic response (SVR12). (C) For TIM-3, a mouse Ig1 isotype control was used to determine background. The line graph of marker percentages compares individual differences between PreT and SVR12 values. (D) For TIGIT, the line graph of marker percentages compares individual differences between PreT and SVR12 values. For B–D, green lines indicate negative differences (positive immune outcome) from PreT–SVR12, red lines indicate positive differences (negative immune outcome), and grey lines indicate unchanged differences (less than ± 1 standard deviation change). The black diamonds at both PreT and SVR12 represent the mean value among all participants. Comparisons made between PreT and SVR were assessed via paired t tests. Samples were determined to be statistically different if P < .05.
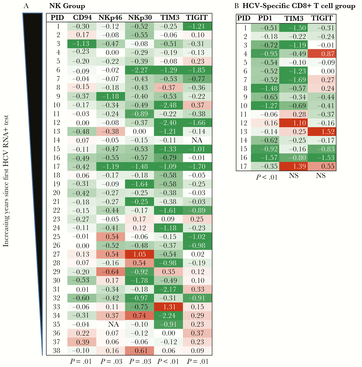
Heat maps reveal trends and individual variation in immune recovery outcomes. Heat maps indicate the (A) natural killer (NK) cell and (B) Hepatitis C virus (HCV)-specific CD8+ T cells groups. Each numerical value represents the normalized difference in pretreatment (PreT) to 12-weeks sustained virologic response (SVR-12) for the stated immune cell marker. These data are presented per participant with their exhaustion and activation marker values. Green values represent a decrease in exhaustion or active markers, while red values represent an increase in exhaustion or activation markers. Participant identifiers are chronological with smaller numbers representing older HCV diagnosis date. P values below each immune marker represent the significant difference between PreT and SVR12. Samples were determined to be statistically different if P < .05.
General Decrease in Exhaustion and Activation Marker Outcomes Observed From Pretreatment to SVR12 in the Majority of Patients
To summarize individual immune outcomes from PreT to SVR by exhaustion and activation phenotype markers, we utilized heat maps (Figure 5, Supplementary Figure S5). The heat map summaries revealed SVR12 immune marker outcomes (magnitude and direction of change compared to PreT values) varied highly among participants, but the majority of participants had multiple immune marker values indicative of decreased exhaustion and activation cell phenotypes. Frequently, the magnitude of immune markers changes from PreT to SVR12 were within 1 standard deviation of normalized values, indicating a minimal change. Interestingly, we observed many individuals, who had more recent HCV diagnoses, exhibiting no change or increased exhaustion or activation markers at SVR12 (Supplementary Figure 4A). Additionally, individuals with shorter EDI displayed a similar pattern within the evaluated HCV-specific CD8+ T cells (Supplementary Figure 4B).
Examining the Impact of Clinical and Demographic Variables on Posttherapy Immune State
From the clinical data, we next explored if EDI, age, BMI, PreT fibrosis score, HCV diagnosis date, and PreT viral load were associated with SVR12 outcomes. We developed univariable and multivariable regression models using these clinical indicators to predict SVR12 immune outcome. Neither EDI nor HCV diagnosis date (or any other variable) were a significant predictor of any marker tested (Supplementary Table S1 and S2). Additional logistic regression analysis and other multivariate analyses (eg, principle components analysis and mixed-effect modeling) provided no further insight into clinical variables that predicted SVR12 immune outcome (data not shown).
DISCUSSION
Multiple studies have established that cHCV infection disrupts the immune system. High efficacy DAA-based therapies have been groundbreaking for HCV infection treatment. We investigated changes in cell populations and phenotype markers by a convenience sample of cHCV-infected patients from a longitudinal, observational cohort scheduled to undergo sofosbuvir-based therapy. Most studies to date have included these analyses from clinical trial, where clinical history, including EDI, cannot be examined. Our study evaluated baseline (PreT) NK and T cell profiles compared to within (WK4, EOT) and posttreatment (SVR12) profiles. Our cohort allowed the examination of relationships between immune phenotype markers, clinical history, and demographic data. Ultimately, this knowledge could help providers to assess and understand posttreatment patient care and health risks.
Our NK cell analysis supports the premise that sofosbuvir-based therapy reduces chronic activation and exhaustion states, while partially restoring healthy cell subsets. Our findings follow a similar trend to other sofosbuvir-based [25] and early DAA-based clinical studies [11, 26, 35]. Immature NK cell reductions correspond with HCV RNA disappearance at WK4 (Figure 1C). Reductions in NK activation and exhaustion states appear to lag by several weeks after viral eradication, suggesting a delay in NK cell recovery kinetics. Our finding of increasing mature NK percentages at WK4–SVR12 in comparison to PreT suggest restoration of this subset may not occur until after SVR12. Spaan et al. observed increases in mature NK cells following daclatasvir ± asunaprevir therapy [35]. Overall, changes in NK cell subsets and activation phenotypes are evident following sofosbuvir-based therapy.
Similar to NK cells, T cell exhaustion and activation states decrease following sofosbuvir-based therapy. Our observations are consistent with Burchill et al. (daclatasvir ± asunaprevir) that T cell exhaustion decreases following DAA-based therapy [26]; however, our findings suggest the involvement of differing coinhibitory pathways. For total CD8+ T cells, DAA-based therapy decreased exhaustion phenotypes as evidenced by reductions in PD-1 and TIM-3, but not TIGIT (Figure 3). PD-1 and TIM-3 coexpress on T cells with the highest dysfunction and exhaustion during cHCV infection [20] and blockading both pathways restores proliferation and function [17, 20]. For the HCV-specific CD8+ T cells evaluated, only PD-1 reduction posttreatment was observed. These findings support previous studies [26, 27]. Our data also support previous studies that TIGIT could play an important role in CD4+ T cell exhaustion during cHCV infection [30] (Supplementary Figure S1). We should also note that although the trend did not persist through SVR12, the PD-1 decrease at EOT is suggestive of a role in CD4+ T cell exhaustion (data not shown). Additionally, decreases in HLA-DR and CD28 following treatment indicate a reduction in T cell activation during and following treatment for both T cell subsets (Supplementary Figure S2 and S3). Similar to NK cells, reduction in activation markers occurs several weeks after HCV RNA disappearance. Collectively, these data support a reversal in T cell exhaustion and activation markers irrespective of type of DAA-based therapy.
We observed a decrease in overall Treg frequency post therapy. Our findings contradict earlier reports that suggest no reductions occur during or posttreatment [30, 36]. These differences could be attributed to cohort size or DAA-based regimens. Additionally, our analysis did not investigate Foxp3+-expressing Tregs. Therefore, our findings may be unique to CD3+CD4+CD25+CD127– Tregs. For some participants, PreT to SVR12 changes were minor (<1 SD; Figure 2B). The question of biological significance in minor Treg decreases indicate that long-term monitoring of our cohort and further Treg studies should occur. Overall, our findings are unique and provide evidence that reduction in Treg frequency can be observed during sofosbuvir-based therapies.
Our immune marker data provide further evidence of changes for both NK and T cells following sofosbuvir-based therapy; however, our additional objective was to explore the predictive value of clinical data to determine SVR12 immune marker outcomes. These data reflect diverse participant immune outcomes that vary greatly (Figure 5A and B). A host of environmental and genetic factors influences immune system variation [37, 38]. Despite high variation, the majority of participants exhibit immune marker data aligned with decreased exhaustion and activation phenotypes. However, our simple and multivariable regression analyses provide no clinical or demographic factors predictive of SVR12 outcome for the immune markers used in this study. Our heat map groups suggested EDI and known HCV diagnosis date affect SVR12 outcome of HCV-specific CD8+ T cells and NK cells, respectively. However, within our cohort of 40 patients, regression analyses did not identify significant associations between SVR outcome and EDI or HCV diagnosis date. The estimated effect size of PreT values on the change in markers from PreT to SVR12 was relatively low in all markers, indicating a minimal effect of baseline status on immune recovery. Although our results indicate larger sample sizes or different clinical variables may be necessary to identify predictors of immune outcome, these findings merit further, more expansive exploration with expanded observation timeframes and utilizing the unique depth of clinical information of the AKHepC cohort.
A number of limitations in this study must be taken into account. First, our analysis includes general markers of immune cell function, but it does not include functional assays nor an in-depth examination of HCV-specific T cells. The scope of the project and blood sample availability limited our ability to perform functional assays, but we recognize their importance in evaluating the immune system. Sofosbuvir and early DAA-based studies contradict whether functional restoration occurs following DAA-based therapy [11, 15, 25, 28, 29]. HLA-A24:02 was the most common HLA type in our cohort and was used to maximize our HCV-specific T cell analysis, but other HLA types and epitopes should be considered in future studies. However, neither limitation changes the interpretation of our results. Additionally, our analysis was limited to circulating NK and T cell populations. Known cell populations accumulate in the liver during cHCV infection [19, 35, 36]. We cannot make inferences regarding intrahepatic cell populations in this study. The small changes we observe in NK and T cell populations could be due to decreased liver inflammation and redistribution of immune cells from the liver to blood. Finally, our study did not include a HCV-negative Alaska Native/American Indian cohort. Including a HCV-negative control was not feasible with regards to recruitment given sensitivities to research within the Alaska Native/American Indian population. This study design included a pretreatment time point to establish a baseline with which to compare changes over time and post-DAA therapy.
Our findings support that changes in the immune system occur following cHCV treatment [11, 24–27]. Our study benefits from extensive clinical and laboratory information already available, and we have completed a preliminary examination of the impact of sofosbuvir-based therapy on the immune system and clinical factors that predict posttreatment immune outcomes. Moving forward, our focus will be on expanding these analyses, conducting functional cellular assays, and monitoring participants to determine if the immune system changes observed persist beyond SVR12. A larger inclusion of individuals from the AKHepC cohort and additional analysis of clinical data may provide further insight to clinical predictors of sofosbuvir-based treatment outcome, including immune recovery. We continue to see persons within the AKHepC cohort who completed DAA-based treatment to monitor liver health and clinical labs. This long-term monitoring provides a unique opportunity to conduct in-depth evaluations of the DAA effects posttreatment on the immune system with a prospective clinical outcome, including monitoring for higher HCC incidence rates post-DAA treatment that are emerging in the current literature [39].
Supplementary Data
Supplementary materials are available at Open Forum Infectious Diseases online. Consisting of data provided by the authors to benefit the reader, the posted materials are not copyedited and are the sole responsibility of the authors, so questions or comments should be addressed to the corresponding author.
Acknowledgments
We would like to thank the Liver Disease and Hepatitis Program nurses for recruitment, blood collection, and consultations. Additionally, we would like to thank Drs. Max Kullberg and Holly Martinson for their assistance with flow cytometry assays and consultations. In kind support was provided by the University of Alaska Anchorage (flow cytometer usage and expert immunology consultation), and the Alaska Native Tribal Health Consortium (consultation and data management). We would like to dedicate this article to Dr. Sarah Luna who was critical to the completion of this work and who has since passed. Dr. Luna was a hardworking, innovative, selfless, and kindhearted person committed to improving the health of the Alaska Native people. She was a rising epidemiologist with a bright future ahead. Dr. Luna is greatly missed by all her colleagues and friends.
Financial support. This project was funded in part by an investigator-sponsored research award from Gilead Sciences International, grant # IN-US-334–2094, which funded T.J.S, Y.B., and H.G.F.E. also received salary support, reagents, and contract statistical support. Research was also supported in part by an Institutional Development Award (IDeA) from the National Institute of Health under grant number P20GM103395. The content is solely the responsibility of the authors and does not necessarily reflect the official views of the NIH.
Potential conflicts of interest. The Alaska Native Tribal Health Consortium Liver Disease Hepatitis Program is participating in 2 investigator-sponsored observational studies of Alaska Native or American Indian persons receiving sofosbuvir-based treatment for Hepatitis C virus infection. These studies are funded in part by contracts with Gilead Sciences International. All authors have submitted the ICMJE Form for Disclosure of Potential Conflicts of Interest. Conflicts that the editors consider relevant to the content of the manuscript have been disclosed.
References
Author notes
Dr. Brenna Simons is now with the Centers for Disease Control Arctic Investigations Program, Anchorage, Alaska.


Comments