


Abstract
Influenza surveillance activities inform the state public health response to influenza but may under-detect influenza events. We applied modeling methods to estimate influenza excess pneumonia and influenza (P&I) and respiratory and circulatory (R&C) deaths and hospitalizations to Colorado data from July 1, 2007 through June 30, 2016.
Data included P&I and R&C deaths and hospitalizations (events) listed as underlying or primary diagnoses on death certificates and hospital discharge records, respectively, and local sentinel lab surveillance for influenza A and B. We evaluated four negative binomial models for each event type. Model 1 estimated a seasonal baseline of events from a weekly time series of diagnoses and included coefficients for excess events due to influenza A and B. In Model 2, we created influenza A subtype coefficients by applying subtype proportions from national surveillance to the percent of local specimens positive for influenza A. Models 3 and 4 were similar to Models 1 and 2, except influenza-specific diagnoses were removed from the baseline model and added to final estimates. We calculated 95% confidence intervals (CI) using bootstrap methods. Statewide laboratory-based surveillance was a reference.
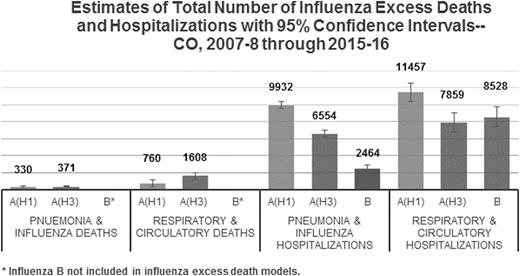
Model 2 better captured seasonal variability than Model 1. Models 3 and 4 inconsistently predicted events. According to Model 2 (figure), during 9 influenza seasons there were 701 P&I deaths (median 37 A(H1) and 52 A(H3) per year), 2,368 R&C deaths (median 73 A(H1) and 203 A(H3) per year), 18,950 P&I hospitalizations (median 1,068 A(H1), 1,021 A(H3), and 272 B per year), and 27,844 R&C hospitalizations (median 1,156 A(H1), 1,112 A(H3), and 1,037 B per year) due to influenza. While A(H3) was most frequently associated with death, A(H1) was more often associated with hospitalization. Compared with laboratory-based surveillance, we estimated 1.2 and 4.0 times as many P&I/R&C deaths and 1.3 and 1.9 times as many P&I/R&C hospitalizations.
Robust statistical models applied to state-level data better estimate local influenza burden, and augment those of laboratory-based surveillance. Such models may be useful for prevention planning and more accurate public information about the burden of influenza.
Figure.
All authors: No reported disclosures.
Session: 255. Virology Potpourri
Saturday, October 6, 2018: 12:30 PM


Comments