


Abstract
Extraintestinal Escherichia coli infections are increasingly challenging due to emerging antimicrobial resistance, including resistance to extended-spectrum beta-lactams and fluoroquinolones. Sequence type 131 (ST131) is a leading contributor.
Three hundred sixty E. coli clinical isolates from across the United States (2011–2012), selected randomly from the SENTRY collection within 3 resistance categories (extended-spectrum cephalosporin [ECS]–reduced susceptibility [RS]; fluoroquinolone-resistant, ESC-susceptible; and fluoroquinolone-susceptible, ESC-susceptible) were typed for phylogroup, sequence type complex (STc), subsets thereof, virulence genotype, O type, and beta-lactamase genes. Molecular results were compared with susceptibility profile, specimen type, age, and sex.
Phylogroup B2 accounted for most isolates, especially fluoroquinolone-resistant isolates (83%). Group B2–derived ST131 and its H30 subclone (divided between H30Rx and H30R1) predominated, especially among ESC-RS and fluoroquinolone-resistant isolates. In contrast, among fluoroquinolone-susceptible isolates, group B2–derived STc73 and STc95 predominated. Within each resistance category, ST131 isolates exhibited more extensive resistance and/or virulence profiles than non-ST131 isolates. ST131-H30 was distributed broadly by geographical region, age, and specimen type and exhibited distinctive beta-lactamase genes. Back-calculations indicated that within the source population ST131 accounted for 26.4% of isolates overall (vs 17% in 2007), including 19.8% ST131-H30, 13.2% ST131-H30R1, and 6.6% each ST131-H30Rx and non-H30 ST131.
ST131-H30, with its ESC resistance-associated H30Rx subset, caused most antimicrobial-resistant E. coli infections across the United States in 2011–2012 and, since 2007, increased in relative prevalence by >50%. Focused attention to this strain could help combat the current E. coli resistance epidemic.
Extraintestinal infections due to Escherichia coli are common, costly, and clinically important [1]. Emerging antimicrobial resistance increasingly complicates their management [2, 3]. Better understanding of the growing E. coli resistance problem is sorely needed.
A single emergent E. coli clonal group, designated sequence type 131 (ST131) by multilocus sequence typing, has been identified as an important contributor to the epidemic of antimicrobial resistance in E. coli, especially for first-line agents such as fluoroquinolones and extended-spectrum cephalosporins (ESCs) [4]. ST131 first came to attention in the 2000s in association with the globally disseminated CTX-M-15 extended-spectrum beta-lactamase (ESBL) [4]. Its most extensively resistant and epidemiologically successful clonal subset, designated ST131-H30 [5] because it contains allele 30 of the type-1 fimbriae adhesin gene fimH [6], appeared only in approximately 2000 and subsequently rose to prominence worldwide (Figure 1) [7, 8].
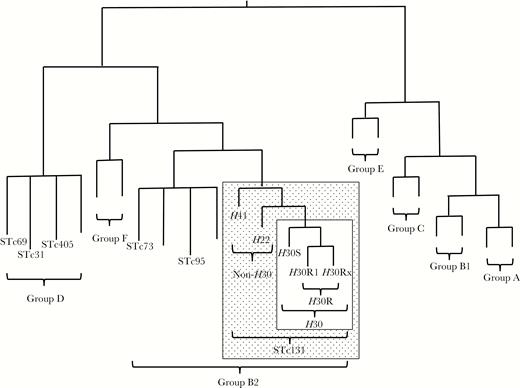
Phylogeny of Escherichia coli and sequence type complex (STc) 131. The phylogram is illustrative only; branch lengths are not to scale, and tree conformation is approximate. Phylogenetic groups are identified with brackets. Each STc included in the present study is labeled; unlabeled branches represent other (unstudied) STs within the indicated phylogenetic groups. Stippled rectangle, STc131; open rectangle within stippled rectangle, ST131-H30 subclone.
Nearly all H30 isolates, except for rare fluoroquinolone-susceptible variants from the ancestral H30S subclone, represent the H30R subclone (Figure 1) [5]. H30R strains are uniformly fluoroquinolone-resistant due to conserved replacement mutations in gyrA and parC [6]. The H30R subclone comprises 2 sister clades, termed H30R1 and H30Rx (Figure 1) [5, 9, 10]. Whereas H30R1 strains usually lack ESBL production (some do produce CTX-M-14 or CTX-M-27 [11]), H30Rx strains usually produce CTX-M-15 [5].
In contrast, non-H30 ST131 isolates are both less common and, usually, less extensively resistant. Representatives of the ancestral H41 clade exhibit fimH allele 41 and the O16 antigen, whereas representatives of the H22 clade usually exhibit fimH allele 22 and, like H30 strains, the O25b antigen (Figure 1) [5, 12].
Previous national surveys have identified ST131 as the leading cause of ESBL-producing, fluoroquinolone-resistant, and multidrug-resistant (MDR) E. coli infections in the United States [13–15]. However, because these studies antedated the discovery of the fine clonal structure of ST131 (Figure 1), none tested specifically for H30Rx, and only 1 tested for H30 [15]. Additionally, 1 was limited to isolates from 2007–2009 [13], another to a convenience sample of ESBL-producing isolates from 2000–2009 [14], and a third to Veterans Affairs (VA) Medical Center isolates from 2010–2011 [15]. We undertook this study for an updated, adequately sized, nationally representative survey of E. coli clinical isolates that could establish the current overall prevalence in the United States of key ST131 clonal subsets, determine their contribution to relevant resistance phenotypes, and define their virulence characteristics, resistance genotypes, and host associations.
METHODS
Isolates
Each year the SENTRY Antimicrobial Surveillance Program (JMI Laboratories) monitors clinical isolates by infection site in a prevalence design mode. The core objectives (bloodstream infection [BSI], community-acquired respiratory tract infection, patients hospitalized with pneumonia, and skin and skin-structure infection [SSSI]) have been monitored annually since 1997. Other objectives vary by the year to address the needs of the sponsors or scientific requirements defined by the JMI Laboratories principal investigators.
Participating medical centers in the United States, Europe, Latin America, and Asia-Pacific countries collect consecutive bacterial isolates for the SENTRY Program (1 per patient) according to site of infection. Each center contributes either 500 or 250 total isolates, distributed by specimen type as follows (for centers supplying 500/250 isolates per year): BSI, 100/50; community-acquired respiratory tract infection, 60/30; pneumonia in hospitalized patients, 120/50; SSSI, 100/50; specified organisms of any infection site, 40/70; urinary tract infections: 50/0; and intra-abdominal infections, 30/0.
During 2011–2012, the SENTRY Antimicrobial Surveillance Programs collected systematically 4482 nonduplicate E. coli clinical isolates from patients hospitalized in multiple widely distributed US medical centers. Of these, 565 (13%) exhibited reduced broth microdilution susceptibility or full resistance to ESCs [16] so were classified as “ESC-reduced susceptibility” (ESC-RS). The remaining isolates, all fully ESC-susceptible, were classified based on ciprofloxacin minimum inhibitory concentration as being either fluoroquinolone-resistant (20%) or fluoroquinolone-susceptible (67%). From the 3 resulting resistance categories— that is, ESC-RS (+/- fluoroquinolone-resistant); ESC-susceptible, fluoroquinolone-resistant (hereafter, “fluoroquinolone-resistant”); and ESC-susceptible, fluoroquinolone-susceptible (hereafter, “fluoroquinolone-susceptible”)—60 isolates per category were selected randomly for both 2011 and 2012, giving 120 isolates per category, or 360 total study isolates.
Susceptibility Testing
Susceptibility to 12 antimicrobial agents was assessed by broth microdilution (JMI Laboratories) or, for ertapenem, gradient elution (J.R.J.’s laboratory), according to procedures and interpretive criteria specified by the Clinical Laboratory Standards Institute [16, 17] or, for Etest, the manufacturer’s instructions (bioMérieux). Intermediate results were analyzed as resistant. Multidrug-resistant (MDR) isolates were those resistant to at least 1 representative of ≥3 antimicrobial classes—that is, penicillins (ampicillin/sulbactam, piperacillin-tazobactam), ESCs and monobactams (cefotaxime, ceftriaxone, ceftazidime, aztreonam), carbapenems (ertapenem, imipenem), aminoglycosides (gentamicin), fluoroquinolones (ciprofloxacin), tetracyclines (tetracycline), and antifolate agents (trimethoprim-sulfamethoxazole) [18]. The resistance score was the number of antimicrobial classes to which resistance was detected [18].
Genotyping
Polymerase chain reaction (PCR)–based typing was done using duplicate boiled lysates as template DNA, established multiplex PCR-based assays, and relevant positive and negative controls. Phylogroups A, B1, B2, C, D, E, and F (Figure 1) were detected per Clermont et al [19]. ST131 and its clonal subsets (Figure 1), 5 other important ST complexes (ie, groups of closely related sequence types [STs]) that are associated with high prevalence and/or antimicrobial resistance (from group B2: STc73 and STc95; from group D: STc31 [O15:K52:H1], STc69 [“clonal group A,” or CGA], and STc405) (Figure 1), and the ST131-associated O25b and O16 rfb variants were detected as described previously [12, 15, 20–25].
Extended virulence genotypes for 51 extraintestinal virulence-associated genes and variants thereof were detected using an established multiplex PCR assay [26]. The virulence gene score, which corresponds with virulence both epidemiologically and experimentally [27, 28], was the number of virulence operons detected. Isolates were classified presumptively as extraintestinal pathogenic E. coli (ExPEC) if positive for >2 of papAH and/or papC (P fimbriae, counted as 1), sfa/focDE (S and F1C fimbriae), afa/draBC (Dr-binding adhesins), kpsM II (group 2 capsule), and iutA (aerobactin receptor) [29].
The ESC-RS isolates were screened for broad-spectrum beta-lactamase genes using the Check-MDR CT101 kit (Check-Points) according to the manufacturer’s instructions. This kit detects various CTX-M groups (1, 2, 8/25, and 9), TEM, SHV, ACC, ACT/MIR, CMYII, DHA, FOX, KPC, and NDM-1. Selected genes were sequenced to define molecular variants [30].
Statistical Methods
Using SPSS version 16 (IBM Analytics), comparisons involving dichotomous variables were tested using an “N − 1” χ2 test for 2 × 2 tables [31] and Fisher’s exact test (2-tailed) for 2 × 3 or larger tables; those involving continuous variables were tested using the Mann-Whitney U test or Kruskal-Wallis test. The significance threshold was P < .05. Due to the study’s exploratory nature, multiple comparison adjustments were not made.
Ethics Approval
The Minneapolis VA Health Care System Institutional Review Board reviewed and approved the study.
RESULTS
Isolates
The 360 E. coli study isolates were derived from 64 clinical laboratories in 55 US cities, 36 states, and all nine US geographical regions. Overall, specimen types included blood (43%), urine (9%), respiratory (23%), skin/tissue/abscess (22%), abdominal (2.2%), and other (0.8%) (Table 1). Forty-nine percent of isolates were from male patients. Geographical region of origin, specimen type (Table 1), and sex distribution did not vary significantly between the 3 resistance categories. In contrast, patients with fluoroquinolone-susceptible isolates were slightly younger (median age = 57 years; range = 0–97) than those with fluoroquinolone-resistant isolates (median age = 64 years; range = 0–93), or ESC-RS isolates (median age = 60 years; range = 0–94) (P = .009).
Distribution of Isolates by Specimen Type Within Each Resistance Category, Overall and Stratified by ST131-H30 Status
| Specimen Typea No. (%) n = 358 | ESC-RS | FQ-R | FQ-Sc, No. of Isolates (Column %) | P Valued, ESC-RS vs FQ-R vs FQ-S | ||||||
|---|---|---|---|---|---|---|---|---|---|---|
| No. of Isolates (Column %) | P Value d , Non- H30 vs H30 | No. of Isolates (Column %) | P Value d , Non- H30 vs H30 | |||||||
| Total n = 118 | Non-H30b n = 66 | H30b n = 52 | Total n = 120 | Non-H30b n = 35 | H30b n = 85 | Total n = 120 | ||||
| Blood: 155 (45%) | 46 (39) | 28 (42) | 18 (35) | .45 | 56 (47) | 25 (71) | 31 (37) | .001 | 53 (44) | .46 |
| Genitourinary: 33 (9%) | 9 (8) | 7 (11) | 2 (4) | .30 | 12 (10) | 0 (0) | 12 (14) | .02 | 12 (10) | .83 |
| Respiratory: 82 (23%) | 32 (27) | 14 (21) | 18 (35) | .14 | 30 (25) | 7 (20) | 23 (27) | .49 | 20 (17) | .12 |
| Skin/tissue/abscess: 77 (22%) | 28 (24) | 15 (23) | 13 (25) | .83 | 18 (15) | 2 (6) | 16 (19) | .09 | 31 (26) | .09 |
| Abdominal: 8 (2.2%) | 2 (3) | 2 (3) | 1 (2) | 1.0 | 2 (2) | 1 (3) | 1 (1) | .50 | 3 (3) | .91 |
| Other: 3 (0.8%) | 0 (0) | 0 (0) | 0 (0) | n.a. | 2 (2) | 0 (0) | 2 (2) | 1.0 | 1 (1) | .78 |
Abbreviations: ESC-RS, extended-spectrum cephalosporin-reduced susceptibility; FQ-R, fluoroquinolone-resistant; FQ-S, fluoroquinolone-susceptible.
aSpecimen type was unknown for two isolates; % values shown are for the 358 isolates with known specimen type.
bST131-H30 (= H30), H30 subclone of Escherichia coli sequence type 131. Non-H30, all E. coli other than those from the ST131-H30 subclone.
cNo FQ-S isolates were H30 subclone members.
dP values (by Fisher’s exact test, two-tailed) are for comparisons between H30 and non-H30 isolates within a given resistance category (ESC-RS or FQ-R), or across the 3 resistance categories. P values are shown in boldface where P < .05.
Phylogenetic and Clonal Distribution
Of the 7 recognized E. coli phylogroups (Figure 1), group B2 dominated, both overall (72%) and within each resistance category (62%–83%) (Table 2). In contrast, each non-B2 phylogroup accounted for ≤9% of isolates overall and ≤11% within any given resistance category. Significant prevalence differences were evident across resistance categories for phylogroup B2 (most prevalent among fluoroquinolone-resistant isolates) and phylogroup F (most prevalent among ESC-RS isolates).
Prevalence of Phylogroups and Clonal Groups in Relation to Resistance Category Among 360 Escherichia coli Clinical Isolates
| Category | Specific trait | Prevalence a of trait, No. (Column %) | P Valueb | |||
|---|---|---|---|---|---|---|
| Total n = 360 | ESC-RS n = 120 | FQ-R n = 120 | FQ-S n = 120 | |||
| Phylogroup | Group A | 22 (6) | 10 (8) | 3 (3) | 9 (8) | .13 |
| Group B1 | 22 (6) | 8 (7) | 3 (3) | 11 (9) | .50 | |
| Group B2 | 258 (72) | 74 (62) | 100 (83) | 84 (70) | .001 | |
| Group C | 6 (2) | 5 (4) | 0 (0) | 1 (1) | .051 | |
| Group D | 34 (9) | 10 (8) | 11 (9) | 13 (11) | .85 | |
| Group E | 5 (1.4) | 3 (3) | 1 (1) | 1 (1) | .63 | |
| Group F | 13 (4) | 10 (8) | 2 (2) | 1 (1) | .006 | |
| Clonal group(s) | STc131 (group B2) | 159 (44) | 60 (50) | 90 (75) | 9 (8) | < .001 |
| STc131-H30 | 138 (38) | 53 (44) | 85 (71) | 0 (0) | < .001 | |
| H30R1 | 84 (23) | 14 (12) | 70 (58) | 0 (0) | < .001 | |
| H30Rx | 54 (15) | 39 (33) | 15 (13) | 0 (0) | < .001 | |
| Non-H30 STc131 | 21 (6) | 7 (6) | 5 (4) | 9 (8) | .55 | |
| O25b non-H30 | 10 (3) | 4 (3) | 2 (2) | 4 (3) | .64 | |
| O16 non-H30 | 11 (3) | 3 (3) | 3 (3) | 5 (4) | .69 | |
| STc95 (group B2) | 21 (6) | 0 (0) | 1 (1) | 20 (17) | < .001 | |
| STc73 (group B2) | 23 (6) | 5 (4) | 0 (0) | 18 (15) | < .001 | |
| All other group B2 clonal groups | 55 (15) | 9 (8) | 9 (8) | 37 (31) | < .001 | |
| STc31/O15 (group D) | 6 (2) | 0 (0) | 5 (4) | 1 (1) | .051 | |
| STc69/CGA (group D) | 12 (3) | 0 (0) | 3 (3) | 9 (8) | .003 | |
| STc405 (group D) | 7 (2) | 5 (4) | 1 (1) | 1 (1) | .23 | |
| All other group D clonal groups | 9 (3) | 5 (5) | 2 (2) | 2 (2) | .69 | |
Abbreviations: ESC-RS, extended-spectrum cephalosporin-reduced susceptibility (whether or not fluoroquinolone-resistant); FQ-R, fluoroquinolone-resistant and ESC-susceptible; FQ-S, fluoroquinolone-susceptible and ESC-susceptible.
aBoldface indicates the resistance category with the highest prevalence value.
bP values (by Fisher’s exact test) are for three-group comparisons: ESC-RS, FQ-R, FQ-S.
Overall, ST131 was by far the most prevalent identified clonal group (44% overall); it accounted for 61% of all phylogroup B2 isolates and was more prevalent than all non-B2 isolates combined (28%) (Table 2). ST131 was represented mainly by its H30 subclone (38% overall prevalence), with its H30R1 and H30Rx subsets (23% and 15%, respectively), but also by the O25b- and O16-associated non-H30 ST131 lineages (3% each; 6% combined). It was broadly distributed by specimen type, differing from non-ST131 isolates only for the proportion from blood versus urine within the fluoroquinolone-resistant category (Table 1).
The relative prevalence of the ST131 clonal subsets varied greatly by resistance category. That is, H30Rx was associated mainly with ESC-RS isolates (33% prevalence), and H30 and H30R1 were associated mainly with fluoroquinolone-resistant isolates (71% and 58% prevalence, respectively). In contrast, non-H30 ST131 isolates were the sole ST131 representatives among the fluoroquinolone-susceptible isolates (8% prevalence).
Regarding non-ST131 clonal groups (Figure 1), group B2-derived STc95 and STc73 each accounted for 6% of total isolates, whereas group D-derived STc31 (the O15 clonal group), STc69, and STc405 each accounted for only 2%–3% of total isolates (Table 2). Their distribution also varied greatly by resistance category, with STc95, STc73, and STc69 concentrated significantly among fluoroquinolone-susceptible isolates; STc73 and STc405 prominent among ESC-RS isolates; and STc31 concentrated among fluoroquinolone-resistant isolates.
Prevalence in Source Population
Based on the above findings, the absolute contribution of each ST or clonal subset to the SENTRY source population was estimated by multiplying the particular subset’s prevalence within a given resistance category by that resistance category’s fractional contribution to the SENTRY source population, then summing the resulting values across the 3 resistance categories [15]. The final overall prevalence estimates were as follows: ST131, 26.4%; ST131-H30, 19.8%; ST131-H30R1, 13.2%; ST131-H30Rx, 6.6%; and non-H30 ST131, 6.6%. ST131-H30 was more prevalent overall than any other phylogenetic group or ST; the next most prevalent STs were ST95 (11.4%) and ST73 (10.6%).
Co-resistance
The prevalence of resistance to the studied antimicrobial agents ranged overall from 1% (imipenem) to 70% (ampicillin-sulbactam) and differed significantly by resistance category (not shown). The ESC-RS isolates exhibited the highest resistance prevalence for all agents, including non-beta-lactams other than ciprofloxacin (100% resistance among the fluoroquinolone-resistant isolates, by definition) (not shown). Accordingly, resistance scores were highest for ESC-RS isolates (median = 4; range = 0–6), intermediate for fluoroquinolone-resistant isolates (median = 2; range = 1–4), and lowest for fluoroquinolone-susceptible isolates (median = 0; range = 0–2) (P < .001 for each pairwise comparison, Mann-Whitney test).
Virulence Genes
Of the studied virulence genes, all but 4 were detected in ≥1 isolate each, with overall prevalence values ranging from 1% (papG allele 1; variant P adhesin) to 99% (fimH) (Table 3). Most virulence genes varied significantly in prevalence by resistance category. That is, fluoroquinolone-susceptible isolates had the highest virulence gene prevalence for the greatest number of genes (n = 22), followed by fluoroquinolone-resistant isolates (n = 7), then ESC-RS isolates (n = 2). Accordingly, virulence scores were significantly higher among fluoroquinolone-susceptible isolates (median = 11; range = 1–20) than among fluoroquinolone-resistant isolates (median = 9; range = 1–15; P < .001) or ESC-RS isolates (median = 10; range = 1–17; P < .001).
Prevalence of Virulence Traits in Relation to Resistance Category Among 360 Escherichia coli Clinical Isolates
| Category | Specific Traita,b,c,d | Prevalence of Traite, No. (Column %) | P Valuef | |||
|---|---|---|---|---|---|---|
| Total n = 360 | ESC-RS n = 120 | FQ-R n = 120 | FQ-S n = 120 | |||
| Adhesins | papA/C/EF/G | 80 (22) | 26 (22) | 8 (7) | 46 (38) | < .001 |
| papG allele II | 66 (18) | 22 (18) | 8 (7) | 36 (30) | < .001 | |
| papG allele III | 21 (6) | 7 (6) | 0 (0) | 14 (12) | < .001 | |
| sfa/focDE | 40 (11) | 7 (6) | 0 (0) | 33 (28) | < .001 | |
| sfaS | 7 (2) | 1 (1) | 0 (0) | 6 (5) | .02 | |
| focG | 24 (7) | 3 (3) | 0 (0) | 21 (18) | < .001 | |
| afa/draBC | 25 (7) | 13 (11) | 3 (3) | 9 (8) | .03 | |
| iha | 204 (57) | 67 (56) | 101 (84) | 36 (30) | < .001 | |
| hra | 76 (21) | 35 (29) | 4 (3) | 37 (31) | < .001 | |
| Toxins | hlyD | 57 (16) | 20 (17) | 2 (2) | 35 (29) | .005 |
| hlyF | 20 (6) | 5 (4) | 3 (3) | 12 (10) | .04 | |
| cnf1 | 35 (10) | 14 (12) | 0 (0) | 21 (18) | < .001 | |
| cdtB | 10 (3) | 1 (1) | 0 (0) | 9 (8) | .001 | |
| sat | 199 (55) | 65 (54) | 101 (84) | 33 (28) | < .001 | |
| pic | 17 (5) | 4 (3) | 0 (0) | 13 (11) | < .001 | |
| vat | 99 (28) | 15 (13) | 9 (8) | 75 (63) | < .001 | |
| Siderophores | iroN | 59 (16) | 11 (9) | 3 (3) | 45 (38) | < .001 |
| ireA | 30 (8) | 5 (4) | 1 (1) | 24 (20) | < .001 | |
| iutA | 242 (67) | 87 (73) | 107 (89) | 48 (40) | < .001 | |
| Protectins | K1 capsule | 54 (15) | 7 (6) | 8 (7) | 39 (33) | < .001 |
| K5 capsule | 66 (18) | 18 (15) | 36 (30) | 12 (10) | < .001 | |
| K2/K100 capsule | 48 (13) | 31 (26) | 9 (8) | 8 (7) | < .001 | |
| iss | 20 (6) | 3 (4) | 3 (3) | 13 (11) | .02 | |
| Miscellaneous | usp | 260 (72) | 73 (61) | 102 (85) | 85 (71) | < .001 |
| ibeA | 36 (10) | 3 (3) | 3 (3) | 30 (25) | < .001 | |
| ompT | 280 (78) | 82 (68) | 103 (86) | 95 (79) | .005 | |
| H7 fliC | 20 (6) | 1 (1) | 0 (0) | 19 (16) | < .001 | |
| malX | 265 (74) | 88 (73) | 104 (87) | 73 (61) | < .001 | |
| clbB/N | 66 (18) | 12 (10) | 0 (0) | 54 (45) | < .001 | |
Abbreviations: ESC-RS, extended-spectrum cephalosporin-reduced susceptibility (whether or not fluoroquinolone-resistant); FQ-R, fluoroquinolone-resistant and ESC-susceptible; FQ-S, fluoroquinolone-susceptible and ESC-susceptible.
aTraits shown are those that yielded P < .05 for the 3-group comparison.
bTrait definitions: papA/C/EF/G, P fimbriae major subunit, assembly, minor subunits, and adhesin (which gave similar results); papG alleles II and III, variant P adhesins; sfa/focDE, S and F1C fimbriae; sfaS, S fimbriae adhesin; focG, F1C fimbriae adhesin; afa/draBC, Dr-binding adhesins; iha, adhesin-siderophore receptor; hra, heat-resistant agglutinin; hlyD, alpha hemolysin; hlyF, variant hemolysin; cnf1, cytotoxic necrotizing factor 1; cdtB cytolethal distending toxin; sat, secreted autotransporter toxin; pic, protein associated with intestinal colonization; vat, vacuolating toxin; iroN, salmochelin receptor; ireA, catecholate siderophore receptor; iutA, aerobactin receptor; K2, K5, K2/K100, group 2 capsule variants; iss, increased serum survival; usp, uropathogenic-specific protein; ibeA, invasion of brain endothelium A; ompT, outer membrane protease; H7 fliC, flagellar variant; malX, pathogenicity island marker; clb/N, colibactin (polyketide) synthesis.
cTraits detected in ≥1 isolate but not significantly associated with resistance category (definition, % of 360 with trait): papG allele 1 (variant P adhesin, 1%), gafD (G fimbriae, 1%), fimH (type-1 fimbriae adhesin, 99%), tsh (temperature-sensitive hemagglutinin, 2%), astA (enteroaggregative E. coli toxin, 3%), fyuA (yersiniabactin receptor, 88%), kpsM II (group 2 capsules, 69%), K15 (variant group 2 capsule, 1%), kpsMT III (group 3 capsules, 3%), rfc (O4 lipopolysaccharide, 2%), traT (serum-resistance associated, 74%), cvaC (microcin V, 4%), ExPEC (extraintestinal pathogenic E. coli, 64%).
dTraits sought but not detected in any isolate: afaE8, clpG, F17, bmaE (variant mannose-resistant adhesins).
eBoldface indicates the resistance category with the highest prevalence value.
fP values (by Fisher’s exact test) are for 3-group comparisons: ESC-RS, FQ-R, FQ-S.
Comparison of ST131 and Non-ST131 Isolates
To gain insights into ST131’s predominance among ESC-RS and fluoroquinolone-resistant isolates, ST131 and non-ST131 isolates were compared within each resistance category. According to the prevalence of resistance to individual agents (Table 4) and resistance scores (Table 5), ST131 isolates were more extensively resistant than non-ST131 isolates within the ESC-RS and fluoroquinolone-susceptible categories, but not the fluoroquinolone-resistant category. They also had distinctive virulence gene profiles within each resistance category and a higher ExPEC fraction within the ESC-RS and fluoroquinolone-susceptible categories (Table 4). Additionally, they tended to derive from somewhat older patients within the ESC-RS category (median age = 61 years vs 56 years) and fluoroquinolone-resistant category (median age = 64 vs 63 years) but from somewhat younger patients within the fluoroquinolone-susceptible category (median age = 53 vs 56.5 years).
Prevalence of Resistance Phenotypes and Virulence Traits in Relation to Sequence Type 131 (ST131) Status Within Each Resistance Category Among 360 Escherichia coli Clinical Isolates
| Category | Specific Trait a | ESC-RS:Trait prevalence, No. (Column %)b | P Valuec | FQ-R: Trait Prevalence, No. (Column %)b | P Valuec | FQ-S: Trait Prevalence, No. (Column %)b | P Valuec | |||
|---|---|---|---|---|---|---|---|---|---|---|
| Non-ST131 n = 60 | ST131 n = 60 | Non-ST131 n = 30 | ST131 n = 90 | Non-ST131 n = 111 | ST131 n = 9 | |||||
| Resistance | Amp-sulbactam | 59 (98) | 53 (88) | .03 | 22 (73) | 74 (82) | .29 | 35 (32) | 8 (89) | .001 |
| Cefotaxime | 52 (87) | 58 (97) | .048 | 1 (3) | 1 (1) | .44 | 0 (0) | 0 (0) | NA | |
| Ceftriaxone | 47 (78) | 57 (95) | .007 | 1 (3) | 0 (0) | .08 | 0 (0) | 0 (0) | NA | |
| Gentamicin | 16 (27) | 23 (38) | .17 | 7 (23) | 22 (24) | .90 | 2 (2) | 4 (44) | < .001 | |
| Ciprofloxacin | 35 (58) | 57 (95) | < .001 | 30 (100) | 90 (100) | NA | 0 (0) | 0 (0) | NA | |
| MDR (≥ 3 classes) | 38 (63) | 55 (92) | < .001 | 12 (40) | 35 (39) | .54 | 0 (0) | 0 (0) | NA | |
| Adhesins | papAH/C/EG/G | 9 (15) | 17 (28) | .06 | 7 (23) | 1 (1) | < .001 | 45 (41) | 1 (11) | .08 |
| papG allele II | 5 (8) | 17 (28) | .004 | 7 (23) | 1 (1) | < .001 | 35 (32) | 1 (11) | .28 | |
| papG allele III | 7 (12) | 0 (0) | .006 | 0 (0) | 0 (0) | NA | 14 (13) | 0 (0) | .31 | |
| sfa/focDE | 7 (12) | 0 (0) | .006 | 0 (0) | 0 (0) | NA | 32 (29) | 1 (11) | .23 | |
| afa/draBC | 1 (2) | 12 (20) | .001 | 2 (6) | 1 (1) | .15 | 5 (5) | 4 (44) | .002 | |
| iha | 10 (17) | 57 (95) | < .001 | 15 (50) | 86 (96) | < .001 | 29 (26) | 7 (78) | .003 | |
| Toxins | hlyF | 5 (8) | 0 (0) | .06 | 3 (10) | 0 (0) | .01 | 12 (11) | 0 (0) | .60 |
| sat | 9 (15) | 56 (93) | < .001 | 16 (53) | 85 (94) | < .001 | 27 (24) | 6 (67) | .01 | |
| vat | 13 (21) | 2 (3) | .004 | 9 (30) | 0 (0) | < .001 | 75 (68) | 0 (0) | < .001 | |
| Siderophores | iroN | 11 (18) | 0 (0) | .001 | 3 (10) | 0 (0) | .01 | 44 (40) | 1 (11) | .15 |
| fyuA | 41 (68) | 60 (100) | < .001 | 21 (70) | 90 (100) | < .001 | 95 (86) | 9 (100) | .60 | |
| iutA | 30 (50) | 57 (95) | < .001 | 21 (70) | 86 (96) | < .001 | 41 (37) | 7 (78) | .03 | |
| Protectins | kpsM II | 25 (42) | 57 (95) | < .001 | 22 (73) | 57 (63) | .38 | 79 (72) | 9 (100) | .11 |
| kpsMT III | 7 (12) | 0 (0) | .01 | 1 (3) | 0 (0) | .25 | 4 (4) | 0 (0) | 1.0 | |
| K1 | 7 (12) | 0 (0) | .01 | 8 (27) | 0 (0) | < .001 | 39 (35) | 0 (0) | .03 | |
| K5 | 2 (3) | 16 (27) | .001 | 0 (0) | 36 (40) | < .001 | 10 (9) | 2 (22) | .22 | |
| K2/K100 | 4 (7) | 27 (45) | < .001 | 4 (13) | 5 (6) | .23 | 3 (3) | 5 (56) | < .001 | |
| iss | 4 (7) | 0 (0) | .12 | 3 (10) | 0 (0) | .01 | 13 (12) | 0 (0) | .60 | |
| traT | 44 (73) | 52 (87) | .11 | 9 (30) | 76 (84) | < .001 | 78 (70) | 9 (100) | .06 | |
| Miscellaneous | usp | 13 (22) | 60 (100) | < .001 | 12 (40) | 90 (100) | < .001 | 76 (69) | 9 (100) | .06 |
| ibeA | 3 (5) | 0 (0) | .24 | 3 (10) | 0 (0) | .01 | 27 (24) | 3 (33) | .69 | |
| ompT | 24 (40) | 58 (97) | < .001 | 16 (53) | 87 (97) | < .001 | 86 (77) | 9 (100) | .20 | |
| malX | 28 (53) | 60 (100) | < .001 | 14 (47) | 90 (100) | < .001 | 64 (58) | 9 (100) | .01 | |
| clbB/N | 12 (20) | 0 (0) | < .001 | 0 (0) | 0 (0) | NA | 66 (33) | 0 (0) | .004 | |
| ExPEC | 23 (38) | 56 (93) | < .001 | 18 (60) | 57 (63) | .83 | 68 (61) | 9 (100) | .03 | |
Abbreviations: Amp, ampicillin; ESC-RS, extended-spectrum cephalosporin-reduced susceptibility (whether or not fluoroquinolone-resistant); ExPEC, extraintestinal pathogenic Escherichia coli; FQ-R, fluoroquinolone-resistant and ESC-susceptible; FQ-S, fluoroquinolone-susceptible and ESC-susceptible; MDR, multidrug-resistant; NA, not applicable (prevalence 0% in both comparison groups)
aTraits shown are those that yielded P < .05 for at least 1 comparison (ST131 vs non-ST131). Trait definitions are as shown in Table 3.
bBoldface indicates comparison group with higher resistance prevalence.
cP values (by “N − 1” χ2 test) are show in boldface where P < .05.
Resistance Score and Virulence Score in Relation to Sequence Type 131 (ST131) Status Within Each Resistance Category Among 360 Escherichia coli Clinical Isolates
| Variable | Resistance Category | Non-ST131 | ST131 | P Value b | ||
|---|---|---|---|---|---|---|
| No. of Isolates | Median Score (Range) | No. of Isolates | Median scorea (Range) | |||
| Resistance score | ESC-RS | 60 | 3 (0–6) | 60 | 4 (2–6) | .02 |
| FQ-R | 30 | 2 (1–4) | 90 | 2 (1–4) | .85 | |
| FQ-S | 111 | 0 (0–2) | 9 | 1 (0–2) | .003 | |
| Virulence score | ESC-RS | 60 | 6 (1–17) | 60 | 10 (6–14.75) | < .001 |
| FQ-R | 30 | 8 (1–15) | 90 | 9 (6–12) | < .001 | |
| FQ-S | 111 | 11 (1–20) | 6 | 11 (9–13) | .95 | |
Abbreviations: ESC-RS, extended-spectrum cephalosporin-reduced susceptibility (whether or not fluoroquinolone-resistant); FQ-R, fluoroquinolone-resistant and ESC-susceptible; FQ-S, fluoroquinolone-susceptible and ESC-susceptible.
aBoldface indicates results for the comparison group with a significantly higher score.
bP values (by Mann-Whitney test, 2-tailed) are in boldface where P < .05.
Comparisons Among ST131 Clonal Subsets
The non-H30, H30R1, and H30Rx ST131 clonal subsets also differed significantly from one another for multiple resistance phenotypes and virulence and resistance genes (Table 6) plus host characteristics. Non-H30 ST131 isolates had the highest prevalence for ertapenem resistance and 4 virulence genes, H30R1 isolates had the highest prevalence for K5 capsule, and H30Rx isolates had the highest prevalence for 5 resistance phenotypes, 10 virulence genes, and ExPEC status (Table 6). Accordingly, resistance scores were higher among H30R isolates (median = 3; range = 1–5) and H30Rx isolates (median = 3; range = 1–6) than among non-H30 isolates (median = 2; range = 0–6) (P < .001), whereas virulence scores were higher among non-H30 isolates (median =10; range = 7–13) and H30Rx isolates (median = 10; range = 6–14.75) than among H30R isolates (median = 9; range = 6–12) (P < .001). Additionally, the source patients for non-H30 isolates were more commonly female (71%, vs 41–43%; P = .04) and slightly younger (median age = 55 years, vs 58–59 years; P = .75) than those for H30R1 and H30Rx isolates.
Prevalence of Resistance Phenotypes and Virulence Traits in Relation to Clonal Subset Among 159 Escherichia coli Sequence Type 131 (ST131) Clinical Isolates
| Category | Specific Trait a | Prevalence b of Trait, No. (Column %) | P Value c | |||
|---|---|---|---|---|---|---|
| Total ST131 n = 159 | non-H30 n = 21 | H30R1 n = 84 | H30Rx n = 53 | |||
| Resistance | Piperacillin-tazobactam | 26 (16) | 1 (5) | 11 (13) | 14 (26) | .05 |
| Cefotaxime | 59 (37) | 3 (33) | 12 (14) | 40 (74) | < .001 | |
| Ceftazidime | 39 (25) | 6 (29) | 5 (6) | 28 (52) | < .001 | |
| Ceftriaxone | 57 (36) | 7 (33) | 12 (14) | 38 (70) | < .001 | |
| Aztreonam | 50 (31) | 3 (33) | 9 (11) | 34 (63) | < .001 | |
| Ertapenem | 4 (3) | 2 (10) | 0 (0) | 2 (4) | .02 | |
| Ciprofloxacin | 147 (93) | 9 (43) | 84 (100) | 54 (100) | < .001 | |
| MDR (≥3 classes) | 90 (57) | 9 (43) | 43 (51) | 38 (70) | .03 | |
| Adhesins | papA/HC/EF/G | 19 (12) | 4 (19) | 1 (1) | 14 (26) | < .001 |
| papG allele II | 19 (12) | 4 (19) | 1 (1) | 14 (26) | < .001 | |
| afa/draBC | 17 (11) | 5 (24) | 0 (0) | 12 (22) | < .001 | |
| hra | 18 (11) | 1 (5) | 1 (1) | 16 (30) | < .001 | |
| hlyD | 13 (8) | 4 (19) | 1 (1) | 8 (15) | < .001 | |
| cnf1 | 8 (5) | 1 (5) | 1 (1) | 6 (11) | .03 | |
| sat | 147 (93) | 16 (76) | 79 (94) | 52 (96) | .02 | |
| iutA | 150 (94) | 17 (81) | 80 (95) | 53 (98) | .03 | |
| kpsM II | 17 (77) | 17 (81) | 53 (63) | 53 (98) | < .001 | |
| K2/K100 | 37 (23) | 10 (48) | 1 (1.2) | 26 (48) | < .001 | |
| K5 | 54 (34) | 2 (10) | 44 (52) | 8 (15) | < .001 | |
| K15 | 4 (3) | 4 (19) | 0 (0) | 0 (0) | < .001 | |
| ibeA | 3 (2) | 3 (14) | 0 (0) | 0 (0) | .002 | |
| malX | 159 (100) | 21 (100) | 84 (100) | 53 (100) | .001 | |
| ExPEC | 122 (77) | 17 (81) | 52 (62) | 53 (98) | < .001 | |
Abbreviations: ExPEC, extraintestinal pathogenic Escherichia coli; MDR, multidrug resistant.
aTraits shown are those that yielded P < .05 for the 3-group comparison (non-H30, H30R1, H30Rx). Trait definitions are as shown in Table 3.
bBoldface indicates the resistance category with the highest prevalence value.
cP values (by Fisher’s exact test) are for the 3-group comparison.
Additionally, among non-H30 ST131 isolates, the O25b subset (typically H22; Figure 1), as compared with the O16 subset (typically H41; Figure 1), exhibited a higher prevalence of pap genes and hlyD (for each, 40% vs 0%; P = .04) and of kpsM II and ExPEC status (for each, 100% vs 64%; P = .04). In contrast, the O16 isolates were more commonly from blood samples (64% vs 20%; P = .049) and exhibited a higher prevalence of the K15 (36% vs 0%; P = .04) and K2/K100 (64% vs 30%; P = .049) capsule variants. Host age and sex did not vary with O25b versus O16 status.
Beta-Lactamase Genes
Of the 120 ESC-RS isolates, 107 (89%) contained ≥1 of the studied beta-lactamase genes, in decreasing prevalence as follows: CTX-M group 1 (49%), CTX-M group 9 (22%), CMYII (14%), KPC (2.5%), and SHV and TEM (1.7% each). CTX-M group 1 was significantly associated with ST131-H30 (66% [H30] vs 36% [others]; P = .002), whereas CMYII was significantly associated with non-H30 isolates (22% vs 4%; P = .004). Within H30, CTX-M group 1 was associated with H30Rx (90% vs 0%; P < .001) and CTX-M group 9 with H30R1 (86% vs 3%; P < .001). Selective sequence analysis showed that CTX-M group 1 was represented by blaCTX-M-15 (24/24, 100%), CTX-M group 9 mainly by blaCTX-M-14 (7/12, 58%) and blaCTX-M-27 (4/12, 33%), and CMY II by cmy2 (9/9, 100%).
Overall Contribution of ST131 to Resistance
Back-calculations similar to those described for overall prevalence estimates were used to estimate ST131’s net contribution to resistance within the SENTRY source population (Table 7) [15]. ST131 was estimated to account for 65%–71% of gentamicin, ciprofloxacin, trimethoprim-sulfamethoxazole, and multidrug resistance; 52%–55% of ESC and aztreonam resistance; 41%–44% of ampicillin-sulbactam, piperacillin-tazobactam, and tetracycline resistance; and 28%–33% of carbapenem resistance.
Estimated Overall Contribution of Sequence Type 131 (ST131) to Antimicrobial Resistance Within the SENTRY Collection
| Resistance Phenotype | Overall Prevalence, % a | ST131 fraction, % b |
|---|---|---|
| Ampicillin-sulbactam | 51.9 | 43.2 |
| Piperacillin-tazobactam | 8.4 | 42.0 |
| Cefotaxime | 12.0 | 52.7 |
| Ceftazidime | 7.8 | 52.7 |
| Ceftriaxone | 11.2 | 54.0 |
| Aztreonam | 9.6 | 54.9 |
| Ertapenem | 1.5 | 28.6 |
| Imipenem | 3.2 | 33.3 |
| Gentamicin | 12.3 | 67.7 |
| Tetracycline | 31.4 | 43.4 |
| Ciprofloxacin | 29.7 | 70.7 |
| Trimethoprim-sulfamethoxazole | 22.5 | 64.9 |
| Multidrug resistance (≥ 3 classes) | 17.7 | 65.9 |
aOverall resistance prevalence was imputed for each agent by multiplying the prevalence of resistance to that agent within a given resistance category by the fractional contribution of that resistance category to the total population, then summing these values across the 3 resistance categories.
bST131’s fractional contribution to overall resistance prevalence was imputed for each agent by calculating, for each resistance category, the net contribution of ST131 to resistance within that resistance category, then adjusting for the fractional contribution of that resistance category to the total population, and summing these values across the three resistance categories.
DISCUSSION
Here we assessed 360 diverse-source clinical E. coli isolates, as collected systematically from non-VA hospitals across the United States in 2011–2012, for phylogroup, clonal background, virulence genes, and beta-lactamase genes and compared these results with existing data for resistance phenotype, specimen type, and host age. This analysis yielded 3 main findings, with potentially important implications. First, ST131, and specifically its dominant H30R subclone, not only was the most prevalent strain overall but accounted for ≥50% of ESC-RS, fluoroquinolone-resistant, and MDR isolates, confirming its status as the main driver in the United States of the current epidemic of resistant E. coli. Second, the various ST131 clonal subsets exhibited distinctive associations with resistance phenotypes, virulence genotypes, and host subsets, confirming the importance of considering them individually rather than lumping them together as simply ST131. Third, ST131 isolates differed, or failed to differ, from relevant comparator non-ST131 isolates in ways that may explain their high prevalence among resistant isolates and low prevalence among susceptible isolates and that offer potential targets for interventions.
To our knowledge, this is the first study to screen for ST131 and its main clonal subsets—including H30R1, H30Rx, and non-H30 strains (divided as O16 vs O25b)—within a nationally representative reference set of systematically collected E. coli clinical isolates. Previous studies, including several to which the authors contributed, screened for ST131 subclones, but within more geographically, epidemiologically, and/or microbiologically restricted populations [14, 15, 18, 21, 32–34]—or examined broadly representative isolates, but without in-depth attention to key ST131 clonal subsets, or to recent (ie, post-2010) isolates [15, 35]. The present findings extend the results of these previous studies to the US population generally. In so doing, they confirm that ST131-H30R is the leading antimicrobial-resistant E. coli strain in the United States today, that its H30R1 subset is the leading cause of ESC-susceptible, fluoroquinolone-resistant E. coli infections, and that its H30Rx subset is the leading cause of ESC-RS E. coli infections, especially those involving co-resistance to fluoroquinolones, which has important implications for empirical therapy [3]. Likewise, they show that non-H30 ST131 strains, although minor contributors to each resistance category, are more extensively resistant than other fluoroquinolone-susceptible isolates and have distinctive host associations (eg, younger females).
The 26.4% absolute prevalence estimate for ST131 can be compared with similar estimates from previous national surveys, including of 2007 SENTRY isolates (17% ST131) [13] and 2011 VA isolates (28% ST131) [15]. These comparisons suggest that ST131’s prevalence in the United States increased relatively by >50% from 2007 to 2011–2012 and that the prevalence difference between 2007 SENTRY isolates and 2011 VA isolates reflected this temporal emergence rather than SENTRY vs VA host population differences. The fractional contribution of ST131 (mainly its ST131-H30R subclone) to different resistance phenotypes (eg, Table 7) was similar here and among the (contemporaneous) 2011 VA isolates [15] but generally higher in both these studies than among the 2007 SENTRY isolates [13], consistent with clonal expansion of H30R between 2007 and 2011–2012.
The present findings support the potential clinical utility of rapid diagnostic tests that can identify ST131 and its key clonal subsets. Such tests are under development that can return results in <1 hour, thereby potentially allowing their use for empirical antibiotic selection, even at the point of care [36]. Guidance from such tests conceivably could protect against both “bug–drug” mismatch (from unanticipated resistance) and excessively broad empirical therapy, thereby providing the double benefit of improved clinical outcomes and enhanced antimicrobial stewardship [37].
The basis for the ST131-H30R subclone’s impressive epidemiological success, which contrasts with the limited success of non-H30 ST131 strains, remains speculative. We found that, among ESC-RS isolates, ST131 strains (mainly H30Rx) have multiple advantages over non-ST131 strains, including more extensive resistance, more extensive virulence gene profiles, a greater ExPEC fraction, and a large disparity for group B2 background (100% vs 23%). Likewise, among fluoroquinolone-resistant isolates, although ST131 strains (mainly H30R1) have similarly extensive resistance profiles and a similar ExPEC fraction as non-ST131 strains, they have more extensive virulence profiles and a large disparity for group B2 background (100% vs 33%). In contrast, among fluoroquinolone-susceptible isolates, ST131 strains (all non-H30; equally O16 vs O25b) have only minor advantages over non-ST131 strains for group B2 background (100% vs 67%), extent of resistance, and ExPEC fraction and have comparably extensive virulence profiles. Thus, whereas, among ESC-RS and fluoroquinolone-resistant strains, ST131 strains (mainly H30Rx and H30R1) have multiple factors favoring their success over non-ST131 strains, among fluoroquinolone-susceptible strains, competition with other group B2 strains may have limited the non-H30 ST131 strains’ epidemiologic success.
Conserved accessory traits across the ST131 clonal subsets conceivably could provide useful targets for preventive or therapeutic interventions. Here, as in previous studies (reviewed in [4]), high-prevalence ST131-associated virulence genes included specific adhesins (fimH, iha), toxins (sat), siderophores (fyuA, iutA), group 2 capsule variants (kpsM II and others), and miscellaneous other traits (ompT, traT, malX). The UTI-preventing efficacy in mice of a vaccine based on the siderophores aerobactin and yersiniabactin, as documented recently using a non-ST131 group B2 challenge strain [38], suggests that such an approach might be effective also against ST131 strains, which typically produce both factors. Likewise, the nearly universal presence of the O25b rfb variant among ESC-RS and/or fluoroquinolone-resistant ST131 strains suggests that a recently described O25b-specific bacteriophage [39], or O25b protein conjugate vaccine [40], could protect broadly against such concerning ST131 variants. Such interventions should retain their effectiveness against even those O25b-positive ST131 variants that acquire new resistance mechanisms, including against carbapenems [41] and polymyxins [42].
The study has limitations. Clinical and epidemiologic data were largely lacking, precluding assessments of predisposing host factors, clinical presentation, management, and outcomes. The virulence and resistance genotyping was not comprehensive and did not address gene expression, copy number, or molecular variants. Some subgroups were small, limiting statistical power. Finally, the use of multiple comparisons risked finding putative differences by chance alone.
The study also has important strengths. These include the large, systematically assembled, broadly representative, post-2010 study population; the high-resolution clonal subtyping within ST131; attention to key non-ST131 clonal groups; and analysis of extended resistance profiles and virulence and resistance genotypes in relation to clonal background.
In summary, by analyzing a broadly representative panel of E. coli clinical isolates from non-VA hospitals across the United States (2011–2012), we documented that the ST131-H30R lineage, with its H30R1 and H30Rx subclones, was the leading cause of E. coli infections overall and was especially prominent among ESC-RS and fluoroquinolone-resistant isolates, having expanded by >50% since 2007. Focused attention to these ST131 clonal subsets, including with surveillance, diagnostic tests, treatment algorithms, and preventive measures, should help in confronting the ever-growing challenge of MDR E. coli infections.
Acknowledgments
Disclosure. The sponsors had no involvement in the conduct of the study, data analysis, manuscript preparation, or decision to publish.
Financial support. This material is based on work supported by an investigator-initiated grant from Merck and by Office of Research and Development, Medical Research Service, Department of Veterans Affairs (grant 1 I01 CX000192 01; both to J. R. J.).
Potential conflicts of interest. J. R. J. has received contracts, grants, or consultancies from Achaogen, Actavis, Jannsen, Merck, and Tetraphase, and has patent applications pertaining to tests for specific E. coli strains. M. C. is an employee of JMI Laboratories, which was contracted to perform services in 2016 for Achaogen, Actelion, Allecra, Allergan, Ampliphi, API, Astellas, AstraZeneca, Basilea, Bayer, BD, Biomodels, Cardeas, CEM-102 Pharma, Cempra, Cidara, Cormedix, CSA Biotech, Cubist, Debiopharm, Dipexium, Duke, Durata, Entasis, Fortress, Fox Chase Chemical, GSK, Medpace, Melinta, Merck, Micurx, Motif, N8 Medical, Nabriva, Nexcida, Novartis, Paratek, Pfizer, Polyphor, Rempex, Scynexis, Shionogi, Spero Therapeutics, Symbal Therapeutics, Synolgoic, TGV Therapeutics, The Medicines Company, Theravance, ThermoFisher, Venatorx, Wockhardt, and Zavante. Additionally, some JMI employees are advisors/consultants for Allergan, Astellas, Cubist, Pfizer, Cempra, and Theravance. All other authors: no reported conflicts. All authors have submitted the ICMJE Form for Disclosure of Potential Conflicts of Interest. Conflicts that the editors consider relevant to the content of the manuscript have been disclosed.
References
Author notes
Correspondence: J. R. Johnson, MD, Infectious Diseases (111F), Minneapolis VA Medical Center, 1 Veterans Dr, Minneapolis, MN 55417 ([email protected]).


Comments