


Abstract
Background. The accumulation of human immunodeficiency virus (HIV) resistance mutations can compromise treatment outcomes and promote transmission of drug-resistant virus. We conducted a study to determine the duration and evolution of genotypic drug resistance in the female genital tract among HIV-1-infected women failing first-line therapy.
Methods. Treatment failure was diagnosed based on World Health Organization (WHO) clinical or immunologic criteria, and second-line therapy was initiated. Stored plasma and genital samples were tested to determine the presence and timing of virologic failure and emergence of drug resistance. The median duration of genital shedding of genotypically resistant virus prior to regimen switch was estimated.
Results. Nineteen of 184 women were diagnosed with treatment failure, of whom 12 (63.2%) had confirmed virologic failure at the switch date. All 12 women with virologic failure (viral load, 5855–1 086 500 copies/mL) had dual-class resistance in plasma. Seven of the 12 (58.3%) had genital HIV-1 RNA levels high enough to amplify (673–116 494 copies/swab), all with dual-class resistance. The median time from detection of resistance in stored samples to regimen switch was 895 days (95% confidence interval [CI], 130–1414 days) for plasma and 629 days (95% CI, 341–984 days) for genital tract secretions.
Conclusions. Among women diagnosed with treatment failure using WHO clinical or immunologic criteria, over half had virologic failure confirmed in stored samples. Resistant HIV-1 RNA was shed in the genital tract at detectable levels for ≈1.7 years before failure diagnosis, with steady accumulation of mutations. These findings add urgency to the ongoing scale-up of viral load testing in resource-limited settings.
Individuals living with human immunodeficiency virus (HIV) infection require lifelong antiretroviral therapy (ART), which is increasingly initiated early in infection, regardless of CD4 count [1]. The gold standard for monitoring ART effectiveness is viral load testing; unfortunately, such testing is not yet widely available in resource-limited settings, where many clinics still monitor patients using the World Health Organization (WHO) clinical and immunologic criteria for treatment failure [1]. Patients who develop virologic treatment failure that goes undetected by clinical and immunologic monitoring may accumulate genotypic resistance mutations while continuing on a failing regimen [2–4]. In areas that rely heavily on standard WHO first- and second-line regimens, this accumulation of resistance mutations could compromise treatment outcomes, both for those who develop resistance and for anyone to whom resistant virus is transmitted [5–7]. Although several studies have reported the evolution of resistance in plasma [2–4], very few studies from resource-limited settings have evaluated genital shedding of resistant HIV-1 RNA among patients taking ART [8, 9].
We conducted a prospective cohort study of genital HIV-1 shedding among women who initiated first-line ART according to Kenyan guidelines and were monitored for treatment failure using WHO clinical and immunologic criteria. Our overall objectives were to (1) examine patterns of drug-resistance mutations in plasma and genital tract secretions of women who developed virologic failure on first-line ART and (2) determine the duration and evolution of genital shedding of drug-resistant HIV-1 before treatment failure diagnosis and switching to second-line therapy.
METHODS
Study Population
Participants were recruited from an ongoing cohort study at a municipal clinic in Mombasa, Kenya. Human immunodeficiency virus-1-seropositive women between the ages of 18 and 45 who reported sex in exchange for cash or goods have been recruited into the Mombasa Cohort since February 1993. Antiretroviral therapy has been available since March 2004. All HIV-seropositive women receive a basic package of comprehensive care, including risk reduction counseling, condom provision, and sexually transmitted infections (STIs) screening.
Kenyan national guidelines were used to determine ART eligibility, and standard first-line regimens recommended at the time (ie, stavudine or zidovudine, lamivudine, and nevirapine) were used [10]. At ART initiation and monthly thereafter, women were interviewed using standardized questionnaires about sexual behavior, contraceptive practices, and genitourinary symptoms. At each monthly visit, a study clinician performed a pelvic speculum examination, with collection of genital specimens for STI screening and cervical and vaginal swabs for HIV-1 RNA quantitation and resistance testing, in accordance with published procedures [11]. If women were menstruating, examinations were rescheduled. Blood was collected for CD4 lymphocyte count, HIV-1 RNA quantitation, and plasma resistance testing at baseline and quarterly thereafter. Adherence was monitored by monthly pill count and a validated visual analog scale [10, 11]. Women who were pregnant or had contraindications to standard ART were excluded.
Treatment failure was defined as meeting any WHO clinical or immunologic criterion after at least 6 months of ART: (1) onset or recurrence of an opportunistic infection or WHO stage III condition; (2) fall of >50% from peak on-treatment CD4 count or return to pretherapy CD4 baseline or below, with no concomitant infection to explain the decrease; or (3) CD4 counts persistently <100 cells/µL [12]. To confirm immunologic failure, CD4 counts were repeated after 1 month of adherence support, during which 1 of the 2 daily doses was directly observed. After publication of the 2010 WHO guidelines [13], targeted viral load testing was used to confirm suspected treatment failure (ie, plasma viral load >5000 copies/mL) in real time. In addition, viral load data from 2 completed research studies [8, 9] were used to evaluate treatment response.
Women diagnosed with treatment failure attended a screening visit at which blood was collected for baseline hemoglobin, alanine aminotransferase (ALT), creatinine, glucose, and cholesterol. Women were instructed to continue first-line therapy until their next visit, approximately 1 week later. At this visit, plasma and genital specimens were collected and women were switched to second-line therapy, provided no contraindication was present. Standard second-line therapy consisted of didanosine, abacavir, and ritonavir-boosted lopinavir [10].
Laboratory Testing
Rapid β-human chorionic gonadotropin tests were used to detect pregnancy (Plasmatec Laboratory Products, Bridport, United Kingdom). CD4 cell counts were determined using an automated method (FACSCount; Becton Dickinson, Forest Lakes, NJ) according to manufacturer's recommendations. Drug safety monitoring was performed using automated assays for hemoglobin, ALT, creatinine, glucose, and cholesterol (Refletron Plus; Roche Diagnostics, Mannheim, Germany).
Plasma and genital swab samples were stored at −70°C until shipment to Seattle on dry ice or in liquid nitrogen. The Gen-Probe HIV-1 viral load assay (Hologic Inc., San Diego, CA) was used to quantify HIV-1 RNA retrospectively in stored samples. This assay has been validated for quantification of the HIV-1 subtypes prevalent in Kenya, in both plasma and genital swab specimens [14]. The lower limit of detection for the volume tested was 100 copies/swab in genital secretions and 100 copies/mL in plasma. For all women diagnosed with treatment failure, we performed HIV-1 RNA quantitation on plasma and genital samples collected at the switch date. For women with detectable plasma HIV-1 RNA at the switch date, we tested HIV-1 RNA levels in stored plasma and genital samples from the initiation of first-line ART up until regimen switch.
Resistance testing was performed on all plasma and genital samples for which HIV-1 RNA was >500 copies/mL (ie, the lowest level at which we could amplify RNA). To detect genotypic resistance mutations, we performed population-based sequencing on HIV-1 RNA extracted from 140 µL of sample [15]. In brief, a 645-base pair region of HIV-1 pol was amplified in duplicate using nested reverse transcriptase-polymerase chain reaction on RNA normalized to 500 viral copies per reaction, and the resulting product was Sanger sequenced. Sequences were analyzed using Sequencher, version 4.5 (Gene Codes Corp., Ann Arbor, MI). To differentiate mixed peaks from background noise, a line was drawn such that 95% of secondary peaks were below the line. A site was defined as a “mixed peak” if the secondary peak was above background in at least 3 of 4 sequences. A consensus sequence was submitted to the Stanford University HIV Drug Resistance Database (http://hivdb.stanford.edu/) for interpretation of drug resistance. In replicate reactions of known mixtures of wild-type and mutant sequences, we have reliably detected mutant sequences present at ≥20% of total sequences with this method (data not shown). If viral RNA could not be amplified, we assumed that no resistance was present. If no resistance was detected in pre-ART plasma samples, we assumed there was also no resistance in pre-ART genital secretions, because all women with these baseline specimens (ie, those who initiated ART in our research clinic) were ART-naive. pol sequences were used to determine viral subtype.
Statistical Analysis
Baseline characteristics of women who failed or did not fail therapy were compared using Pearson's χ2 or Mann–Whitney U tests for categorical or continuous variables, respectively. Estimates of the prevalence of nonnucleoside reverse-transcriptase inhibitor (NNRTI), nucleoside/nucleotide reverse-transcriptase inhibitor (NRTI), and multiclass resistance in plasma or genital secretions were calculated with 95% confidence intervals (CIs) derived from exact Poisson distributions. For these calculations, genital resistance was counted as present if detected in either cervical or vaginal secretions. Spearman correlations were used to determine associations between the number of mutations in plasma and in genital secretions and with genital viral load, defined as the higher of cervical or vaginal viral load. A Mann-Whitney U test was used to test an association between the number of plasma mutations and amplification of genital HIV-1 RNA. A median estimate and 95% CI for time on first-line ART were derived directly from the survival curve for the 12 women with virologic failure at the switch date. This approach was also used to estimate the median time (with 95% CI) to first detection of plasma and genital tract resistance and the median duration (with 95% CI) of plasma and genital tract resistance before the switch date. These estimates of duration are conservative, because resistance likely emerged before it was first detected. All analyses were performed with Stata version 12.1 (StatCorp LP, College Station, TX).
Ethical Approvals
All participants gave written informed consent. Ethical review committees of the Kenya Medical Research Institute and University of Washington approved the study protocol, and procedures were also in accordance with the Helsinki Declaration of 1975, as revised in 2000.
RESULTS
Nineteen of 184 women who initiated ART between March 2004 and June 2011 were diagnosed with treatment failure, for an incidence of 3.0 per 100 person-years (95% CI, 1.9–4.7 per 100 person-years). Table 1 presents characteristics of (1) the cohort overall, (2) women who were not diagnosed with treatment failure, and (3) the 19 participants in this study. Women diagnosed with treatment failure were more likely to have a history of ART use before initiating treatment in the cohort. No other significant difference was identified. Details of the 19 treatment failure diagnoses are presented in Supplementary Digital Content 1. The majority of women (14 [73.7%]) were diagnosed using immunologic criteria alone. Overall, 12 of the 19 women diagnosed with treatment failure (63.2%) had confirmed virologic failure on the regimen switch date.
Cohort Characteristics at ART Initiation and During Follow-up
| Variable | Overall (N = 184) N (%) or Median (IQR) | No Failure Diagnosis (N = 165) N (%) or Median (IQR) | Failure Diagnosed (N = 19), N (%) or Median (IQR) | P Value for Comparison |
|---|---|---|---|---|
| Characteristics at ART Initiation | ||||
| Age (years) | 37 (33–41) | 37 (33–41) | 36 (30–43) | .806 |
| WHO stage | .750 | |||
| Stage I | 41 (22.3) | 38 (23.0) | 3 (15.8) | |
| Stage II | 58 (31.5) | 53 (32.1) | 5 (26.3) | |
| Stage III | 70 (38.0) | 61 (37.0) | 9 (47.4) | |
| Stage IV | 15 (8.2) | 13 (7.9) | 2 (10.5) | |
| CD4 count (cells/µL) | 138 (86–191) | 140 (87–195) | 108 (58–161) | .089 |
| Plasma viral loada (log10 copies/mL) | 5.51 (5.10–5.92) | 5.53 (5.09–5.92) | 5.29 (5.00–5.87) | .298 |
| Prior PMTCT | 0 | 0 | 0 | |
| Prior ARTb | 16 (8.7%) | 10 (6.1%) | 6 (31.6%) | <.001 |
| Regimen | .571 | |||
| D4T/3TC/NVP | 149 (81.0) | 132 (80.0) | 17 (89.5) | |
| ZDV/3TC/NVP | 24 (13.0) | 23 (13.9) | 1 (5.3) | |
| D4T/3TC/ABC or EFZ | 6 (3.3) | 5 (3.0) | 1 (5.3) | |
| TDF/3TC/NVP or EFZ | 5 (2.7) | 5 (3.0) | 0 | |
| Characteristics During Follow-up | ||||
| Follow-up time (years) | 3.50 (1.42–5.36) | 3.70 (1.48–5.56) | 2.69 (0.88–3.87) | .105 |
| Adherence by pill countc | 95.7 (91.9–97.8) | 95.8 (91.8–97.9) | 94.9 (92.1–97.5) | .857 |
| Adherence by VASd | 99.8 (99.0–100) | 99.8 (99.0–100) | 99.5 (96.1–99.9) | .088 |
| Treatment interruptione | 133 (72.3) | 121 (73.3) | 12 (63.2) | .348 |
Abbreviations: ABC, abacavir; ART, antiretroviral therapy; D4T, stavudine; EFZ, efavirenz; IQR, interquartile range; NVP, nevirapine; PMTCT, prevention of mother-to-child transmission; TDF, tenofovir; VAS, visual analog scale; WHO, World Health Organization; ZDV, zidovudine; 3TC, lamivudine.
a Plasma viral load results were unavailable for 56 participants (30.4%), 2 with treatment failure and 54 without.
b Adherence history was not available from outside clinics.
c Data on pill count were missing at 2.4% of visits.
d Data on visual analog scale assessments were missing at 4.4% of visits.
e Treatment interruption was defined as >48 hours without pills per pharmacy records. Data on treatment interruptions were missing at 2.1% of visits.
Table 2 presents results of genotypic resistance testing on switch date plasma and genital samples from the 12 women with confirmed virologic failure. Plasma viral loads at the switch date ranged from 5855 to 1 086 500 copies/mL. All 12 women had both NRTI and NNRTI resistance detected in plasma (100%; 95% CI, 73.5%–100%). Three women had minor resistance mutations to protease inhibitors (L10I or L10V). Genital viral loads ranged from undetectable to 348 copies/swab in genital samples that could not be amplified and from 673 copies/swab to 116 494 copies/swab in samples that could. Seven of the 12 women (58.3%; 95% CI, 27.7%–84.8%) had genital HIV-1 RNA levels high enough to amplify for resistance testing, and all 7 (100%; 95% CI, 59.0%–100%) had both NRTI and NNRTI resistance. None had resistance to protease inhibitors.
Genotypic Resistance Mutations in Plasma and Genital Secretions at the Switch to Second-Line Therapy
| QRS | Initial Regimen | Subtype | Viral Load (Copies/mL) | Class Resistance | Resistance to Specific Drug | Specific Mutations | ||||||||||||||
|---|---|---|---|---|---|---|---|---|---|---|---|---|---|---|---|---|---|---|---|---|
| PI | NRTI | NNRTI | 3TC | ZDV | D4T | TDF | NVP | EFZ | ETR | M184V | K65R | TAM | Other NRTI | K103N | Y181C | Other NNRTI | ||||
| QH685 | D4T/3TC/NVP | D | 22 196P | None | Yes | Yes | High | Low | Low | None | High | Int | Int | Yes | No | No | T215F | No | Yes | V108I, H221Y |
| 327Ca | ||||||||||||||||||||
| 2240V | None | Yes | Yes | High | Low | Low | None | High | Int | Int | Yes | No | No | T215F | No | Yes | V108I, H221Y | |||
| QH167 | ZDV/3TC/NVP | A | 639 034P | None | Yes | Yes | High | High | Int | Low | High | High | Low | Yes | No | D67N, K70R, K219Q | T215F | Yes | No | E138Q, V179IT |
| 33 123C | None | Yes | Yes | High | High | Int | Low | High | High | Low | Yes | No | D67N, K70R, K219Q | T215F | Yes | No | E138Q | |||
| 7005V | None | Yes | Yes | High | High | Int | Low | High | High | Low | Yes | No | D67N, K70R, K219Q | T215F | Yes | No | E138Q, V179IT | |||
| QH150 | D4T/3TC/NVP | A | 27 893P 237Ca 173Va | L10V | Yes | Yes | High | None | None | None | High | High | None | Yes | No | No | None | Yes | No | None |
| QG343 | D4T/3TC/NVP | D | 56 065P | L10V | Yes | Yes | High | None | None | None | High | High | None | Yes | No | D67N, K70R, K219Q | T69N | No | Yes | V106I |
| 713C 0Va | None | Yes | Yes | High | Int | Int | Potlow | High | Low | None | Yes | No | D67N, K70R, K219Q | T69N | No | Yes | None | |||
| QG322 | D4T/3TC/NVP | A | 38 071P | None | Yes | Yes | High | Int | Int | Potlow | High | Int | Int | Yes | No | M41L | T215F | No | Yes | A98G, V108I |
| 101 373C | None | Yes | Yes | High | Int | Int | Potlow | High | Int | Int | Yes | No | M41L | T215F | No | Yes | A98G, V108I | |||
| 116 494V | None | Yes | Yes | High | Int | Int | Potlow | High | Int | Int | Yes | No | M41L | T215F | No | Yes | A98G, V108I | |||
| QG047 | D4T/3TC/NVP | A | 1 086 500P | None | Yes | Yes | High | Int | Int | Potlow | High | High | Low | Yes | No | M41L | T215F | Yes | No | E138Q |
| 4185C | None | Yes | Yes | High | Int | Int | Low | High | High | Potlow | Yes | No | M41L | T215F | Yes | No | E138Q | |||
| 673V | None | Yes | Yes | High | High | High | Low | High | High | Potlow | Yes | No | M41L | T215F | Yes | No | None | |||
| QF669 | D4T/3TC/NVP | A | 13 280P 63Ca 337Va | None | Yes | Yes | High | Int | Low | None | High | High | None | Yes | No | D67N, K70R, K219Q | None | Yes | No | None |
| QC648 | D4T/3TC/NVP | A | 5855P 256Ca 0Va | None | Yes | Yes | High | Int | Int | None | High | High | Potlow | Yes | No | No | T215Y | Yes | No | None |
| QC511 | D4T/3TC/NVP | A | 11 439P 34Ca 86Va | L10I | Yes | Yes | High | None | None | None | High | High | None | Yes | No | No | A62V | Yes | No | V108IV, H221Y |
| QA779 | D4T/3TC/NVP | A | 60 561P 107Ca 121Va | None | Yes | Yes | High | Low | Low | None | High | Int | High | Yes | No | K70R, K219EK | None | No | No | Y181V |
| QA528 | TDF/3TC/EFZ | A | 90 916P | None | Yes | Yes | High | None | Int | Int | High | High | Int | Yes | Yes | K219EK | None | Yes | No | P225H, M230L |
| 986C | None | Yes | Yes | High | None | Low | Int | High | High | Potlow | Yes | Yes | No | None | Yes | No | P225H | |||
| 5435V | None | Yes | Yes | High | None | Int | Int | High | High | Porlow | Yes | Yes | K70KT, K219Q | None | Yes | No | P225H | |||
| QA268 | D4T/3TC/NVP | A | 21 098P | None | Yes | Yes | High | High | Int | Low | High | High | Low | Yes | No | D67N, K70R, K219Q | T215IT | No | No | Y188L |
| 348Ca | ||||||||||||||||||||
| 14 615V | None | Yes | Yes | High | Int | Low | None | High | High | Low | Yes | No | D67N, K70R, K219Q | None | No | No | Y188L | |||
Abbreviations: C, cervical; D4T, stavudine; EFZ, efavirenz; ETR, etravirine; GVL, genital viral load; Int, intermediate; NNRTI, nonnucleoside reverse-transcriptase inhibitor; NRTI, nucleoside/nucleotide reverse-transcriptase inhibitor; NVP, nevirapine; PI, protease inhibitor; Potlow, potential low; TAM, thymidine analog mutation; TDF, tenofovir; V, vaginal; ZDV, zidovudine; 3TC, lamivudine.
a Did not amplify.
Specific mutations in the genital tract closely mirrored those in the plasma, with a significant correlation between the number of mutations in plasma and in genital tract secretions (ρ = 0.849, P = .016). Minor discrepancies were present in the plasma versus genital samples of 5 of the 7 women for whom genital tract resistance testing was possible. Of note, a greater number of mutations in plasma was correlated with higher genital viral load (ρ = 0.735, P = .006). In addition, a greater number of mutations in plasma was associated with successful amplification of genital HIV-1 RNA (median 6.1 vs 3.8 mutations, P = .01). Figure 1 presents the percentage of women who had specific mutations detected in plasma and genital tract secretions at the switch to second-line therapy.
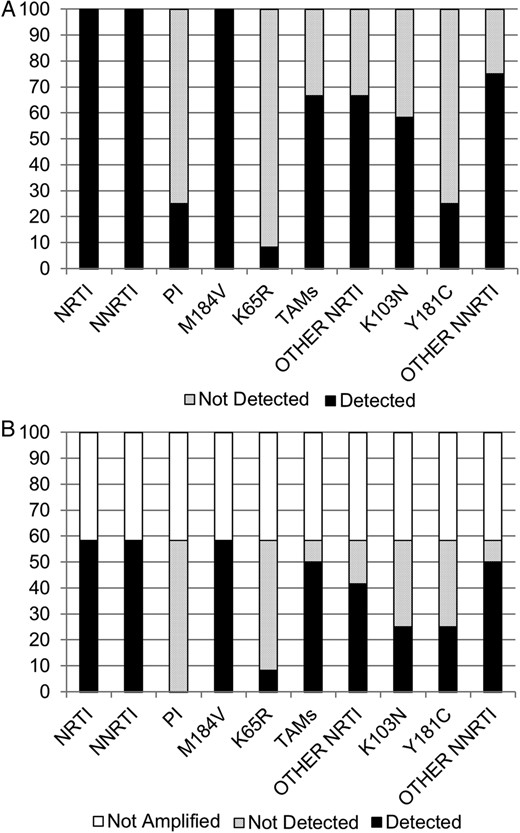
Percentage of women tested who had specific resistance mutations detected in (A) plasma and (B) genital tract secretions at the switch to second-line therapy. Each type of mutation is on the x-axis. The y-axis shows the percentage of samples in which this mutation was detected or not detected in each compartment, for all participating women (n = 12). In B, the percentage of samples that could not be amplified (5 of 12) is shown and included across the spectrum of mutations. Abbreviations: NNRTI, nonnucleoside reverse-transcriptase inhibitor; NRTI, nucleoside/nucleotide reverse-transcriptase inhibitor; PI, protease inhibitor; TAM, thymidine analog mutation.
Among the 12 women with virologic failure at the switch date, time on first-line ART ranged from 602 to 2380 days, with a median of 1403 days (95% CI, 881–1701 days). Time from ART initiation to detection of resistance in stored plasma samples ranged from 172 to 1353 days, with a median of 289 days (95% CI, 175–751 days). Time from ART initiation to detection of resistance in stored genital tract samples was slightly longer, ranging from 175 to 1423 days, with a median of 540 days (95% CI, 269–1248 days). Median time from first detection of resistance until the switch to second-line therapy was estimated at 895 days (95% CI, 130–1414 days) for plasma and 629 days (95% CI, 341–984 days) for genital tract secretions. Figure 2 presents the evolution of the number of genotypic resistance mutations detected in plasma and in genital secretions between ART initiation and switch to second-line therapy. In all cases, drug resistance mutations accumulated in both plasma and genital tract as the failing first-line therapy regimen was continued.
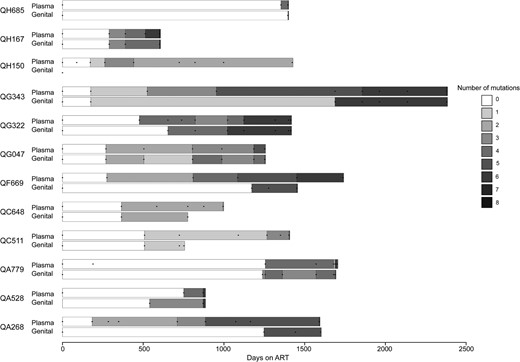
Accumulation of resistance mutations in plasma and genital tract of women ultimately diagnosed with virologic failure. Days since initiation of first-line antiretroviral therapy (ART) are on the x-axis, and data on resistance mutations in plasma and genital secretions for each individual woman are depicted on the y-axis. The number of genotypic resistance mutations identified is presented by the shading on the bars; once a mutation was detected, it was assumed to be present until the next sampled time point. Time points where assessments occurred are depicted by dots on each bar. Each bar begins at ART initiation and ends at the switch date, which occurred a median of 8.5 days (interquartile range, 7–12.5 days) after failure diagnosis.
DISCUSSION
In this cohort of women who initiated standard first-line ART and were monitored using clinical and immunologic criteria in accordance with Kenyan guidelines, the rate of diagnosed treatment failure was 3.0 per 100 person-years. Among women in whom virologic failure was confirmed, all had dual-class resistance to NNRTI and NRTI drugs in plasma and in genital secretions, with an accumulation of resistance mutations over time. The number of plasma resistance mutations correlated with the number of genital resistance mutations and the likelihood of having genital HIV-1 RNA levels high enough to amplify. Given that HIV transmission risk is increased when genital HIV-1 RNA levels are higher [16], our data suggest that the accumulation of resistance mutations in individuals with undetected virologic failure could lead to an increased risk for the transmission of resistant HIV-1 variants. Therefore, these data highlight the urgent need to (1) support the ongoing scale-up of access to plasma viral load testing, (2) avoid unnecessary regimen switches, and (3) preserve the efficacy of current WHO-recommended first-line therapy regimens.
Women participating in this study had a similar duration from first-line treatment initiation to failure as that reported in other studies in which patients were monitored using immunologic and clinical criteria [2, 17–19]. We found that use of these criteria without any virologic testing had a low positive predictive value for virologic failure: this was 40% in our study and was estimated at 49% in a recent systematic review [17]. It is now well established that these criteria lead to unnecessary regimen switching. In addition, we found similar plasma drug resistance mutations as others have reported when WHO clinical and immunologic criteria were used to diagnose treatment failure [2, 18, 19]. Studies that have monitored patients using periodic viral load testing have generally found lower rates of dual-class resistance. For example, in a multisite study that examined resistance mutations in all patients with HIV-1 RNA >1000 copies/mL at 12 months, dual-class resistance was detected in only 49% of patients [4]. Early detection of virologic failure would limit the accumulation of resistance mutations. Unfortunately, whereas the WHO has recommended viral load testing as the preferred monitoring approach since 2014 [20], such testing is still not widely available due to cost and limited feasibility in some settings.
The median duration of genital shedding of genotypically resistant HIV-1 variants was 629 days (≈1.7 years) before switching to second-line therapy. We previously reported that adherence was a strong and consistent predictor of genital HIV-1 suppression in the first 6 months of first-line ART [9]. In that study, genotypic resistance in genital secretions was associated with higher vaginal HIV-1 RNA levels at month 6 [9]. In a study extending follow-up of the same women to 12 months of first-line therapy, treatment interruption for >48 hours was associated with the risk of incident genital tract resistance [8]. We were unable to identify other published studies of drug resistance in female genital tract secretions or male seminal plasma from other settings where WHO treatment recommendations are used. As in a recent North American study of patients switching ART regimens, we found (1) that HIV-1 RNA detection was less frequent in genital secretions than in plasma and (2) that most participants with genital HIV-1 RNA that could be amplified had resistance in both the plasma and genital compartments [21].
The relationship between detection of drug-resistant HIV-1 in genital tract secretions and HIV-1 transmission risk is unclear. Evidence suggests increasing HIV-1 RNA levels in the genital tract secretions of both men and women are associated with higher transmission risk in serodiscordant couples [16]. One study reported that plasma HIV-1 RNA levels in ART-naive men were lower in men with transmitted drug resistance mutations than in those with no resistance mutations detected; however, this study provided no information on genital tract HIV-1 RNA levels in the transmitting partner [22]. Transmitted variants with drug resistance mutations, especially those with resistance to NNRTI drugs, have been shown to persist for long periods in both semen and female genital secretions [23, 24]. Although additional research is needed to quantify the transmission risk of HIV-1 variants with specific resistance mutations, it is clear that transmission of drug-resistant virus occurs and is gradually increasing in sub-Saharan Africa [25–28]. Because higher plasma HIV-1 RNA levels at failure diagnosis are associated with a greater degree of NNRTI and NRTI resistance [3], and greater numbers of plasma resistance mutations were associated with greater numbers of genital resistance mutations and higher genital viral load in this study, it seems likely that the accumulation of resistance mutations in individuals with undetected virologic failure will lead to an increased risk for the transmission of resistant HIV-1 variants at the population level.
To our knowledge, this is the first assessment of antiretroviral resistance in the genital tract among adults failing therapy with a WHO first-line regimen in a resource-limited setting. We prospectively observed women during first-line therapy, with serial monitoring of blood and genital tract secretions for HIV-1 RNA and resistance mutations. These data are unique and provide new insights into the potential for the transmission of drug-resistant HIV-1 variants in Africa and other resource-limited settings.
This study has several limitations, which must be weighed against the strengths detailed above. First, the order of appearance of mutations in the plasma versus genital tract compartments may have been confounded by the sampling protocol, which was quarterly for plasma and monthly for the genital tract. Despite this limitation, we identified plasma resistance prior to genital tract resistance, suggesting that resistance will usually be detected in plasma before it becomes detectable in genital tract secretions. Second, resistance mutations were detected by a population-based sequencing method that only detects viral variants that comprise at least 20% of the viral population. Although we are likely to have missed minority variants and archived mutations, these minority populations may be less frequently transmitted because they are present at low levels and may have decreased viral fitness. Finally, many women in this study were treated with stavudine, which is no longer widely used, and the vast majority were treated with nevirapine. Resistance patterns may differ with current regimens, which more often contain tenofovir and efavirenz, in accordance with current WHO recommendations [1].
CONCLUSIONS
In conclusion, we found that among women with confirmed virologic failure after diagnosis of treatment failure using clinical and immunologic criteria, all had genotypic resistance. Half of these women shed resistant HIV-1 RNA at detectable levels (up to 116 000 copies per swab) for a median of ≈1.7 years before failure diagnosis, with steady accumulation of resistance mutations to both NRTI and NNRTI medications. These findings add urgency to the ongoing scale-up of plasma viral load testing in resource-limited settings, which would limit prolonged treatment with a failing regimen. Such testing may help limit the transmission of drug-resistant virus, promote the success of second-line therapy, and, ultimately, deliver on the promise of treatment as prevention.
Acknowledgments
We thank the research staff for their contributions, Mombasa Municipal Council for clinical space, Coast Provincial General Hospital for laboratory space, and the Kenya Medical Research Institute Director for permission to publish. Special thanks go to our participants.
Disclaimer. The views expressed in this publication are those of the researchers and not necessarily of the mentioned sponsoring institutions.
Financial support. This work was supported by National Institutes of Health (NIH) grants AI-58698 and AI-069990. Logistical and infrastructure support for the Mombasa field site was provided by the University of Washington Center for AIDS Research (CFAR), an NIH-funded program under award number P30AI027757, which is supported by the following NIH institutes and centers (the National Institute of Allergy and Infectious Diseases, National Cancer Institute, National Institute of Mental Health, National Institute on Drug Abuse, National Institute of Child Health and Human Development, National Heart Lung and Blood Institute, National Institute on Aging, National Institute of General Medical Sciences, and National Institute of Diabetes and Digestive and Kidney Diseases).
Potential conflicts of interest. All authors: No reported conflicts. All authors have submitted the ICMJE Form for Disclosure of Potential Conflicts of Interest.
References


Comments