


 https://orcid.org/0000-0002-1024-9040

Abstract
Background
Forty percent of people with human immunodeficiency virus (HIV) (PWH) have metabolic dysfunction-associated steatotic liver disease (MASLD), but simple clinical tools for risk stratification do not exist. We evaluated whether adiposity indices are associated with MASLD in PWH and whether performance varies by race or ethnicity.
Method
We examined PWH from a prospective, cross-sectional study conducted by the NIDDK-funded HIV NASH CRN. Participants had suppressed HIV-1 RNA and underwent vibration controlled transient elastography and anthropometric measurements. The primary outcome was MASLD, defined as controlled attenuation parameter (CAP) ≥263 dB/m with ≥1 cardiometabolic risk factor without heavy alcohol use or viral hepatitis. Adiposity indices included waist circumference (WC), body mass index (BMI), waist-to-height ratio (WHtR), body roundness index (BRI), relative fat mass (RFM), visceral adiposity index, and waist-to-hip ratio.
Results
Among 990 PWH, 445 (44.9%) had MASLD. All adiposity indices were strongly associated with MASLD (P < .001). Several adiposity indices had good discrimination for MASLD in the overall cohort, including WC (area under the receiver operating curve 0.79, 95% CI .76–.81), WHtR (0.77 [.74–.80]), BRI (0.77 [.74–.80]), and BMI (0.75 [.72–.78]). WC, RFM, WHtR, and BRI had significant interactions with race (interaction P < .05). Adiposity indices overall performed better in Black and Hispanic PWH compared to White PWH.
Conclusions
In PWH, adiposity indices were strongly associated with MASLD, though their discriminatory ability varied by race and ethnicity. Simple anthropometric indices may provide practical tools for MASLD risk assessment that could be tailored by race and ethnicity.
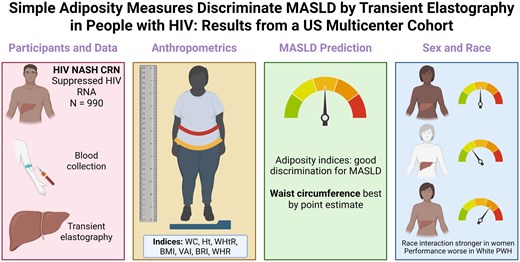
Adiposity indices discriminate MASLD with variation by sex and race. Created in BioRender. Wegermann (2026) https://BioRender.com/l3o12fd.
Metabolic dysfunction-associated steatotic liver disease (MASLD) is common in persons with human immunodeficiency virus (HIV) (PWH). We previously found that over half of PWH in a large multicenter cohort had steatotic liver disease (SLD) based on transient elastography (TE), and 39% of PWH had MASLD [1]. This is consistent with data from other large cohorts and a recent meta-analysis reporting that up to half of PWH have MASLD, suggesting the prevalence is higher than in the general population [2, 3]. The link between the 2 conditions is thought to be multifactorial due to systemic inflammation, gut dysbiosis, body composition changes (including a predisposition to visceral fat accumulation), and effects of antiretroviral therapy (ART) [4, 5]. There are prognostic implications; MASLD has been independently associated with frailty, cardiovascular events, and lower health-related quality of life in PWH [6–8]. MASLD is defined by the presence of SLD with at least 1 metabolic risk factor and no other known cause of liver disease [9]. The inflammatory subtype of MASLD, metabolic dysfunction-associated steatohepatitis, is associated with fibrosis and progression to cirrhosis and liver-related events [10].
Given the burden and consequences of MASLD in PWH, accurate risk stratification tools are urgently needed. Identification of PWH likely to have MASLD would enable targeted screening and monitoring. Although the Infectious Diseases Society of America (IDSA) recommends evaluation for MASLD in PWH with elevated liver enzymes, reliance on aminotransferase elevations alone may miss a substantial proportion of cases. In a secondary analysis of data from the Randomized Trial to Prevent Vascular Events in HIV (REPRIEVE), up to 40% of PWH with SLD had normal liver enzymes [11]. Similarly, in unpublished data from the multicenter HIV Nonalcoholic Steatohepatitis Clinical Research Network (HIV NASH CRN) cohort, 55% of PWH with MASLD had normal liver enzymes (≤30 U/L for men, ≤19 U/L for women), highlighting the limitations of enzyme-based screening strategies. Therefore, consideration of screening according to metabolic risk would be one strategy to identify at-risk PWH. Anthropometrics, or measurements of the human body, are appealing tools to identify PWH at risk for MASLD because they are quick, inexpensive, and require no specialized training or equipment. From basic anthropometrics such as height (Ht), weight, hip circumference (HC), and waist circumference (WC), noninvasive estimates of visceral adiposity can be calculated, some of which have been associated with MASLD. Examples include body mass index (BMI), waist-to-height ratio (WHtR) [12], body roundness index (BRI), relative fat mass (RFM), and visceral adiposity index (VAI) [13–15].
The ideal adiposity index for prediction of MASLD and other metabolic comorbidities in PWH is uncertain. Although BMI is commonly used given the standard clinical practice of measuring height and weight during clinic visits, BMI is limited in many populations by poor differentiation of adiposity from lean mass. Furthermore, many PWH have atypical distribution of adipose tissue, due to both virus-specific effects and antiretroviral therapy (ART) [16]. BMI underestimates adiposity in PWH, with previous studies demonstrating similar quantities of visceral adipose tissue in PWH despite lower BMI when compared to people without HIV [17]. Thus, BMI may fail to identify MASLD in PWH because altered fat distribution and ART contribute to insulin resistance and metabolic syndrome at lower BMI thresholds than in the general population [18].
Our previous work revealed that both BMI and WC were strongly associated with MASLD in PWH, but whether one or the other performs better in this population, or whether performance differs by sex, race, or age is not known [1, 19]. Adiposity indices do not perform uniformly across racial groups, raising uncertainty about applying a single measure to PWH of different races and ethnicities. Differences in visceral adipose tissue distribution by race are established in the literature [20].
The aim of this study was to evaluate whether adiposity indices are associated with MASLD in PWH and whether performance varies by sex, race, or ethnicity.
METHODS
Research Participants
We examined participants from the cross-sectional prevalence and predictors of hepatic steatosis in persons living with HIV study (NCT04795219). All participants had suppressed HIV-1 RNA at the time of study entry, and they were on ART for ≥6 months prior to enrollment. Participants were excluded if they had evidence of chronic hepatitis B or recent active hepatitis C virus (HCV) co-infection (allowable if ≥3 years from cure) or other liver diseases. Clinical and laboratory data collected included medical history, ART, and other medications for 90 days leading up to enrollment, prior stavudine (D4T) or zidovudine (AZT) exposure, vital signs, questionnaires (diet, alcohol use, physical activity, sleep quality, and food insecurity), and laboratory studies (complete blood count, chemistries, lipid panel, hemoglobin A1c, HIV-1 RNA, CD4+ and CD8+ T lymphocyte counts). High-density lipoprotein (HDL) was considered low if <50 mg/dL for women and <40 mg/dL for men. For the purposes of these analyses, sex was defined as sex assigned at birth and intersex participants were excluded. Participants underwent transient elastography after 3 h of fasting by certified technicians. The device recommendation was used to select either the M or XL probe. Sites were required to obtain 10 valid measurements with interquartile range (IQR)/median <30%.
Anthropometrics collected on study participants included height, weight, WC, and hip circumference (HC). From these measurements, the following adiposity indices were calculated: RFM, WHtR, BRI, VAI, and waist-to-hip ratio (WHR). Supplementary Table 1 shows the components and formula for each adiposity index. Participants missing any anthropometric measurement were excluded.
Participant Consent
All participants provided written informed consent for study participation. This study was approved by a single Institutional Review Board.
Outcomes
The primary outcome was MASLD, defined as controlled attenuation parameter (CAP) ≥263 dB/m in the presence of ≥1 cardiometabolic risk factor (by American Association for the Study of Liver Diseases criteria [9]: elevated BMI, WC, fasting glucose, hemoglobin A1c, diagnosis of type 2 diabetes or prescribed diabetic medication, elevated blood pressure or prescribed antihypertensives, elevated triglycerides or low high-density lipoprotein or prescribed lipid modifying agents) and without other chronic liver diseases, after exclusion of participants with alcohol-associated liver disease (ALD) and metabolic dysfunction and alcohol-associated liver disease (MetALD) based on Alcohol Use Disorders Identification Test (AUDIT) score ≥8. ALD and MetALD were excluded because our primary objective was to determine whether adiposity indices discriminate MASLD. As adiposity indices reflect metabolic risk, they were not intended to identify SLD associated with excess alcohol use. Secondary outcomes included MASLD with clinically significant fibrosis (MASLD-CSF), defined as MASLD in addition to liver stiffness measurement (LSM) ≥8 kPa. Further details on these definitions in this cohort have been previously published [1, 21].
Statistical Analysis
The study cohort was described by summary statistics. Continuous variables were described using mean ± standard deviation (SD) if normally distributed, or median (IQR) otherwise. Categorical variables were summarized by frequencies (relative frequencies in percentage). Characteristics of individuals with and without MASLD were compared by analysis of variance (ANOVA), Kruskal–Wallis tests, Chi-squared tests, or Fisher's exact tests as appropriate. Unadjusted logistic regression models were performed for the presence of MASLD with an interaction term to assess whether adiposity indices were modified by race (adiposity index * race). Unadjusted area under the receiver operating characteristic curve (AUROC) for discriminating MASLD vs not MASLD were then obtained, and diagnostic performance measures were evaluated for each adiposity measure, stratified by sex and race. Differences in AUROCs were assessed using the nonparametric DeLong method. Specificity, positive predictive value (PPV), negative predictive value (NPV), and cut points for each adiposity measure were calculated with sensitivity fixed at 90%. For the subgroups of female non-Hispanic White and Hispanic non-Black participants, estimates of specificity, PPV, NPV, and corresponding cut points were not reported due to small numbers. Statistical significance was defined as P-value <.05. Analyses were performed using SAS v9.4 and Stata Release 18.
RESULTS
Cohort Characteristics
After excluding 68 PWH missing at least 1 anthropometric measurement, 31 with ALD, 94 with MetALD, 2 with missing SLD diagnosis, and 1 PWH who self-identified as intersex, a total of 990 PWH were included in the analysis. Of these, 445 (44.9%) had MASLD (of whom 88 [19.8%] had MASLD-CSF) and 545 (55.0%) did not have SLD. Participant characteristics and adiposity measures by MASLD status appear in Table 1. Participants with MASLD were older (mean age 54.4 vs 52.8 years, P = .04) and were more likely to have type 2 diabetes (33% vs 16%, P < .001), hyperlipidemia (64% vs 50%, P < .001), and hypertension (79% vs 70%, P < .001). We also observed differences in race and ethnicity between participants with and without MASLD (overall P < .001). Participants with MASLD were less likely to identify as Black (44% vs 58%) and more likely to identify as Hispanic ethnicity (non-Black race) (24% vs 15%). We did not observe differences in duration of HIV or prior exposure to D4T or AZT between participants with and without MASLD. Of those with MASLD, only 48% had elevated alanine aminotransferase (ALT), defined as ≥30 U/L for males and ≥19 U/L for females.
Participant Characteristics and Adiposity Indices by MASLD Status
| No SLD (N = 545) | MASLD (N = 445) | Total (N = 990) | P | |
|---|---|---|---|---|
| Demographics, mean (SD) or N (%) | ||||
| Age, years | 52.8 (12.8) | 54.4 (11.1) | 53.5 (12.1) | .04 |
| Sex—male | 393 (72%) | 328 (74%) | 721 (73%) | .57 |
| Race/ethnicitya | <.001 | |||
| Non-Hispanic White | 136 (25%) | 130 (29%) | 266 (27%) | |
| Hispanic, non-Black | 81 (15%) | 109 (24%) | 190 (19%) | |
| Black | 314 (58%) | 195 (44%) | 509 (51%) | |
| Other | 13 (2%) | 11 (2%) | 24 (2%) | |
| Alcohol use, N (%) | <.001 | |||
| AUDIT score 0—none | 250 (46%) | 261 (59%) | 511 (52%) | |
| AUDIT score 1–7—low risk | 249 (46%) | 184 (41%) | 433 (44%) | |
| AUDIT score 8–14—hazardous | 32 (6%) | 0 (0%) | 32 (3%) | |
| AUDIT score ≥15—dependent | 13 (2%) | 0 (0%) | 13 (1%) | |
| Cardiometabolic criteria, N (%) | ||||
| BMI≥25 kg/m2 (23 Asian) or WC > 94 cm (80 cm F) | 399 (73%) | 426 (96%) | 825 (83%) | <.001 |
| Type 2 diabetes | 86 (16%) | 145 (33%) | 231 (23%) | <.001 |
| Prediabetes | 56 (10%) | 87 (20%) | 143 (14%) | <.001 |
| Elevated fasting glucose or elevated HbA1c or diagnosis of T2DM or treatment for T2DM | 266 (49%) | 316 (71%) | 582 (59%) | <.001 |
| Elevated triglycerides (≥150 mg/dL) or on lipid lowering treatment | 125 (23%) | 202 (45%) | 327 (33%) | <.001 |
| Low HDL (≤40 mg/dL M, ≤50 mg/dL F) or on lipid lowering treatment | 321 (59%) | 339 (76%) | 660 (67%) | <.001 |
| Hypertension | 380 (70%) | 350 (79%) | 730 (74%) | .001 |
| Laboratory values and scores | ||||
| AST (U/L)—median (IQR) | 22.0 (17.0, 28.0) | 24.0 (18.0, 30.0) | 23.0 (18.0, 29.0) | .001 |
| ALT (U/L)—median (IQR) | 19.0 (14.0, 26.0) | 26.0 (18.0, 38.0) | 22.0 (15.0, 32.0) | <.001 |
| Elevated ALT (≥30 U/L for males, ≥19 U/L for females) | 145 (27%) | 212 (48%) | 357 (36%) | <.001 |
| FIB-4 score—median (IQR) | 1.14 (0.76, 1.61) | 1.05 (0.75, 1.48) | 1.10 (0.76, 1.57) | .14 |
| VCTE measurements | ||||
| CAP score, dB/m | 213.4 (35.1) | 313.7 (37.8) | 258.7 (61.8) | <.001 |
| LSM, kPa—median (IQR) | 4.8 (3.9, 6.0) | 5.6 (4.4, 7.3) | 5.1 (4.1, 6.6) | <.001 |
| LSM≥8 kPa (clinically significant fibrosis) | 52 (10%) | 88 (20%) | 140 (14%) | <.001 |
| HIV related features | ||||
| CD4+ cell count (cells/mm3), median (IQR) | 671 (506, 907) | 688 (535, 911) | 675 (517, 911) | .51 |
| History of AIDS | 187 (34%) | 193 (43%) | 380 (38%) | .004 |
| Duration of HIV (years) | 19.7 (10.7) | 19.8 (10.0) | 19.8 (10.4) | .80 |
| Ever taken D4T or AZT (N = 867; unknown N = 123) | 95 (20%) | 79 (20%) | 174 (20%) | .96 |
| Current/recent ART, N (%) | ||||
| NRTI | 471 (86%) | 398 (89%) | 869 (88%) | .15 |
| NNRTI | 109 (20%) | 86 (19%) | 195 (20%) | .79 |
| INSTI | 468 (86%) | 382 (86%) | 850 (86%) | .99 |
| PI/r | 65 (12%) | 61 (14%) | 126 (13%) | .40 |
| Pharm-enhancer (cobicistat) | 87 (16%) | 77 (17%) | 164 (17%) | .57 |
| Adiposity indices, median (IQR) | ||||
| Body mass index (BMI), kg/m2 | 26.9 (23.6, 30.3) | 31.9 (28.2, 36.6) | 29.0 (25.5, 33.5) | <.001 |
| Relative fat mass (RFM) | 27.9 (24.0, 35.4) | 32.4 (28.9, 40.1) | 30.3 (26.0, 37.7) | <.001 |
| Waist to height ratio (WHtR) | 0.5 (0.5, 0.6) | 0.6 (0.6, 0.7) | 0.6 (0.5, 0.6) | <.001 |
| Body roundness index (BRI) | 4.0 (3.3, 5.3) | 5.7 (4.7, 7.5) | 4.8 (3.6, 6.3) | <.001 |
| Visceral adiposity index (VAI) | 1.2 (0.8, 2.0) | 2.0 (1.3, 3.2) | 1.6 (0.9, 2.6) | <.001 |
| Waist-to-hip ratio (WHR) | 0.94 (0.89, 0.98) | 0.97 (0.94, 1.04) | 0.96 (0.91, 1.01) | <.001 |
| Waist circumference (WC) (cm) | 92.2 (85.0, 101.0) | 105.7 (97.0, 117.7) | 98.0 (90.0, 109.0) | <.001 |
Abbreviations: ALT, alanine aminotransferase; ART, antiretroviral treatment; AST, aspartate aminotransferase; AUDIT, Alcohol Use Disorders Identification Test; AZT, zidovudine; CAP, controlled attenuation parameter; d4T, stavudine; FIB-4, Fibrosis-4; HDL, high-density lipoprotein; INSTI, integrase strand transfer inhibitor; IQR, interquartile range; LSM, liver stiffness measurement; NNRTI, non-nucleoside reverse transcriptase inhibitor; NRTI, nucleoside reverse transcriptase inhibitor; PI, protease inhibitor; RFM, relative fat mass; SLD, steatotic liver disease; T2DM, type 2 diabetes mellitus; VAI, visceral adiposity index; WC, waist circumference; WHR, waist to hip ratio.
aMissing for one participant without SLD.
Adiposity Indices, MASLD, and MASLD + CSF
Each adiposity index was strongly associated with MASLD with P < .001 (Table 1). There were significant differences in AUROC across anthropometric measures (overall P < .001, Supplementary Figure 1). WC had the highest AUROC by point estimate (AUROC 0.79 [95% CI .76–.81]), although confidence intervals overlapped with WHtR (0.77 [.74–.80]), BRI (0.77 [.74–.80]), and BMI (0.75 [.72–.78]). Indices with lower discrimination included VAI (0.69 [.66–.72]), RFM (0.68 [.65–.71]), and WHR (0.68 [.64–.70]). When comparing PWH with MASLD to those with MASLD-CSF, we observed significant differences in each adiposity index (Supplementary Table 2); however, the analyses for MASLD-CSF should be interpreted with caution given sample size limitations (N = 88).
Adiposity Indices by Sex, Race, and Ethnicity
We evaluated the performance of adiposity indices across sex, race, and ethnicity subgroups to explore potential differences in discrimination. These analyses were limited by small sample sizes in some subgroups, particularly among female non-Hispanic White and Hispanic participants. Overall, 65.7% of PWH with BMI ≥30 kg/m2 had MASLD, including 78.2% of those with BMI ≥30 kg/m2 who also reported Hispanic ethnicity. For WC, 62% of male PWH with WC >94 cm had MASLD, while only 46.3% of female PWH with WC >80 cm had MASLD. Logistic regression models including an interaction term revealed that several adiposity indices were modified by race (interaction P-value <.05), including RFM (P = .04), WHtR (P = .005), BRI (P = .004), and WC (P = .005) (Table 2). The distribution of adiposity indices by MASLD status, sex, and race is shown in Figure 1 (for WC) and Supplementary Figure 2 (for the remaining adiposity indices). For some adiposity indices, including WC, RFM, WHtR, and BRI, the interaction with race and ethnicity was significant in women but not men (Figure 1 and Supplementary Figure 2). We observed some differences in MASLD discrimination by race and ethnicity in these exploratory analyses (Supplementary Figure 1). In Black and White PWH, WC demonstrated the highest point estimates for discrimination of MASLD (White AUROC = 0.74 [.68–.80]; Black AUROC = 0.81 [.77–.85]); however, confidence intervals overlapped with WHtR, BRI, BMI, and VAI in White PWH and with WHtR, BRI, and BMI in Black PWH. In Hispanic PWH, WC, WHtR, and BRI demonstrated similar discrimination for MASLD (all AUROC 0.81 [.75–.87]), while BMI (0.77 [.71–.84]) and RFM (0.76 [.70–.83]) showed slightly lower but overlapping performance (Supplementary Figure 1).
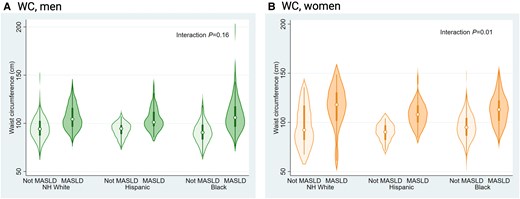
Distribution of waist circumference by sex, race/ethnicity, and MASLD status. Violin plots show the distribution of waist circumference among participants with and without MASLD, stratified by race/ethnicity, among (A) men and (B) women. Interaction P values represent the waist circumference × race/ethnicity interaction within each sex stratum.
Adiposity Indices by MASLD Status and Race
| White, Non-Hispanic | Hispanic, Non-Black | Black | Interaction P | ||||
|---|---|---|---|---|---|---|---|
| No MASLD (N = 136) | MASLD (N = 130) | No MASLD (N = 81) | MASLD (N = 109) | No MASLD (N = 314) | MASLD (N = 195) | ||
| Adiposity indices, median (IQR) | |||||||
| BMI, kg/m2 | 26.1 (23.1, 29.1) | 29.8 (26.7, 33.5) | 27.3 (24.8, 29.6) | 31.3 (28.4, 35.2) | 27.3 (23.7, 30.8) | 34.1 (29.6, 39.2) | .06 |
| Relative fat mass (RFM) | 26.6 (24.0, 31.5) | 30.8 (27.2, 34.2) | 27.8 (25.0, 30.4) | 32.3 (29.4, 38.0) | 28.7 (23.9, 39.6) | 34.8 (29.5, 45.0) | .04 |
| Waist to height ratio (WHtR) | 0.5 (0.5, 0.6) | 0.6 (0.5, 0.7) | 0.5 (0.5, 0.6) | 0.6 (0.6, 0.7) | 0.5 (0.5, 0.6) | 0.6 (0.6, 0.7) | .005 |
| Body roundness index (BRI) | 3.9 (3.3, 5.3) | 5.3 (4.2, 6.7) | 4.3 (3.6, 5.1) | 5.6 (4.9, 7.1) | 4.1 (3.2, 5.4) | 6.1 (4.7, 8.2) | .004 |
| Visceral adiposity index (VAI) | 1.5 (0.9, 2.3) | 2.5 (1.5, 3.4) | 1.7 (1.1, 2.8) | 2.3 (1.7, 3.3) | 1.1 (0.7, 1.7) | 1.5 (1.1, 2.7) | .32 |
| Waist-to-hip ratio (WHR) | 0.97 (0.92, 1.03) | 0.99 (0.95, 1.05) | 0.94 (0.90, 0.98) | 0.97 (0.94, 1.01) | 0.92 (0.87, 0.96) | 0.96 (0.92, 1.04) | .21 |
| Waist circumference (WC) (cm) | 94.1 (86.4, 102.6) | 105.0 (96.5, 118.1) | 93.7 (88.8, 98.0) | 102.9 (97.4, 114.5) | 91.4 (84.5, 101.0) | 108.8 (98.0, 120.1) | .005 |
Participants categorized as other race/ethnicity or with missing race/ethnicity were excluded from race/ethnicity-stratified analyses.
The performance characteristics of selected adiposity indices (those with best overall discrimination for MASLD) by sex, race, and ethnicity when sensitivity was set at 90% is shown in Table 3. Cutoff values were not estimated for female non-Hispanic White and Hispanic participants because of the small number of participants in these subgroups, which limited statistical power. Although the above exploratory analyses suggested potential differences in optimal thresholds across race and ethnicity, confidence intervals overlapped and several subgroups were small. These findings should therefore be considered hypothesis-generating and require validation in larger, diverse cohorts before race- or ethnicity-specific thresholds can be recommended. We also examined the incremental improvement in MASLD discrimination with addition of these adiposity indices to ALT, and we found that adiposity indices improved discrimination (Supplementary Table 3).
Performance Characteristics of Selected Adiposity Indices for Discriminating MASLD at 90% Sensitivity
| Adiposity Index | No. With MASLD/Total N (%) | AUROC (95% CI) | Specificity (95% CI) | PPV (95% CI) | NPV (95% CI) | Cutoff for Predicting MASLD (95% CI) |
|---|---|---|---|---|---|---|
| Body mass index (BMI) | ||||||
| Men | ||||||
| Non-Hispanic White | 113/228 (50%) | 0.73 (0.66, 0.79) | 0.39 (0.30, 0.49) | 0.59 (0.52, 0.67) | 0.80 (0.68, 0.90) | ≥24.5 (23.5, 25.5) |
| Hispanic, non-Black | 84/155 (54%) | 0.76 (0.69, 0.84) | 0.38 (0.27, 0.50) | 0.63 (0.54, 0.72) | 0.77 (0.58, 0.88) | ≥26.3 (24.2, 27.7) |
| Black | 120/316 (38%) | 0.80 (0.76, 0.85) | 0.53 (0.46, 0.60) | 0.54 (0.46, 0.60) | 0.90 (0.82, 0.94) | ≥26.9 (25.5, 28.1) |
| Women | ||||||
| Non-Hispanic White | 17/38 (45%) | 0.75 (0.58, 0.92) | a | a | a | a |
| Hispanic, non-Black | 25/35 (71%) | 0.77 (0.60, 0.93) | a | a | a | a |
| Black | 75/193 (39%) | 0.78 (0.71, 0.85) | 0.36 (0.29, 0.47) | 0.47 (0.39, 0.56) | 0.86 (0.72, 0.93) | ≥27.4 (24.8, 29.6) |
| Waist circumference (WC) | ||||||
| Men | ||||||
| Non-Hispanic White | 113/228 (50%) | 0.75 (0.69, 0.81) | 0.37 (0.29, 0.47) | 0.59 (0.51, 0.66) | 0.81 (0.68, 0.91) | ≥91.4 (88.2, 94.6) |
| Hispanic, non-Black | 84/155 (54%) | 0.78 (0.71, 0.85) | 0.38 (0.27, 0.50) | 0.63 (0.54, 0.72) | 0.77 (0.60, 0.90) | ≥91.0 (87.1, 94.5) |
| Black | 120/316 (38%) | 0.83 (0.78, 0.87) | 0.52 (0.45, 0.59) | 0.54 (0.47, 0.61) | 0.90 (0.83, 0.95) | ≥91.4 (88.5, 94.4) |
| Women | ||||||
| Non-Hispanic White | 17/38 (45%) | 0.69 (0.51, 0.88) | a | a | a | a |
| Hispanic, non-Black | 25/35 (71%) | 0.90 (0.79, 1.00) | a | a | a | a |
| Black | 75/193 (39%) | 0.80 (0.74, 0.87) | 0.47 (0.38, 0.57) | 0.52 (0.43, 0.61) | 0.89 (0.77, 0.94) | ≥94.0 (89.8, 97.4) |
| Waist to height ratio (WHtR) | ||||||
| Men | ||||||
| Non-Hispanic White | 113/228 (50%) | 0.75 (0.69, 0.82) | 0.41 (0.31, 0.50) | 0.60 (0.52, 0.68) | 0.81 (0.71, 0.92) | ≥0.51 (0.50, 0.52) |
| Hispanic, non-Black | 84/155 (54%) | 0.79 (0.72, 0.86) | 0.45 (0.33, 0.57) | 0.66 (0.56, 0.74) | 0.80 (0.62, 0.89) | ≥0.54 (0.52, 0.55) |
| Black | 120/316 (38%) | 0.82 (0.77, 0.86) | 0.54 (0.47, 0.61) | 0.55 (0.47, 0.62) | 0.90 (0.83, 0.95) | ≥0.51 (0.49, 0.53) |
| Women | ||||||
| Non-Hispanic White | 17/38 (45%) | 0.67 (0.49, 0.86) | a | a | a | a |
| Hispanic, non-Black | 25/35 (71%) | 0.86 (0.72, 0.99) | a | a | a | a |
| Black | 75/193 (39%) | 0.79 (0.73, 0.86) | 0.48 (0.39, 0.58) | 0.53 (0.43, 0.61) | 0.89 (0.77, 0.95) | ≥0.58 (0.55, 0.60) |
| Body roundness index (BRI) | ||||||
| Men | ||||||
| Non-Hispanic White | 113/228 (50%) | 0.75 (0.69, 0.82) | 0.41 (0.32, 0.50) | 0.60 (0.52, 0.67) | 0.81 (0.69, 0.90) | ≥3.61 (3.39, 3.81) |
| Hispanic, non-Black | 84/155 (54%) | 0.79 (0.72, 0.86) | 0.45 (0.33, 0.57) | 0.66 (0.56, 0.74) | 0.80 (0.62, 0.89) | ≥4.12 (3.74, 4.41) |
| Black | 120/316 (38%) | 0.82 (0.77, 0.86) | 0.54 (0.48, 0.62) | 0.55 (0.48, 0.62) | 0.90 (0.82, 0.94) | ≥3.63 (3.17, 3.95) |
| Women | ||||||
| Non-Hispanic White | 17/38 (45%) | 0.67 (0.49, 0.86) | a | a | a | a |
| Hispanic, non-Black | 25/35 (71%) | 0.86 (0.72, 0.99) | a | a | a | a |
| Black | 75/193 (39%) | 0.79 (0.73, 0.86) | 0.48 (0.39, 0.58) | 0.53 (0.44, 0.62) | 0.89 (0.79, 0.96) | ≥4.97 (4.26, 5.46) |
Abbreviations: AUROC, area under the receiver operating characteristic curve.
aAnalysis not performed due to small number of female non-Hispanic white and Hispanic participants, limiting statistical power.
DISCUSSION
In a large, US-based, cross-sectional cohort of PWH, we found that multiple adiposity indices using simple anthropometric measurements had moderate discrimination for MASLD. WC demonstrated the highest discrimination by point estimates, although performance was comparable across several indices. Exploratory analyses suggested differences by race, ethnicity, and sex that should be explored in future studies. When sensitivity was set at 90%, WHtR and BRI had the highest PPV for MASLD. Although PPV was modest across all adiposity indices, values around 0.60 as seen in this analysis may still be clinically useful in a screening context. However, PPV is dependent on disease prevalence, and the relatively high prevalence of MASLD among PWH in this cohort may limit the generalizability of these estimates to populations with lower MASLD prevalence.
Our findings suggest that readily obtainable anthropometric measures may be useful for MASLD risk stratification in PWH. Simple measurements such as WC, BMI, and WHtR performed similarly, if not better, than more complex indices such as BRI or VAI. WC may offer a pragmatic option given its consistent performance and clinical accessibility. Our findings are consistent with prior studies demonstrating that adiposity indices perform at least as well as, and in some cases better than, BMI for identifying MASLD. In a study of 161 adults in Mexico undergoing transient elastography, WC showed slightly higher discrimination than BMI (AUROC 0.78 vs 0.76) [14]. In a larger analysis of >5000 participants from the National Health and Nutrition Examination Survey (NHANES), VAI demonstrated moderate discrimination for MASLD (AUROC 0.74) [13]. Collectively, these findings support the relevance of adiposity indices for MASLD risk stratification.
The results of this study potentially have implications for screening of PWH for MASLD. Given the limited sensitivity of liver enzyme-based screening, incorporation of anthropometric measures may improve identification of at-risk PWH. In contrast to IDSA guidelines, the European AIDS Clinical Society guidelines version 13.0 recommends screening PWH with type 2 diabetes/prediabetes, obesity/overweight, elevated ALT, prior exposure to d-drugs, or any metabolic syndrome feature for MASLD [22]. However, neither anthropometric measurements nor adiposity indices are included in the list of risk factors, leaving BMI as the recommended way to ascertain risk. Including sex- and race-specific cutoffs for the most accurate indices, such as WC and WHtR, could improve the early detection of MASLD in this high-prevalence population. The major drawback to WC as the primary way to identify PWH for further evaluation for MASLD is the potential to miss PWH with normal WC who have MASLD (“lean MASLD”), which is more common in PWH compared to PWoH [23]. Utilizing a combination of metabolic risk factors is therefore a potential approach to MASLD screening in PWH.
We noted variation in the performance of adiposity indices by race and ethnicity, but analyses were limited by small sample size in some subgroups. Although point estimates varied, overlapping confidence intervals suggest broadly similar performance across race and ethnicity groups. This is also consistent with prior literature, but this knowledge has not yet been widely translated into clinical practice. For example, a study of >10 000 participants from the Women's Health Initiative found that Black women had the highest levels of subcutaneous adipose tissue, while Hispanic women had the highest levels of visceral adipose tissue. Furthermore, visceral adipose tissue increased over time in women <60 years old, whereas it decreased in women ≥70 years of age [24]. These differences have important implications for MASLD risk, which varies by race and ethnicity for multiple reasons including genetics, diet, and socioeconomic status [24–27]. Because BMI does not account for body composition differences, measures like WC or WHtR may be more broadly applicable on a population level. In our analysis, optimal cutoff values differed by sex, race, and ethnicity, suggesting that a screening strategy for PWH should incorporate these factors.
The strengths of this study include examination of participants from a multicenter, cross-sectional cohort with robust phenotyping for MASLD through vibration controlled transient elastography (VCTE) as well as systematic measurement of anthropometrics in almost all participants, with only ≈6% of participants excluded for missing measurements. Limitations of this study include a small sample size with MASLD-CSF, limiting our ability to test adiposity indices in this population specifically, as well as small subgroups including White and Hispanic female PWH, which limited our ability to fully test interactions with sex, race, and ethnicity. Specifically, we had to consider Hispanic as a single group rather than subgrouping by race due to numbers. In addition, BMI and WC are among the cardiometabolic risk factors used to define MASLD and are themselves adiposity measures or components of several adiposity indices evaluated in this study. Thus, there is inherent circularity in assessing the cross-sectional ability of these indices to discriminate an outcome that is defined, in part, by adiposity. This limitation is inherent to the current definition of MASLD and should be considered when interpreting the observed discriminatory performance. Furthermore, CAP score increases with visceral adiposity, complicating assessing the link between measures of abdominal obesity and CAP score. CAP cutoffs are not universally agreed upon; the cutoff of 263 dB/m was chosen in the parent study to maximize specificity in a research setting. Therefore, applicability to a primary care screening setting may be an issue. The cross-sectional design means we cannot determine whether adiposity indices could be measured in clinic prior to the onset of MASLD, which would be ideal for population-level screening. We did not have full ART history (our data capture medications within 90 days of enrollment as well as any prior D4T or AZT exposure), meaning we were unable to fully explore the effects of long-term ART exposure on MASLD. The lack of a control group of people without HIV also precludes ascertainment of HIV-specific effects.
Future directions for this work could include combining adiposity indices with labs, genetic data, or biomarkers to strengthen predictive models, using longitudinal cohorts to determine whether adiposity indices predict incident MASLD or fibrosis progression, and implementation of adiposity indices in screening recommendations for PWH.
In summary, we found that adiposity indices performed well in discriminating MASLD in a large, well-phenotyped, cross-sectional cohort of PWH. Our results suggest that anthropometric measures could be effective screening tools for MASLD in PWH but thresholds for pursuing additional diagnostic testing may need to be individualized by sex and race.
Supplementary Data
Supplementary materials are available at Open Forum Infectious Diseases online. Consisting of data provided by the authors to benefit the reader, the posted materials are not copyedited and are the sole responsibility of the authors, so questions or comments should be addressed to the corresponding author.
Notes
Author contributions. K. W.: study conceptualization, manuscript drafting. L. A. W.: data provision and curation, statistical analysis. E. V. G.: statistical analysis. H. C.: data provision and curation. J. C. P.: manuscript revision. R. K. S.: manuscript revision. S. H.: manuscript revision. M. S.: manuscript revision. R. L.: manuscript revision. S. N.: manuscript revision. N. C.: study conceptualization, supervision, manuscript revision. J. E. L.: study conceptualization, supervision, manuscript revision
Data availability. The data underlying this article are not publicly available because they contain information that could compromise participant privacy. Requests regarding access to the data should be directed to the corresponding author and will be considered on a case-by-case basis.
Financial support. Research reported in this publication was supported by the National Institute of Diabetes and Digestive and Kidney Diseases under Award Numbers R01 DK121378-01 and U24 DK132715. The content is solely the responsibility of the authors and does not necessarily represent the official views of the National Institutes of Health. The work was also supported by the American College of Gastroenterology Junior Faculty Development Award to KW.
References
Author notes
Potential conflicts of interest. The authors do not have any conflicts of interest to disclose. For full disclosure, Dr. Chalasani reports consulting agreements with Madrigal, Zydus, GSK, Altimmune, Eccogene, Akero, Chugai, and Insitro. He has research grants from Boehringer-Ingelheim, Zydus, and Madrigal. He has equity in Avant Sante, a contract research organization and Heligenics, a drug discovery start-up company.


Comments