


Abstract
Uncertainty exists regarding the effectiveness of COVID-19 vaccine to prevent postacute sequelae of COVID-19 (PASC) following a breakthrough infection. While most studies based on symptom surveys found an association between preinfection vaccination status and PASC symptoms, studies of medically attended PASC are less common and have reported conflicting findings.
In this retrospective cohort of patients with an initial SARS-CoV-2 infection who were continually empaneled for primary care in a large US health system, the electronic health record was queried for preinfection vaccination status, demographics, comorbidity index, and diagnosed conditions. Multivariable logistic regression was used to model the outcome of a medically attended PASC diagnosis within 6 months of SARS-CoV-2 infection. Likelihood ratio tests were used to assess the interaction between vaccination status and prevalent variant at the time of infection and between vaccination status and hospitalization for SARS-CoV-2 infection.
During the observation period, 6.9% of patients experienced medically attended and diagnosed PASC. A diagnosis of PASC was associated with older age, female sex, hospitalization for the initial infection, and an increased severity-weighted comorbidity index and was inversely associated with infection during the Omicron period. No difference in the development of diagnosed PASC was observed between unvaccinated patients and those vaccinated with either 2 doses of an mRNA vaccine or >2 doses.
We found no association between vaccination status at the time of infection and development of medically diagnosed PASC. Vaccine remains an important measure to prevent SARS-CoV-2 infection and severity. Further research is needed to identify effective measures to prevent and treat PASC.
Postacute sequelae of SARS-CoV-2 infection, also known as long-haul COVID or long COVID-19, consists of symptoms that persist at least 3 months after the initial infection, although definitions have evolved over time [1–3]. The pathophysiologic basis of postacute sequelae of COVID-19 (PASC) has not yet been fully delineated [4]. While the severity of the initial infection is associated with the likelihood of developing PASC, PASC may occur in individuals with mild to moderate disease [5]. Therefore, on the population level, most PASC cases are caused by mild to moderate infections. Symptoms are numerous and highly variable and can cause significant functional impairment.
COVID-19 vaccine is known to be highly effective for prevention of symptomatic infection for several months, with continued long-term protection against severe infection, hospitalization, and death [6]. This protection against the most severe infections seems robust even as new circulating variants have emerged [7]; yet, less protection is offered against mild-moderate disease, and breakthrough infections are common, particularly as immunity wanes and/or new variants emerge that escape vaccine-mediated immunity [8]. Previous studies have attempted to elucidate whether vaccination protects against the development of PASC following a breakthrough infection, with several systematic reviews finding an association between preinfection vaccination and reduced likelihood of developing PASC [9–11]. However, most such studies have used symptom surveys to identify PASC, which are subject to recall bias. Others have attempted to mine the electronic health record (EHR) for report of possible PASC symptoms [12–15]. Still, these studies are limited because PASC symptoms such as fatigue are common and nonspecific. Furthermore, the mention of a symptom in a clinical visit or clinical communication does not mean that the symptom prompted the patient to seek medical evaluation. Thus, little is known about the rate of developing PASC, much less whether medically attended PASC is mitigated for vaccinated patients with breakthrough infection. Clinical diagnosis codes have shown a high positive predictive value for meeting diagnostic criteria for PASC [16, 17].
The purpose of this study was to assess the association between COVID-19 mRNA vaccination and development of medically attended and diagnosed PASC following a confirmed SARS-CoV-2 infection, with data extracted from the EHR.
METHODS
This retrospective cohort study was conducted in a large health care system in the Midwestern United States. Patients were eligible for inclusion upon meeting the following criteria: (1) age ≥5 years as of 1 February 2021; (2) an initial positive SARS-CoV-2 polymerase chain reaction (PCR) test result between 1 February 2021, when vaccine became available for senior and high-risk patients and most health care workers, and 31 December 2022, when home antigen testing was felt to have surpassed PCR in the diagnosis of new cases in the health system; and (3) empanelment with a primary care provider within the health care system. The outcome was a clinical encounter with diagnostic codes commonly used within the institution for PASC (B94.8, U09.9, Z86.16, B97.29) or a visit to the organization's designated PASC clinic between 30 days and 6 months after the infection. Initially, providers were instructed to utilize code B94.8 for suspected PASC cases. When U09.9 became available, a system-wide provider communication recommended use of this code. A review of codes used in patients referred to the designated PASC clinic identified that Z86.16 and B97.29 were also in common use. Patients were excluded if they had a previous SARS-CoV infection, died, or changed their primary care provider to another health care system (“loss of empanelment”); developed a second SARS-CoV-2 infection at least 30 days after the initial infection; were vaccinated with a non-mRNA COVID-19 vaccine or an incomplete mRNA series; or received any dose of COVID-19 vaccine between the infection date and the end of the observation period. In addition, patients without Minnesota Research Authorization were excluded.
Vaccination status was the primary exposure of interest and was defined as unvaccinated or vaccinated (at least 2 weeks prior to the initial COVID-19 infection) with 2 mRNA vaccines or >2 mRNA vaccines. In addition to vaccination status, variables extracted from the medical record included age, sex, race, Charlson Comorbidity Index, and smoking status. Smoking status was defined as current smoker, former smoker, never smoker, or unknown. Each COVID-19 infection was defined by a positive PCR result and categorized by the prevalent SARS-CoV-2 variant circulating in the upper Midwest on the date of the initial positive PCR result: ancestral variant, 1 February 2021–14 April 2021; Alpha, 15 April 2021–8 July 2021; Delta, 9 July 2021–4 January 2022; Omicron, 5 January 2022–31 December 2022.
Statistical Analysis
Multivariable logistic regression models were used to model the outcome of medically attended and diagnosed PASC. The covariates included in these models are vaccination status at the time of the initial SARS-CoV-2 infection and potential confounders for the association between vaccination and the outcome: age, sex, race, hospitalization during the initial infection, variant period (ancestral, Alpha, Delta, Omicron), severity-weighted Charlson Comorbidity Index, and smoking status. Likelihood ratio tests were used to assess the interaction between vaccination status and prevalent variant at the time of infection, as well as between vaccination status and hospitalization for the SARS-CoV-2 infection. These interactions were assessed in the full model with all the aforementioned covariates, but the final model presented did not include smoking status due to a large number of missing values for this variable. The final model presented utilized a complete case analysis, whereby patients with missing values were not included. The analysis was conducted with R software version 4.2 (R Core Team).
This study was determined to be minimal risk and exempt from review by the Mayo Clinic Institutional Review Board (21-000967).
RESULTS
Of 59 855 individuals with SARS-CoV-2 infection identified by PCR during the enrollment period, 41 652 patients met study criteria and were included in the analysis (Figure 1). The mean age was 41 years, a majority (n = 23 006, 55.2%) were female, and 37 325 (90.7%) were White (Table 1). At the time of initial infection, 9744 (23.4%) were vaccinated with 2 doses of mRNA vaccine and 7658 (18.4%) had received >2 mRNA doses. Most infections occurred during the Delta and Omicron eras (16 538 [39.8%] and 19 605 [47.1%], respectively) and only 8.2% required hospitalization. Of those with documentation of smoking status, two-thirds had never smoked. However, smoking status was not documented for 70% of the patients. Overall, 2888 patients (6.9%) received a diagnosis of PASC during the observation period (1–6 months following the infection date). Table 2 shows the relationship between vaccination status and long COVID, stratified by COVID-19 variant.
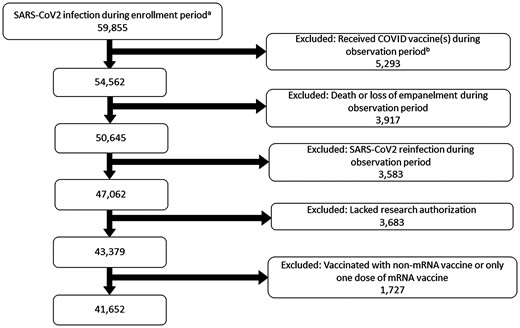
Patient screening and selection flowchart. a February 2021–31 December 2022. b Within 6 months after the date of infection.
Patient Characteristics by Vaccination Status at the Time of SARS-CoV-2 Infection
| Unvaccinated (n = 24 250) | 2 MRNA Doses (n = 9744) | >2 MRNA Doses (n = 7658) | Total (N = 41 652) | |
|---|---|---|---|---|
| Age, y | ||||
| Mean (SD) | 37.3 (21.3) | 40.8 (20.3) | 53.2 (19.9) | 41.0 (21.6) |
| 0–17 | 5566 (23.0) | 1415 (14.5) | 120 (1.6) | 7101 (17.0) |
| 18–39 | 8346 (34.4) | 3597 (36.9) | 2180 (28.5) | 14 123 (33.9) |
| 40–64 | 7221 (29.8) | 3391 (34.8) | 2884 (37.7) | 13 496 (32.4) |
| ≥65 | 3117 (12.9) | 1341 (13.8) | 2474 (32.3) | 6932 (16.6) |
| Sex | ||||
| Missing | 8 | 0 | 2 | 10 |
| Male | 11 438 (47.2) | 4077 (41.8) | 3121 (40.8) | 18 636 (44.8) |
| Female | 12 804 (52.8) | 5667 (58.2) | 4535 (59.2) | 23 006 (55.2) |
| Race | ||||
| Missing | 293 | 116 | 74 | 483 |
| White | 21 753 (90.8) | 8609 (89.4) | 6963 (91.8) | 37 325 (90.7) |
| Asian | 529 (2.2) | 364 (3.8) | 344 (4.5) | 1237 (3.0) |
| Black | 1065 (4.4) | 416 (4.3) | 171 (2.3) | 1652 (4.0) |
| Other | 610 (2.5) | 239 (2.5) | 106 (1.4) | 955 (2.3) |
| COVID-19 variant era | ||||
| Ancestral | 4373 (18.0) | 30 (0.3) | 0 (0.0) | 4403 (10.6) |
| Alpha | 991 (4.1) | 70 (0.7) | 0 (0.0) | 1061 (2.5) |
| Delta | 10 908 (45.0) | 4840 (49.7) | 835 (10.9) | 16 583 (39.8) |
| Omicron | 7978 (32.9) | 4804 (49.3) | 6823 (89.1) | 19 605 (47.1) |
| Hospitalization | ||||
| No | 22 119 (91.2) | 9188 (94.3) | 6939 (90.6) | 38 246 (91.8) |
| Hospitalized, no ICU | 1543 (6.4) | 408 (4.2) | 503 (6.6) | 2454 (5.9) |
| Hospitalized, ICU | 588 (2.4) | 148 (1.5) | 216 (2.8) | 952 (2.3) |
| Smoking status | ||||
| Missing (unknown) | 16 655 | 6818 | 5789 | 29 262 |
| Never | 5051 (66.5) | 1993 (68.1) | 1270 (68.0) | 8314 (67.1) |
| Former | 1471 (19.4) | 626 (21.4) | 486 (26.0) | 2583 (20.8) |
| Current | 1073 (14.1) | 307 (10.5) | 113 (6.0) | 1493 (12.1) |
| CCI, severity weighted | ||||
| Mean (SD) | 0.6 (1.6) | 0.7 (1.7) | 1.3 (2.4) | 0.8 (1.8) |
Data are presented as No. (%) unless noted otherwise.
Abbreviations: CCI, Charlson Comorbidity Index; ICU, intensive care unit.
Distribution of PASC Cases by Predominant SARS-CoV2 Variant and Vaccination Status
| Vaccination Status | |||
|---|---|---|---|
| Predominant Variant Eraa: PASC Classification | Unvaccinated (n = 24 250) | 2 mRNA Dosesb (n = 9744) | >2 mRNA Dosesb (n = 7658) |
| Ancestral | |||
| Total patients | 4373 | 30 | 0 |
| PASC | 353 (8.1) | 3 (10.0) | 0 |
| No PASC | 4020 (91.9) | 27 (90.0) | 0 |
| Alpha | |||
| Total patients | 991 | 70 | 0 |
| PASC | 70 (7.1) | 9 (12.9) | 0 |
| No PASC | 921 (92.9) | 61 (87.1) | 0 |
| Delta | |||
| Total patients | 10 908 | 4840 | 835 |
| PASC | 731 (6.7) | 385 (8.0) | 77 (9.2) |
| No PASC | 10 177 (93.3) | 4455 (92.0) | 758 (90.8) |
| Omicron | |||
| Total patients | 7978 | 4804 | 6823 |
| PASC | 518 (6.5) | 196 (4.1) | 546 (8.0) |
| No PASC | 7460 (93.5) | 4608 (95.9) | 6277 (92.0) |
Data are presented as No. (%).
Abbreviation: PASC, postacute sequelae of COVID-19.
aDates of variant predominance: ancestral variant, 1 February 2021–14 April 2021; Alpha, 15 April 2021–8 July 2021; Delta, 9 July 2021–4 January 2022; Omicron, 5 January 2022–31 December 2022.
bVaccinated at least 2 weeks prior to infection date.
In the multivariable analysis, no difference in medically attended and diagnosed PASC was observed between unvaccinated patients and those vaccinated with 2 doses of an mRNA vaccine (adjusted odds ratio [aOR], 0.98; P = .7) and those with >2 doses (aOR, 1.10; P = .14; Table 3). Additionally, no interaction was found between vaccination status and predominant circulating SARS-CoV-2 variant (P = .79) or between vaccination status and hospitalization for the initial infection (P = .16).
Multivariable Logistic Regression Model for Diagnosed PASC (n = 41 160)
| Characteristic | Total With PASC, No. (%) | aOR | 95% CI | P Value |
|---|---|---|---|---|
| Age, per 10 y | 1.17 | 1.14–1.19 | <.001 | |
| 0–17 | 110 (1.6) | |||
| 18–39 | 730 (5.2) | |||
| 40–64 | 984 (7.4) | |||
| ≥65 | 1033 (15.0) | |||
| Sex | ||||
| Male | 1100 (6.0) | … | … | |
| Female | 1757 (7.7) | 1.51 | 1.38–1.64 | <.001 |
| Race | ||||
| White | 2639 (7.1) | … | … | |
| Asian | 67 (5.4) | 1.07 | .81–1.39 | .6 |
| Black | 99 (6.0) | 1.07 | .85–1.33 | .5 |
| Other | 52 (5.5) | 1.01 | .74–1.36 | >.9 |
| COVID-19 variant era | ||||
| Ancestral | 351 (8.1) | … | … | |
| Alpha | 78 (7.4) | 0.90 | .67–1.18 | .5 |
| Delta | 1179 (7.2) | 0.97 | .84–1.12 | .7 |
| Omicron | 1249 (6.5) | 0.67 | .58–.78 | <.001 |
| Hospitalization for COVID-19 | ||||
| No | 1567 (4.1) | … | … | |
| Hospitalized, no ICU | 909 (37.4) | 10.1 | 9.06–11.2 | <.001 |
| Hospitalized, ICU | 381 (40.3) | 11.0 | 9.43–12.8 | <.001 |
| CCI, severity weighted, per increase of 1 | 1.05 | 1.03–1.07 | <.001 | |
| 0 | 1337 (4.5) | |||
| ≥1 | 1520 (13.6) | |||
| Vaccination status at time of SARS-CoV-2 infection | ||||
| Unvaccinated | 1654 (6.9) | … | … | |
| 2 mRNA doses | 584 (6.1) | 0.98 | .87–1.09 | .7 |
| >2 mRNA doses | 619 (8.2) | 1.10 | .97–1.24 | .14 |
Multivariable model included only the terms shown. Interaction terms with vaccination status and the main effect of smoking were not included in this model for presentation purposes. PASC was diagnosed between 30 days and 6 months after infection.
Abbreviations: aOR, adjusted odds ratio; CCI, Charlson Comorbidity Index; ICU, intensive care unit; PASC, postacute sequelae of COVID-19.
The development of medically attended and diagnosed PASC following a SARS-CoV-2 infection was associated with increasing age (aOR, 1.17 per decade; P < .001), female sex (aOR, 1.51; P < .001), non-ICU or ICU hospitalization for the initial infection (aOR, 10.1 [P < .001] and 11.0 [P < .001], respectively), and an increased severity-weighted comorbidity index (aOR, 1.05 per increase of 1; P < .001; Table 3). PASC was inversely associated with acquisition of SARS-CoV-2 infection during the Omicron period (aOR, 0.67; P < .001).
Smoking status was not associated with PASC for former and current smoking (unadjusted odds ratio, 1.02 [P = .80] and 1.06 [P = .60], respectively) relative to never smoking.
DISCUSSION
In this large cohort of empaneled primary care patients, we found no association between vaccination status at the time of a SARS-CoV-2 infection and the development of medically attended and diagnosed PASC. While most other studies identified a small to moderate association, with a lower incidence of PASC among previously vaccinated individuals, most of the study designs relied on self-reported symptom surveys rather than a clinician's diagnosis [9–11]. In a systematic review, 7 of 9 studies on vaccination for the prevention of PASC used a symptom survey to classify it [10]. Of the 2 studies using an EHR to identify PASC, 1 noted a minimal reduction in PASC risk among vaccinated patients, concluding that vaccine can provide only partial protection [12]; the other found no association between vaccination and PASC [14]. Other investigators conducting EHR analysis have revealed associations using reported symptoms or symptom-based diagnosis codes. One study defined associations between vaccination and a lower risk of myriad conditions, such as hypertension, diabetes, and thyroid disorders, as well as common nonspecific symptoms, such as fatigue, myalgias, headache, and gastrointestinal symptoms, although it did not include cognitive complaints (“brain fog”), autonomic symptoms, or a PASC diagnosis [15]. Another study classified patients as having PASC through a proprietary symptom analysis; <2% of patients developed PASC, suggesting low sensitivity for this diagnostic approach [13]. Tannous et al reported that vaccination was associated with a 42% reduction in likelihood of any constitutional symptom persisting >28 days after infection, a definition that may be overly broad [18].
Our findings are similar to those of Taquet et al, who queried a large EHR network and used diagnostic codes to identify PASC. In their propensity-matched cohorts of vaccinated and unvaccinated patients, they found many associations between vaccination and severity of infection but no association with features of PASC [14]. Similarly, Durstenfeld et al reported no association between vaccination status and development of at least 1 persistent PASC symptom following infection [19], and the RECoVERED prospective cohort study found no difference in symptoms or odds of full recovery among matched pairs of vaccinated and unvaccinated patients with PASC [20].
During the Omicron period, we observed a lower risk of developing PASC regardless of vaccination status, consistent with other recent analyses [21]. This may reflect changing virulence of the virus and the routine use of antiviral medication in individuals at high risk for severe infection, resulting in lower hospitalization rates. We found no interaction between vaccination status and circulating variant, arguing against prior vaccination as a major contributor to lower morbidity associated with Omicron infections. Immunity from prior undiagnosed infection could play a role in mitigating the severity of Omicron infections, since a larger portion of the population had been infected by this time. The associations that we observed between PASC and female sex, age, hospitalization (as a proxy for severity of infection), and comorbidities are consistent with those identified previously [22, 23].
The differences between our observations and those of other studies are most likely attributable to the defined outcome of interest and method of capturing the outcome. A strength of this study is the defined population remaining empaneled within the primary care practice in the health system throughout the observation period. This allows robust capture of medically documented outcomes. This is the primary respect in which our study design differs from the diagnostic code arm of the RECOVER trial, which is the published study most like ours [17]. Using this “captive primary care population” approach, we found nearly triple the incidence of medically attended and diagnosed PASC identified by the same diagnostic criteria as RECOVER. This may reflect greater capture of medical encounters with the local primary care providers as compared with encounters with the academic medical center conducting the study. Our study may have thus identified more mild to moderate cases with symptoms that are bothersome enough to seek medical evaluation but not require referral to a specialist or designated PASC clinic. In fact, adding completion of a clinical encounter at a designated PASC clinic to our outcome definition added only 1 patient not already identified by diagnosis code. Another possible explanation could be a more consistent use of ICD codes for suspected PASC due to the uniformity of coding instruction provided to all providers as employees of a single health system.
As compared with most other studies, ours observed a lower rate of PASC overall. This is most likely due to choosing the outcome of medically attended and diagnosed PASC rather than a symptom survey, as chosen by most other studies. In addition to providing simplicity and clarity for a condition with multiple disparate and nonspecific symptoms, medical record documentation is more likely to exist for patients who are experiencing symptoms that affect their ability to function normally. This design also avoids the risk of recall bias inherent in symptom surveys and self-reported vaccination status. In 1 study, medical diagnosis codes had a positive predictive value of 94% for PASC [16]; however, this has not been validated in the United States, and there is evidence that diagnosis codes for PASC are used more commonly in female and White patients and among patients from areas of low poverty and low unemployment [24]. We utilized the 2 most common diagnostic codes for PASC in the United States and added codes based on local practice norms. Cases may have been misclassified if the provider used a different code entirely. If providers were less inclined to use a PASC code in vaccinated patients, our results would be biased toward suggestion of a protective effect of vaccination.
Because we were interested in PASC cases likely to be associated with significant socioeconomic impact, we did not define our outcome using individual symptoms or symptom-based codes. One study of individual symptoms documented in the EHR determined that anosmia, hair loss, sneezing, ejaculation difficulty, and reduced libido had the strongest association with prior COVID-19 infection [25]. Although clinically important, these symptoms are unlikely to affect work or school attendance.
Throughout the study period, the health system periodically queried state immunization registries to actively incorporate externally administered vaccines into the EHR, minimizing risk of misclassifying vaccinated patients. Other strengths of this study include its large size, broad age range, and a study period that spans 4 eras of circulating variant predominance. Since most infections occurred during the Delta and Omicron eras, when infection severity and vaccine effectiveness had changed since the ancestral variant, findings are likely to be more applicable to the current state.
Consistent with the local population in the upper Midwest, >90% of our patients were White, limiting generalizability to races and ethnicities that are known to have, not only more severe medical outcomes following SARS-CoV-2 infection, but also lower vaccination rates and barriers to health care. Additionally, we did not seek to evaluate the role of hybrid immunity or multiple infections, the association of vaccination with severity of subsequent PASC symptoms, or the development of prolonged symptoms not requiring medical care. We excluded individuals with a second infection during the observation period, which limits generalization somewhat to that population. The use of diagnosis codes could have introduced bias if their utilization changed over time with vaccine-mediated immunity and circulating variants; this risk may be mitigated somewhat in this setting, where all providers were consistently advised regarding coding of PASC. By the end of 2022, home antigen tests had become the most common method of initial diagnosis and were inconsistently documented in the medical record. As the year progressed, we were able to detect a smaller proportion of new infections, which may have introduced selection bias if patients getting a PCR test had a higher risk of PASC. In this case, the true risk of medically attended and diagnosed PASC when the Omicron variant was predominant may have been even lower than reflected in our data.
CONCLUSIONS
While vaccination remains an important and effective tool to prevent SARS-CoV-2 infection, breakthrough infections will occur. We found no association with vaccination status at the time of infection and the development of medically attended and diagnosed PASC. Individuals should maintain currency with COVID-19 vaccination to prevent infection and reduce severity of infection. Further research is needed to identify effective means of preventing and treating PASC.
Notes
Author contributions. Conceptualization: M. D. S., L. E. B., M. G. J., D. L. R., A. V. Methodology: M. D. S., L. E. B., R. D., J. H., M. G. J., D. L. R., A. V. Data curation: J. H., M. G. J., D. L. R. Data analysis: R. D. Writing: M. D. S., L. E. B. Review and editing: R. D., J. H., A. V. Visualization: M. D. S. Supervision: M. D. S., A. V.
Patient consent statement. This study was approved for waiver of individual consent by the Mayo Clinic Institutional Review Board.
Financial support. This work was supported by an internal grant (FP00128405) from the Division of Public Health, Infectious Diseases and Occupational Medicine, Mayo Clinic.
References
Author notes
Potential conflicts of interest. M. D. S. discloses a current unpaid elected position on the American College of Occupational and Environmental Medicine Board of Directors. All other authors report no potential conflicts.


Comments