


Abstract
Immunogenicity studies suggest that recombinant influenza vaccine (RIV) may provide better protection against influenza than standard-dose inactivated influenza vaccines (SD IIV). This randomized trial evaluated the relative vaccine effectiveness (VE) and immunogenicity of RIV versus SD IIV in frontline workers and students aged 18–64 years.
Participants were randomized to receive RIV or SD IIV and followed for reverse-transcription polymerase chain reaction (RT-PCR)–confirmed influenza during the 2022–2023 influenza season. Sera were collected from a subset of participants before and at 1 and 6 months postvaccination and tested by hemagglutination inhibition for A/H1N1, A/H3N2, B/Yamagata, and B/Victoria and against cell-grown vaccine reference viruses for A/H1N1 and A/H3N2.
Overall, 3988 participants were enrolled and vaccinated (25% of the trial sample size goal); RT-PCR–confirmed influenza occurred in 20 of 1963 RIV recipients and 28 of 1964 SD IIV recipients. Relative VE was 29% (95% confidence interval [CI], −26% to 60%). In the immunogenicity substudy (n = 118), the geometric mean titer ratio (GMTR) comparing RIV to SD IIV at 1 month was 2.3 (95% CI, 1.4–3.7) for cell-grown A/H1N1, 2.1 (95% CI, 1.3–3.4) for cell-grown A/H3N2, 1.1 (95% CI, .7–1.6) for B/Victoria, and 1.4 (95% CI, .9–2.0) for B/Yamagata. At 6 months, GMTRs were >1 against A/H1N1, A/H3N2, and B/Yamagata.
Relative VE of RIV compared to SD IIV did not reach statistical significance, but RIV elicited more robust humoral immune responses to 2 of 4 vaccine viruses at 1 month and 3 of 4 viruses at 6 months after vaccination, suggesting possible improved and sustained immune protection from RIV.
Clinical Trials Registration. NCT05514002.
Influenza vaccination is the most effective method of preventing influenza and associated adverse poor health outcomes. The United States (US) Advisory Committee on Immunization Practices recommends annual influenza vaccination for all persons aged ≥6 months [1]. Although there are multiple licensed influenza vaccines that differ by antigen production process, type, and/or dose, there is currently no preferential recommendation for specific influenza vaccine types in those younger than 65 years of age, in part because of limited data about the comparative effectiveness of licensed vaccines. Influenza vaccine effectiveness (VE) varies annually depending on the match between vaccine strains and circulating strains and by influenza virus type and subtype and host factors such as age and health status. In a meta-analysis of published influenza VE studies conducted during 2007–2015, pooled influenza VE among adults aged 18–64 years against different subtypes ranged from 33% to 61% [2]. Influenza is estimated to result in 9.2–35.6 million symptomatic illnesses per year in the US, with more than half of those illnesses occurring among adults aged 18–64 years [3]. Thus, even marginal improvements in influenza VE in this age group might still prevent a substantial number of illnesses and reduce associated lost productivity and severe outcomes, which underscores the importance of evaluating the comparative effectiveness of different licensed influenza vaccines [4–6].
Egg-based inactivated influenza vaccines (IIVs) have been available for use in adults for almost a century. Egg-based vaccine production relies on propagation in embryonated chicken eggs of an egg-adapted vaccine seed strain derived from a circulating influenza virus, a process that is vulnerable to the introduction of important antigenic differences between the vaccine strain and circulating wild-type strains [7–9].
Recombinant influenza vaccines (RIVs) offer a theoretical advantage over IIV of eliciting an immune response that is better targeted to circulating influenza viruses by avoiding mutations in vaccine strains that occur during the conventional egg-based production process. RIV also contains 3 times the antigen content of standard-dose (SD) IIV, at 45 µg versus 15 µg of influenza hemagglutinin (HA) per vaccine strain. In both phase 3 and postlicensure immunogenicity trials comparing RIV to SD IIV, RIV elicited improved HA-mediated humoral antibody responses compared to SD IIV in adults aged 18–64 years for some vaccine strains during some seasons [10–13]. One recent cluster-randomized trial comparing RIV to SD IIV among adults aged 18–64 years during the 2018–2019 and 2019–2020 influenza seasons found that RIV was more effective at preventing laboratory-confirmed influenza [14]. These studies suggest that RIV may provide better protection against influenza than SD IIV, but more large-scale trials that evaluate laboratory-confirmed influenza outcomes are needed to confirm these preliminary findings. Humoral antibody responses after vaccination may not directly translate to clinical effectiveness and RIV lacks antigen components such as neuraminidase that are in IIVs.
This randomized, active-comparator trial sought to compare the effectiveness of RIV (Flublok Quadrivalent, Sanofi Pasteur) and SD IIV (Fluzone Quadrivalent, Sanofi Pasteur) to prevent reverse-transcription polymerase chain reaction (RT-PCR)–confirmed influenza and attenuate illness after infection among adults aged 18–64 years in the US and compare the immunogenicity of the 2 study vaccines in a subset of participants. The study hypotheses were that a single dose of RIV would be more effective than a single dose of SD IIV against RT-PCR–confirmed influenza illness among adults aged 18–64 years, and that RIV would elicit more robust humoral immune responses than SD IIV against vaccine antigens. This trial was discontinued early after 1 influenza season because of insufficient funding. We describe the primary trial findings including the relative VE (rVE) and immunogenicity of RIV versus SD IIV and lessons learned from the implementation of a large, decentralized trial approach to compare licensed influenza vaccines in adults 18–64 years.
METHODS
Trial Design and Participants
We conducted a randomized, participant- and investigator-blinded, active-comparator trial with 6 enrollment partners that included 7 geographic sites in the US during the Northern Hemisphere 2022–2023 influenza season. Sites recruited and enrolled participants during September–December 2022 using an electronic web portal to conduct eligibility screening, consent, and data collection. Sites aimed to include an enrolled population with at least 35% of participants who self-identified as from a racial or ethnic group that has been historically underrepresented in clinical trials (Black or African American, American Indian or Alaska Native, Native Hawaiian or Pacific Islander, or Hispanic) to optimize the racial and ethnic representativeness of the trial population compared to the US source population [15]. Eligible individuals were aged 18–64 years; proficient in either English, Spanish, or Chinese; students attending in-person classes or persons employed as frontline workers with face-to-face contact with others; and had not received the current season influenza vaccine. See Supplementary Methods for additional details on recruitment, eligibility criteria, and exclusion criteria.
Randomization
Enrolled participants were stratified by age (18–44 years, 45–64 years) and geographic site and assigned 1:1 to receive RIV or SD IIV. Both participants and study investigators were blinded to vaccine arm assignments (Supplementary Methods). A limited number of study staff administering vaccines were unblinded to vaccine assignment but were not involved with study surveillance.
Vaccine
Randomized participants received a 0.5-mL dose of study vaccine via intramuscular injection into the deltoid muscle of the upper arm. Both study vaccines contained antigens representative of the recommended 2022–2023 Northern Hemisphere influenza vaccine strain composition (Supplementary Methods).
Study Procedures
Eligible and consented participants completed an electronic enrollment questionnaire capturing baseline demographic characteristics and health information and were asked to visit a vaccination site where they were randomized and received study vaccine. Participants who reported acute illness on an online screening questionnaire administered prior to vaccination had their vaccination visit postponed until recovery.
During the period of influenza circulation, participants responded to weekly surveillance contacts for 16 weeks. Surveillance contacts asked about new onset of influenza-like illness (ILI), defined as participant-reported fever, cough, runny nose, or sore throat within the preceding 7 days. During each ILI episode, participants self-collected midturbinate nasal swabs. Swab specimens were shipped on ice to a central laboratory for testing by RT-PCR for influenza A/H1N1, A/H3N2, and B viruses using Centers for Disease Control and Prevention (CDC) protocols, probes, and primers. Influenza-positive specimens with a cycle threshold value ≤30 were sent to the CDC for whole-genome sequencing [16].
Participants reporting ILI were also administered the inFLUenza Patient-Reported Outcome Plus (FLU-PRO Plus) questionnaire daily until symptoms resolved or up to 14 days. At that time, participants answered an additional questionnaire collecting information about missed work or school and treatment and medical care. Since the safety and tolerability of each licensed study vaccine has been established in prior studies, data on reactogenicity events and adverse events were not solicited.
Immunogenicity Substudy
Participants at 1 site were recruited for an immunogenicity substudy until 120 participants were enrolled, retaining the 1:1 study vaccine randomization ratio and age strata. Substudy participants had blood taken for serum collection before vaccination (day 0) and at approximately 1 and 6 months after vaccination.
Hemagglutination inhibition (HI) assays were performed against cell-grown A/Delaware/55/2019 (H1N1)pdm09 and A/Darwin/6/2021 (H3N2) viruses and against egg-grown A/Victoria/2570/2019 (H1N1)pdm09, A/Darwin/9/2021 (H3N2), B/Austria/1359417/2021 (B/Victoria), and B/Phuket/3073/2013 (B/Yamagata) viruses. HI assays were performed with turkey erythrocytes (A/H1N1 and B) or guinea pig erythrocytes in the presence of 20 nM oseltamivir (A/H3N2) using methods that have been previously described [17]. Cell-grown A/H1N1 and A/H3N2 viruses were propagated in Madin-Darby canine kidney–SIAT1 cells. All B antigens were ether treated prior to HI assays. Two-fold serial dilutions were performed starting at 1:10 and the HI titer was defined as the reciprocal of the last dilution of serum that completely inhibited hemagglutination. Serum from all time points was tested on the same plate. All samples were tested in duplicate, and the final reported titer was the geometric mean of the duplicate titers. Samples with results <10 were assigned a titer of 5. See the Supplementary Methods for details about blood specimen collection and processing.
Outcome Measures
The primary outcome was time to RT-PCR–confirmed influenza. Secondary outcomes were time to RT-PCR–confirmed influenza by virus subtype, attenuation of influenza illness severity, and HI responses to cell- and egg-grown vaccine reference viruses. Attenuation measures included days to return to usual health, mean and highest overall symptom score as measured by the FLU-PRO Plus, and days of missed work or school. The FLU-PRO Plus is a patient-reported outcome tool that includes symptoms of respiratory tract infection across 8 body systems that has been previously validated for influenza and coronavirus disease 2019 [18, 19 ]. Daily FLU-PRO Plus symptom scores were calculated per instrument instructions.
Measures of HI responses were the geometric mean titer ratio (GMTR) of RIV compared to SD IIV recipients at 1 and 6 months postvaccination and the seroconversion rate (SCR) at 1 month postvaccination. SCR was defined as the proportion of participants with paired samples who achieved ≥4-fold rises comparing postvaccination versus prevaccination titers with a postvaccination titer ≥40.
Sample Size Estimation
A sample size goal of 16 247 participants was estimated to achieve 80% power to demonstrate superior effectiveness of RIV compared to SD IIV with a 2-sided α = .05, an assumed rVE of 30% RT-PCR–confirmed influenza rate of 4.0% among the SD IIV arm, and attrition rate of 10%. Superiority was defined by a lower bound of the 95% confidence interval (CI) of rVE of >10. The original trial design was for enrollment and conduct over at least 2 influenza seasons, but the trial ended early after the first season.
Statistical Analysis
The modified intention-to-treat (mITT) population comprised participants who were randomized, received a study vaccine, and responded to at least 1 surveillance contact during the influenza circulation period. Participants in the mITT population who did not test influenza positive within 14 days following vaccination and responded to at least 1 surveillance contact after the 14 days following vaccination were included in the analytic mITT population. The humoral immune response analytic population comprised participants who were randomized, received a study vaccine, and had blood collected at day 0 and 1 month postvaccination.
The hazard ratio of influenza virus infection between RIV versus SD IIV recipients was estimated using Cox proportional hazards regression, adjusting for geographic site and age group (18–49 and 50–64 years). T0 was defined as the first surveillance contact during influenza season that occurred at least 14 days after vaccination. rVE was calculated as 100% × (1 – hazard ratio). Subjects who withdrew or were lost to follow-up were censored at the last time of surveillance.
The peak FLU-PRO Plus symptom score and days of missed school or work were compared by vaccine using 2-sample t tests, daily symptom scores using repeated measures linear regression, and time to return to usual health using Cox regression. GMTRs were estimated using 2-sample t tests of log2-transformed titers, and proportions of seroconversion were compared with logistic regression.
All CIs were 2-sided with a 95% confidence level. All tests were 2-tailed with a level of significance of .05. Analyses were performed with SAS version 9.4 software (SAS Institute, Cary, North Carolina).
Ethical Review
The study protocol was reviewed and approved by the institutional review board (IRB) of Westat Inc, which provided site oversight and data management support. The IRB of the CDC relied upon the single IRB review of Westat Inc. This study is registered at ClinicalTrials.gov (identifier NCT05514002). Study findings are reported in accordance with CONSORT (Consolidated Standards of Reporting Trials) statement guidelines.
RESULTS
Study Enrollment and Participant Baseline Characteristics
Overall, 17 945 people were screened for eligibility and 3988 (32%) were enrolled and randomized, including 1995 to SD IIV and 1993 to RIV. Thirty-six participants (2.0%) were lost to follow-up or withdrew prior to starting surveillance, leaving 1976 per arm in the mITT population (Figure 1).
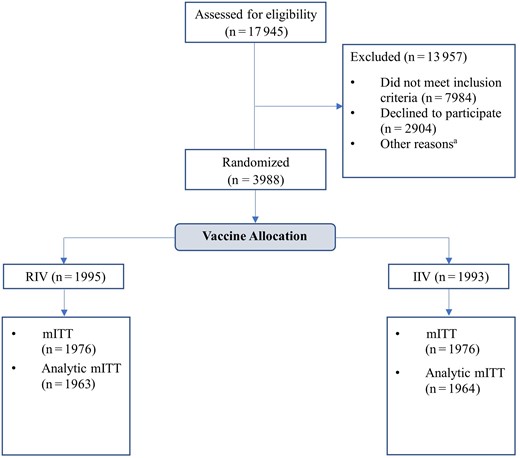
Screening, enrollment, and retention in a randomized, double-blind trial comparing the immunogenicity of recombinant influenza vaccine to standard-dose inactivated influenza vaccine among adults aged 18–64 years, 2022–2023 influenza season. aOther reasons for exclusion: did not complete eligibility screening form (n = 492), did not complete enrollment questionnaire (n = 601), not scheduled for vaccination (n = 1883), scheduled but no successful vaccination (n = 93). The modified intention-to-treat population (mITT) comprised participants who were randomized, received a study vaccine, and responded to at least 1 surveillance contact during the influenza circulation period. Abbreviations: mITT, modified intention-to-treat; RIV, recombinant influenza vaccine; SD IIV, standard-dose inactivated influenza vaccine.
Demographics and health characteristics were similar in the 2 study arms (Table 1). Participants in the mITT population were predominantly <50 years old (83%), female (63%), and frontline workers (63%). Fifty-nine percent of participants self-reported as White, 20% as Asian, and 12% as Black or African American. Fifteen percent of participants were of Hispanic or Latino/a ethnicity. Smoking (4%), medical conditions (5%), and immunosuppressive conditions (1%) were rare. Forty-one percent of participants reported receiving 5 influenza vaccines during the past 5 years (Table 1).
Baseline Characteristics of Trial Participants Overall and by Vaccine, Modified Intention-to-Treat Population, 2022–2023 Influenza Season (N = 3952)
| Characteristic | All (n = 3952) | SD IIV (n = 1976) | RIV (n = 1976) | |||
|---|---|---|---|---|---|---|
| No. | (Column %) | No. | (Column %) | No. | (Column %) | |
| Age, y | ||||||
| 18–49 | 3291 | (83.3) | 1646 | (83.3) | 1645 | (83.3) |
| 50–64 | 661 | (16.7) | 330 | (16.7) | 331 | (16.8) |
| Race | ||||||
| American Indian or Alaska Native | 29 | (0.7) | 15 | (0.8) | 14 | (0.7) |
| Asian | 782 | (19.8) | 392 | (19.8) | 390 | (19.7) |
| Black or African American | 460 | (11.6) | 228 | (11.5) | 232 | (11.7) |
| Native Hawaiian or Other Pacific Islander | 4 | (0.1) | 3 | (0.2) | 1 | (0.1) |
| White | 2348 | (59.4) | 1175 | (59.5) | 1173 | (59.4) |
| Multiracial | 148 | (3.7) | 75 | (3.8) | 73 | (3.7) |
| Declined/missing | 181 | (4.6) | 88 | (4.5) | 93 | (4.7) |
| Ethnicity | ||||||
| Hispanic or Latino/a | 600 | (15.2) | 299 | (15.1) | 301 | (15.2) |
| Not Hispanic or Latino/a | 3274 | (82.8) | 1641 | (83.1) | 1633 | (82.6) |
| Declined/missing | 78 | (2.0) | 36 | (1.8) | 42 | (2.1) |
| Gender | ||||||
| Female | 2476 | (62.7) | 1221 | (61.8) | 1255 | (63.5) |
| Male | 1406 | (35.6) | 722 | (36.5) | 684 | (34.6) |
| Transgender/other | 24 | (0.6) | 12 | (0.6) | 12 | (0.6) |
| None of these | 46 | (1.2) | 21 | (1.1) | 25 | (1.3) |
| Missing | 0 | (0.0) | 0 | (0.0) | 0 | (0.0) |
| Frontline worker/student status | ||||||
| Student only | 689 | (17.4) | 348 | (17.6) | 341 | (17.3) |
| Frontline worker only | 2492 | (63.1) | 1225 | (62.0) | 1267 | (64.1) |
| Both student and frontline worker | 771 | (19.5) | 403 | (20.4) | 368 | (18.6) |
| Missing | 0 | (0.0) | 0 | (0.0) | 0 | (0.0) |
| Smoking | ||||||
| Everyday | 55 | (1.4) | 23 | (1.2) | 32 | (1.6) |
| Some days | 102 | (2.6) | 57 | (2.9) | 45 | (2.3) |
| Not at all | 3758 | (95.1) | 1877 | (95.0) | 1881 | (95.2) |
| Declined/missing | 37 | (0.9) | 19 | (1.0) | 18 | (0.9) |
| At least 1 medical conditiona | ||||||
| Yes | 213 | (5.4) | 111 | (5.6) | 102 | (5.2) |
| No | 3533 | (89.4) | 1799 | (91.0) | 1801 | (91.1) |
| Missing | 217 | (5.5) | 66 | (3.3) | 73 | (3.7) |
| At least 1 immunosuppressive conditionb | ||||||
| Yes | 45 | (1.1) | 24 | (1.2) | 21 | (1.1) |
| No | 3534 | (89.4) | 1757 | (88.9) | 1777 | (89.9) |
| Missing | 373 | (9.4) | 195 | (9.9) | 178 | (9.0) |
| No. of influenza vaccines received during last 5 seasons | ||||||
| 0 | 635 | (16.1) | 313 | (15.8) | 322 | (16.3) |
| 1 | 394 | (10.0) | 192 | (9.7) | 202 | (10.2) |
| 2 | 397 | (10.1) | 203 | (10.3) | 194 | (9.8) |
| 3 | 381 | (9.6) | 207 | (10.5) | 174 | (8.8) |
| 4 | 401 | (10.2) | 213 | (10.8) | 188 | (9.5) |
| 5 | 1639 | (41.5) | 799 | (40.4) | 840 | (42.5) |
| Unknown/missing | 105 | (2.7) | 49 | (2.5) | 56 | (2.8) |
| FLU-PRO total score at enrollment, mean (SD)c | 0.06 | (0.14) | 0.06 | (0.01) | 0.07 | (0.17) |
| Frequency of mask use while in close proximity of others at first surveillance contact | ||||||
| All of the time | 398 | (10.1) | 199 | (10.1) | 199 | (10.1) |
| Most of the time | 877 | (22.2) | 439 | (22.2) | 438 | (22.2) |
| Some of the time | 1276 | (32.3) | 645 | (32.6) | 631 | (31.9) |
| Never | 1266 | (32.0) | 635 | (32.1) | 631 | (31.9) |
| Missing | 135 | (3.4) | 58 | (2.9) | 77 | (3.9) |
Abbreviations: FLU-PRO Plus, inFLUenza Patient-Reported Outcome Plus; RIV, recombinant influenza vaccine; SD IIV, standard-dose inactivated influenza vaccine.
aDiagnosed with or treated for at least 1 medical condition in the following categories during the past 12 months: autoimmune disorder, asthma, blood disorders, cancer, chronic lung disease, diabetes, heart conditions, high blood pressure, HIV/AIDS or other immunosuppressive condition, kidney disorder, liver disorder, metabolic disorder, neurological and neurodevelopmental conditions.
bImmunosuppressive conditions included cancer diagnosis or treatment in the past 12 months, receipt of immunosuppressive treatment or medication as a part of posttransplant treatment during the past 6 months, currently taking immunosuppressive medication, and diagnosis of HIV/AIDS irrespective of treatment status.
Relative VE and Attenuation of Influenza Illness Severity
Of the 3952 participants in the mITT population, 25 were excluded from analysis (10 who were influenza positive in the 2 weeks following vaccination and 15 who did not respond to surveillance contacts beyond 14 days after vaccination). The remaining 3927 participants (1963 RIV and 1964 SD IIV) were included in relative effectiveness analyses. There were 28 RT-PCR influenza–positive illnesses among SD IIV recipients and 20 among RIV recipients. Of the 48 influenza cases, 25 were A/H3N2 and 21 were A/H1N1, with 1 B/Victoria and 1 unsubtypable A virus. Eleven of the 21 sequenced A/H3N2 viruses belonged to genetic clade 2b with the others split between 2a.1, 2a.1b, and 2a.3. Thirteen of 14 sequenced A/H1N1 viruses belonged to genetic clade 5a.2a.1, with one 5a.2a (Supplementary Table 1).
The rVE of RIV compared to SD IIV for any influenza was 29% (95% CI, −26% to 60%). Similarly, rVE was 22% (−73% to 64%) for A/H3N2 and 25% (−78% to 68%) for A/H1N1 (Table 2). Illness duration and severity were similar among recipients of SD IIV and RIV for all measures (Table 3). Time to return to usual health was 10.9 days among SD IIV recipients and 10.5 days among RIV recipients. Average daily symptom scores and highest symptom scores among RIV recipients (0.61 and 1.34, respectively) and SD IIV recipients (0.67 and 1.37, respectively) were comparable. No hospitalizations were reported.
Influenza Incidence Rates per 10 000 Person-weeks by Vaccine Type and Relative Vaccine Effectiveness of Recombinant Influenza Vaccine Compared to Standard-Dose Inactivated Influenza Vaccine Among Adults Aged 18–64 Years, 2022–2023 Influenza Season, Modified Analytic Intention-to-Treat Population (n = 3927)
| Type of Infection | SD IIV (n = 1964) | RIV (n = 1963) | rVE, %b (95% CI) | ||
|---|---|---|---|---|---|
| No. (Column %)a | IR per 10 000 Person-weeks (95% CI) | No. (Column %) | IR per 10 000 Person-weeks (95% CI) | ||
| Any influenza virus infection | 28 | 0.9 (.6–1.3) | 20 | 0.7 (.4–1.0) | 29 (−26 to 60) |
| A/H3N2 | 14 (50.0) | 0.5 (.2–.7) | 11 (55.0) | 0.4 (.2–.6) | 22 (−73 to 64) |
| A/H1N1 | 12 (42.9) | 0.4 (.2–.7) | 9 (45.0) | 0.3 (.1–.5) | 25 (−78 to 68) |
Abbreviations: CI, confidence interval; IR, incidence rate; RIV, recombinant influenza vaccine; rVE, relative vaccine effectiveness; SD IIV, standard-dose inactivated influenza vaccine.
aAmong SD IIV recipients, there was 1 infection with a B/Victoria lineage virus and 1 infection with an unsubtypable influenza A virus.
bThe rVE was calculated as (1 − hazard ratio comparing RIV vs SD IIV) × 100%. Hazard ratios were estimated with Cox proportional hazards regression models. Models examining any influenza virus infection as an outcome were adjusted for site and age group (18–49, 50–64 years). Models examining influenza A subtype outcomes did not adjust for site or age group.
Influenza Illness Duration and Severity by Vaccine Among Adults Aged 18–64 Years, 2022–2023 Influenza Season, Influenza Cases (n = 48)
| Characteristic | Standard-Dose IIV | RIV | P Value | ||||
|---|---|---|---|---|---|---|---|
| No. | Mean | (SD) | No. | Mean | (SD) | ||
| Time to return to usual healtha, d | 25 | 10.9 | (2.7) | 20 | 10.5 | (3.3) | .560 |
| Daily symptom scoreb | 25 | 0.7 | (0.3) | 20 | 0.6 | (0.4) | .325 |
| Peak FLU-PRO Plus symptom scorec | 25 | 1.4 | (0.6) | 20 | 1.3 | (0.8) | .449 |
| Days of missed work or schoold | 25 | 1.1 | (1.5) | 17 | 1.2 | (1.5) | .724 |
Abbreviations: FLU-PRO Plus, inFLUenza Patient-Reported Outcome Plus; IIV, inactivated influenza vaccine; RIV, recombinant influenza vaccine; SD, standard deviation.
aNumber of days from onset until participant had 2 sequential responses of “yes” to the question “Have you returned to your usual health today?” in the FLU-PRO Plus Global Diary Questions or up to 14 days, whichever occurred first. The FLU-PRO Plus is a patient-reported outcome tool that includes symptoms of respiratory tract infection across 8 body systems that has been previously validated for influenza and coronavirus disease 2019 [18, 19]. Three participants did not fill out any FLU-PRO Plus questionnaires and were excluded from all FLU-PRO Plus outcome analyses. P value was estimated with a Cox proportional hazards regression model.
bFLU-PRO Plus total symptom scores calculated each day of the illness episode. P value was estimated using repeated-measures linear regression.
cThe highest total FLU-PRO Plus symptom score of the illness episode. P value estimated using the t test.
dSix participants did not complete end of illness questionnaires and were excluded from this analysis. P value from t test.
Relative Humoral Immunogenicity
There were 118 participants in the immunogenicity substudy who provided day 0 and 1 month postvaccination serum samples. Baseline titers in the 2 study arms were similar for all antigens tested (Supplementary Table 2). Postvaccination titers at 1 month were significantly higher among RIV recipients for cell-grown A/H3N2 (GMTR, 2.1 [95% CI, 1.3–3.4]) and for both cell-grown A/H1N1 (GMTR, 2.3 [95% CI, 1.4–3.7]) and egg-grown A/H1N1 (GMTR, 1.7 [95% CI, 1.1–2.5]) (Table 4). Egg-grown A/H3N2 (GMTR, 1.4 [95% CI, .9–2.2]) and B/Yamagata (GMTR, 1.4 [95% CI, .9–2.0]) titer ratios did not reach significance, and no difference was found for B/Victoria (GMTR, 1.1 [95% CI, .7–1.6]). At 6 months postvaccination, RIV recipients had significantly higher titers for all antigens tested except B/Victoria. Seroconversion rates between both arms were similar for all antigens (Table 4).
Hemagglutination Inhibition Antibody Responses After Influenza Vaccination by Vaccine Among Adults Aged 18–64 Years, 2022–2023 Influenza Season, Immunogenicity Substudy Population (n = 115)
| Vaccine | GMTR (95% CIa) | Seroconversion, No. (% [95% CIb]) | |
|---|---|---|---|
| RIV/SD IIV | SD IIV (n = 61) | RIV (n = 54) | |
| A/H3N2 cell | |||
| 1 mo postvaccination | 2.1 (1.3–3.4) | 24 (39 [28–52]) | 22 (41 [29–54]) |
| 6 mo postvaccination | 1.8 (1.2–2.6) | … | … |
| A/H3N2 egg | |||
| 1 mo postvaccination | 1.4 (.9–2.2) | 19 (31 [21–44]) | 20 (37 [25–54]) |
| 6 mo postvaccination | 1.6 (1.1–2.3) | … | … |
| A/H1N1 cell | |||
| 1 mo postvaccination | 2.3 (1.4–3.7) | 12 (20 [12–32]) | 16 (30 [19–43]) |
| 6 mo postvaccination | 2.0 (1.3–3.1) | … | … |
| A/H1N1 egg | |||
| 1 mo postvaccination | 1.7 (1.1–2.5) | 14 (23 [14–35]) | 14 (26 [16–39]) |
| 6 mo postvaccination | 1.6 (1.1–2.5) | … | … |
| B/Victoria | |||
| 1 mo postvaccination | 1.1 (.7–1.6) | 7 (11 [6–22]) | 9 (17 [9–29]) |
| 6 mo postvaccination | 1.2 (.8–1.7) | … | … |
| B/Yamagata | |||
| 1 mo postvaccination | 1.4 (.9–2.0) | 5 (8 [3–18]) | 5 (9 [4–20]) |
| 6 mo postvaccination | 1.5 (1.0–2.1) | … | … |
Abbreviations: CI, confidence interval; GMTR, geometric mean titer ratio; RIV, recombinant influenza vaccine; SD IIV, standard-dose inactivated influenza vaccine.
a95% CIs were calculated with a 2-sample t test.
b95% CIs were estimated using logistic regression.
DISCUSSION
This trial evaluated the relative effectiveness and humoral immunogenicity of quadrivalent recombinant influenza vaccine compared to SD egg-based vaccine among students and frontline workers aged 18–64 years. The trial enrolled 25% of the target sample size for effectiveness outcomes and ended early because of funding constraints. The point estimate of the rVE of RIV compared to SD IIV was 29% during an A/H3- and A/H1-predominant influenza season when there was no notable antigenic drift comparing the viruses detected in the trial population with the vaccine strains; however, results did not reach statistical significance. No differences were observed in measures of disease attenuation between RIV and SD IIV recipients. These findings must be considered in the context of insufficient sample size, and it is not possible to know whether significant differences in outcomes would have been found if the trial had continued to completion. We did find that RIV induced more robust antibody responses against HA than SD egg-based vaccine against 3 of the 4 vaccine antigens (A/H1N1, A/H3N2, and B/Yamagata) at 1 month and 6 months postvaccination. This finding is consistent with the observed VE point estimate (albeit not significant) demonstrating a reduction in RT-PCR–confirmed influenza illness among RIV recipients in this trial and findings from a recently published cluster-randomized trial that compared RIV to SD IIV [14].
Our findings that RIV elicited more robust and sustained antibody responses to HA for multiple vaccine antigens at 1 and 6 months postvaccination are consistent with prior immunogenicity trials among adults aged 18–64 years and aged ≥65 years [20–22]. HI titers are an accepted marker of protection for influenza vaccines [23–25]. The improved humoral antibody response to RIV compared to SD IIV may be from a 3-fold higher antigen content in RIV, although a study that compared RIV (45 μg/antigen), high-dose IIV (60 μg/antigen), and SD IIV (15 μg/antigen) among adults 18–64 years did not find the same improved humoral response to high-dose IIV [26], suggesting that other attributes of RIV may contribute to improved humoral responses to RIV. Furthermore, our results suggested that the lack of neuraminidase component in the RIV did not compromise the rVE of RIV when compared to IIV. Both RIV and IIV recipients had high baseline HI titers against vaccine strains, consistent with the high proportion of participants who reported frequent prior influenza vaccination. As a result, seroconversion was rare and may be a less useful measure in highly influenza vaccinated populations.
At present, only a small fraction of influenza vaccine recipients aged 18–64 years in the US receive RIV [27], likely driven by higher costs and a relatively limited supply of RIV. Low RIV uptake is an obstacle to observational assessments of the rVE of RIV compared to SD IIV. Additionally, individuals who receive RIV may differ from those who receive SD IIV in ways that are associated with VE, which poses an additional challenge for observational assessments of rVE [28]. Thus, to establish whether RIV is more effective than SD IIV at preventing influenza illness over multiple seasons, observational studies that increase RIV uptake and employ strategies to reduce differences in those who receive RIV versus SD IIV or large-scale effectiveness trials, such as the recent cluster-randomized trial conducted by Hsiao et al [14], are needed. Similar considerations may apply to other next-generation influenza vaccines currently in prelicensure trials, such as messenger RNA influenza vaccines.
Our experience in this trial highlights several challenges to designing trials to compare the effectiveness of different types of influenza vaccines. First, because influenza vaccines are recommended for all persons aged >6 months in the US, including a placebo or control arm to assess the absolute effectiveness of different vaccine types is considered unethical. As a result, trials must focus on rVE, which varies by season depending on the effectiveness of the comparator vaccine [29]. Second, trials of rVE require large sample sizes to identify what are likely to be relatively small to moderate effect sizes when comparing 2 types of influenza vaccines, at least among currently licensed vaccines. Third, trials must enroll large samples of participants during a relatively short period from when the annual influenza vaccine becomes available to the start of influenza virus circulation. Fourth, trials must contend with the unpredictability of influenza circulation and the fact that some seasons may have unusually low circulation. Taken together, these challenges mean that a well-designed trial comparing different types of licensed influenza vaccines requires stable and substantial resources over multiple seasons.
Despite early cessation, this trial demonstrated the feasibility of several emerging approaches to trial design that should be considered for future influenza and other vaccine trials. First, to optimize the efficiency of the screening and enrollment process, trial sites used a decentralized approach that directed potentially eligible participants to an online portal for screening, consent, and enrollment. This approach allowed 6 sites to enroll almost 4000 participants in just over 2 months. This process could be enhanced in future studies with the addition of research registries and group enrollment sites at community or occupational influenza vaccination drives and campaigns. Second, the trial aimed to optimize enrollment of an economically and educationally diverse population by enrolling frontline workers and focusing enrollment on a participant population whose self-reported racial and ethnic composition approximated the composition of the US based on census data. To meet the latter goal, sites were asked to enroll at least 35% of their participant population from historically underrepresented racial and ethnic groups and met this goal through a variety of focused recruitment strategies and community partnerships.
The main limitation of this trial was that it was underpowered to detect rVE because of early cessation. Therefore, null findings may be due to insufficient statistical power. Despite this limitation, it remains important that null trial findings are published as results may contribute to meta-analyses, and documenting trial experience and outcomes can inform future trial design. Second, the trial was limited to a single influenza season, so findings may not be generalizable to other seasons, although the relative humoral immunogenicity findings are consistent with a growing body of evidence from multiple previous influenza seasons that RIV elicits higher HA antibody responses than SD IIV. Cell-mediated immune responses among trial participants are also being evaluated and will be reported in the future.
In conclusion, during the 2022–2023 influenza season, participants randomized to receive RIV achieved higher HA antibody titers to 3 of 4 vaccine strains compared to recipients of SD egg-based vaccine. The trial also detected a possible improved rVE among RIV recipients compared to SD IIV for prevention of influenza illness, but findings did not reach statistical significance. This trial underscores key challenges in the design of trials to assess relative influenza VE but also demonstrates the feasibility of innovative approaches to trial enrollment. Assessing whether next-generation influenza vaccines protect against influenza illness better than SD egg-based vaccines remains a priority to optimize influenza prevention. To achieve this goal will require innovative observational study approaches or randomized trial designs and a commitment to stable support through study completion.
Supplementary Data
Supplementary materials are available at Open Forum Infectious Diseases online. Consisting of data provided by the authors to benefit the reader, the posted materials are not copyedited and are the sole responsibility of the authors, so questions or comments should be addressed to the corresponding author.
Notes
Acknowledgments. The authors thank the trial participants’ contributions to advancing the understanding of influenza vaccines and their effectiveness. The authors also thank Dr Natalie Dean of the Emory University Rollins School of Public Health for statistical consultation and developing the approach to an interim blinded sample size reestimation for this trial and Dr John Powers of the National Institutes of Health for consultation on the use of the FLU-PRO Plus data collection instrument. The Randomized Assessment of Influenza Vaccine Efficacy Network (RAIVEN) members are as follows: Julie Mayo-Lamberte and Lenee Blanton (Centers for Disease Control and Prevention [CDC], Atlanta, Georgia); Catherine Mary Healy (Baylor College of Medicine, Houston, Texas); Jacob McKell, Rachel Brown, Jesse Williams, and Riley Campbell (Rocky Mountain Center for Occupational and Environmental Health, Division of Occupational and Environmental Health, Department of Family and Preventive Medicine, University of Utah Health, Salt Lake City); and Fornessa T. Randal (Center for Asian Health Equity, University of Chicago/Asian Health Coalition).
Disclaimer. The findings and conclusions in this report are those of the authors and do not necessarily represent the views of the CDC.
Financial support. This study was funded by the Centers for Disease Control and Prevention (contract number 75D30121C12393 with Westat, Inc).
References
Author notes
Study Group team members are listed in the Acknowledgments.
Potential conflicts of interest. All authors: No reported conflicts of interest.


Comments