


Abstract
Country- and region-specific estimates of hepatitis B virus (HBV) screening, prevalence, and immunity rates are provided for 202 868 adults from 174 unique countries in a large urban safety-net system. Of these, 41.8% (95% confidence interval, 41.5%–42.0%) were screened, with age-adjusted HBV prevalence of 0.9% (.9%–1.0%); 55.3% (54.9%–55.7%) had immunity testing, and 32.4% (31.9%–33.0%) were immune.
Chronic hepatitis B virus (HBV) continues to be a global health challenge with high morbidity and mortality rates, with complications such as cirrhosis and hepatocellular carcinoma continuing to occur despite readily available and effective therapeutics due to inadequate awareness of infection [1, 2]. The United States Preventive Services Task Force and American Association for the Study of Liver Disease (AASLD) HBV screening guidelines currently recommend screening among those at increased risk [3, 4]. In a recent shift, the Centers for Disease Control and Prevention updated their recommendations in 2023 for one-time universal HBV screening in adults aged ≥18 years [5] and vaccination among nonimmune adults aged 19–59 years [6].
With competing guidelines, knowledge of current screening rates can inform this ongoing debate around an optimal screening strategy. Furthermore, HBV seroprevalence is substantially higher in foreign-born than in general US populations [7]. However, desegregated rates of screening and prevalence in the United States by birth country are largely unknown owing to lack of available birthplace data in most cohorts. The current study aims to provide current epidemiologic estimates of country- and region-specific screening, prevalence, and immunity rates for chronic HBV in a large US safety-net cohort enriched for foreign-born persons.
METHODS
We performed a retrospective analysis of adults aged >18 years with ≥2 outpatient primary care visits in the Los Angeles County Department of Health Services healthcare system between 1 January 2017 and 31 December 2021. This system is the nation’s second-largest integrated municipal health system, providing safety net care to the US county with the largest foreign-born population, at 1 in 3 residents. We included those with self-reported country of birth on initial contact with the system (missing in 1.7%). We also obtained the following: age, sex, and any laboratory testing for hepatitis B surface antigen (HBsAg), hepatitis B core antibody (HBcAb), and hepatitis B surface antibody (HBsAb), including dates outside the study period. The study was approved as exempt from patient consent by the University of Southern California Institutional Review Board.
Country- and region-specific HBV screening rates (with 95% confidence intervals) were estimated as the proportion tested for HBsAg among the total study population. Age-adjusted HBV prevalence rates were estimated as the proportion with positive HBsAg results from all screened, with age standardization to the 2000 US census population. Among those testing negative for HBsAg and aged 19–59 years, rates of HBsAb testing and HBV immunity were defined by HBsAb titers ≥12 U/L, based on the lower limit of immunity at our institution. Countries were grouped into 6 World Health Organization regions; countries with <100 persons screened were excluded from country-specific but not regional analyses. We also provided grouped estimates by countries that do versus do not meet risk-based criteria per AASLD guidelines [4]. Prevalence estimates based on <5 persons were suppressed. Analyses were performed using Stata software, version 17 (StataCorp).
RESULTS
A total of 202 868 persons met inclusion criteria over the study period, representing 174 unique countries of birth. The majority were countries from the World Health Organization Region of the Americas (86.2%), followed by Western Pacific (6.8%), European (2.7%), Eastern Mediterranean (2.4%), South-East Asian (1.1%) and African (0.8%) regions. The median cohort age was 55 years, and 41.2% of those included were male. The majority of the cohort was foreign-born, while US-born individuals accounted for 38.0%. Region- and country-specific screening, age-adjusted prevalence, and immunity rates are presented in Table 1. Overall, 41.8% (95% confidence interval [CI], 41.5%–42.0%) were screened for HBV, and the age-adjusted HBV prevalence was 0.9% (.9%–1.0%). Of the 55.3% (95% CI, 54.9%–55.7%) of uninfected persons aged 19–59 years who received HBsAb testing, 32.4% (31.9%–33.0%) were HBV immune.
Region-Specific and Country-Specific Screening, Prevalence, and Immunity Rates for Hepatitis B Infection
| Region or Country | Patients, No. | Age, Median (IQR), y | % Male | % Screened (95% CI) | Prevalence, % (95% CI)a | % Immune (95% CI) |
|---|---|---|---|---|---|---|
| WHO region | ||||||
| African Region | 1664 | 58 (43–67) | 42.8 | 43.5 (41.1–45.9) | 4.9 (3.3–6.4) | 54.7 (48.5–60.7) |
| Region of the Americas | 174 777 | 55 (40–64) | 41.3 | 41.9 (41.7–42.1) | 0.3 (.3–.4) | 30.4 (29.8–30.9) |
| South East Asian Region | 2185 | 61 (49–68) | 44.0 | 42.7 (40.7–44.9) | 3.6 (2.4–4.8) | 49.3 (43.4–55.2) |
| European Region | 5542 | 56 (44–64) | 41.3 | 35.6 (34.3–36.9) | 0.8 (.4–1.2) | 35.0 (31.2–38.9) |
| Eastern Mediterranean Region | 4929 | 57 (44–64) | 47.0 | 37.2 (35.8–38.5) | 0.8 (.4–1.2) | 41.0 (37.1–44.9) |
| Western Pacific Region | 13 771 | 62 (53–68) | 36.4 | 43.7 (42.8–44.5) | 6.6 (5.9–7.3) | 55.4 (53.0–57.8) |
| Country | ||||||
| Afghanistan | 217 | 41 (31–56) | 48.9 | 54.4 (47.5–61.1) | … | 37.9 (27.7–49.0) |
| Argentina | 247 | 61 (49–68) | 44.9 | 37.7 (31.6–44.0) | 1.5 (.6–2.3) | 23.3 (9.9–42.3) |
| Armenia | 2732 | 54 (43–62) | 39.8 | 32.2 (30.5–34.0) | … | 33.5 (27.7–39.6) |
| Bangladesh | 380 | 55 (42–64) | 49.2 | 43.7 (38.6–48.8) | 3.0 (.4–5.7) | 45.7 (33.7–58.1) |
| Belize | 1004 | 62 (54–69) | 28.1 | 35.8 (32.8–38.8) | … | 40.4 (31.1–50.2) |
| Bolivia | 117 | 62 (53–68) | 43.6 | 41.0 (32.0–50.5) | … | 44.4 (13.7–78.8) |
| Brazil | 232 | 53 (40 63) | 38.4 | 43.1 (36.6–49.8) | … | 24.3 (11.8–41.2) |
| Cambodia | 714 | 61 (51–67) | 34.6 | 59.9 (56.2–63.6) | 10.2 (6.8–13.5) | 66.0 (57.5–73.7) |
| Canada | 124 | 59 (46–66) | 58.9 | 45.2 (36.2–54.4) | … | 35.3 (14.2–61.7) |
| Chile | 150 | 63 (54–71) | 47.3 | 42.0 (34.0–50.3) | … | 9.1 (.2–41.3) |
| China/Taiwan/Hong Kong | 3455 | 61 (52–67) | 32.7 | 42.2 (40.6–43.9) | 10.5 (8.8–12.3) | 63.9 (59.1–68.4) |
| Colombia | 587 | 61 (49–68) | 32.7 | 42.6 (38.6–46.7) | … | 34.7 (23.9–46.9) |
| Costa Rica | 133 | 62 (56–68) | 36.1 | 34.6 (26.6–43.3) | … | 27.3 (6.0–61.0) |
| Cuba | 414 | 63 (56–69) | 48.8 | 35.0 (30.4–39.8) | … | 43.6 (27.8–60.4) |
| Ecuador | 504 | 62 (53–68) | 33.5 | 40.5 (36.2–44.9) | … | 18.5 (9.3–31.4) |
| Egypt | 392 | 57 (43–67) | 53.6 | 37.0 (32.2–42.0) | … | 34.6 (22.0–49.1) |
| El Salvador | 14 178 | 60 (51–67) | 31.4 | 42.7 (41.9–43.5) | 0.4 (.2–.5) | 21.7 (19.9–23.6) |
| Ethiopia | 307 | 60 (47–66) | 38.8 | 44.0 (38.3–49.7) | 5.1 (1.2–9.1) | 51.3 (34.8–67.6) |
| Germany | 141 | 59 (41–66) | 47.5 | 36.9 (28.9–45.4) | … | 33.3 (11.8–61.6) |
| Guatemala | 8884 | 58 (48–66) | 37.9 | 43.1 (42.0–44.1) | 0.2 (.1–.4) | 20.4 (18.2–22.6) |
| Honduras | 2381 | 57 (47–65) | 29.7 | 43.8 (41.8–45.8) | … | 16.1 (12.6–20.2) |
| India | 669 | 62 (51–69) | 51.9 | 39.0 (35.3–42.8) | … | 39.4 (28.0–51.8) |
| Indonesia | 169 | 62 (50–70) | 40.8 | 45.0 (37.3–52.8) | … | 55.6 (30.8–78.5) |
| Iran | 2913 | 57 (46–64) | 44.5 | 35.4 (33.6–37.1) | 0.7 (.2–1.2) | 45.3 (39.8–50.8) |
| Iraq | 169 | 56 (40–65) | 53.9 | 39.6 (32.2–47.4) | … | 13.3 (1.7–40.5) |
| Israel | 132 | 57 (46–66) | 59.0 | 35.6 (27.5–44.4) | … | 38.9 (17.3–64.3) |
| Jamaica | 257 | 62 (52–68) | 43.2 | 40.5 (34.4–46.7) | … | 29.0 (14.2–48.0) |
| Japan | 239 | 57 (46–65) | 38.1 | 46.4 (40.0–53.0) | … | 35.6 (21.9–51.2) |
| Jordan | 118 | 58 (42–64) | 54.2 | 42.4 (33.3–51.8) | … | 46.2 (19.2–74.9) |
| North Korea | 199 | 62 (56–66) | 25.6 | 43.7 (36.7–50.9) | 8.2 (.0–17.0) | 57.9 (33.5–79.8) |
| South Korea | 1520 | 62 (55–66) | 31.6 | 47.1 (44.6–49.7) | 2.9 (1.9–3.9) | 53.8 (47.0–60.5) |
| Lebanon | 350 | 59 (52–65) | 48.0 | 30.3 (25.5–35.4) | … | 19.4 (7.5–37.5) |
| Mexico | 64 552 | 58 (50–66) | 37.2 | 43.7 (43.3–44.1) | 0.3 (.2–.4) | 22.8 (22.0–23.6) |
| Myanmar | 154 | 60 (52–68) | 39.6 | 44.2 (36.2–52.4) | 7.2 (1.8–12.6) | 77.8 (57.7–91.4) |
| Nicaragua | 1177 | 62 (54–68) | 31.3 | 38.8 (36.0–41.7) | … | 23.4 (16.6–31.3) |
| Nigeria | 767 | 61 (47–69) | 41.3 | 39.6 (36.2–43.2) | 5.5 (2.9–8.1) | 56.9 (47.4–66.1) |
| Pakistan | 302 | 57 (40–65) | 51.7 | 41.1 (35.5–46.8) | … | 57.1 (32.9–61.5) |
| Peru | 1156 | 62 (53–69) | 41.9 | 42.1 (39.3–45.0) | … | 28.5 (20.9–37.0) |
| Philippines | 5893 | 63 (53–70) | 39.6 | 42.0 (40.7–43.3) | 3.2 (2.5–3.9) | 46.3 (42.4–50.2) |
| Romania | 106 | 60 (49–69) | 33.0 | 43.4 (33.8–53.4) | … | 60.0 (32.3–83.7) |
| Russia | 834 | 58 (45–65) | 35.1 | 42.6 (39.2–46.0) | … | 40.2 (31.2–49.7) |
| Samoa, Western | 123 | 60 (48–66) | 43.9 | 38.2 (29.6–47.4) | … | 43.8 (19.8–70.1) |
| Sri Lanka | 164 | 62 (52–69) | 48.8 | 39.0 (31.5–46.9) | … | 22.7 (7.8–45.4) |
| Syria | 286 | 58 (47–64) | 43.7 | 40.6 (34.8–46.5) | … | 41.3 (27–56.8) |
| Thailand | 362 | 61 (48–67) | 35.4 | 48.3 (43.1–53.6) | 7.2 (3.4–10.9) | 63.8 (48.5–77.3) |
| United States | 78 082 | 44 (32–60) | 47.7 | 40.3 (39.9–40.6) | 0.4 (.3–.5) | 39.6 (38.8–40.4) |
| Uganda | 114 | 47 (35–62) | 42.1 | 47.4 (37.9–56.9) | … | 59.1 (36.4–79.3) |
| Ukraine | 465 | 58 (47–66) | 43.0 | 38.3 (33.8–42.9) | … | 26.7 (16.0–39.7) |
| Venezuela | 151 | 52 (38–64) | 44.4 | 41.7 (33.8–50.0) | … | 26.1 (10.2–48.4) |
| Vietnam | 1521 | 61 (53–67) | 35.9 | 43.3 (40.8–45.9) | 12.8 (9.7–15.8) | 70.7 (63.1–77.4) |
| United Kingdom | 166 | 56 (43–64) | 51.2 | 33.7 (26.6–41.5) | … | 31.3 (11.0–58.7) |
Abbreviations: CI, confidence interval; IQR, interquartile range; WHO, World Health Organization.
aAge adjusted (standardized) to the 2000 US census population. Prevalence estimates based on <5 positive cases were not reported.
Of US-born persons, 40.3% (95% CI, 39.9%–40.6%) were screened, compared with 42.7% (42.4%–43.0%) of foreign-born persons. Rates of screening were <45% across all regions. These rates were similar among countries that fall under AASLD risk-based criteria and those that do not (42.6% vs 40.6%, respectively). HBV screening rates ranged from 30.1% to 59.9% by country, with >50% screened in only 2 countries (Afghanistan and Cambodia).
Among US-born persons, the age-adjusted HBV prevalence was 0.4% (95% CI, .3%–.5%), compared with 1.2% (1.1%–1.3%) among the foreign-born. HBV prevalence varied widely by region: from 0.3% for the Region of the Americas to 6.6% for the Western Pacific Region. The age-adjusted HBV prevalence was high (≥5%) among foreign-born persons from Vietnam, China/Taiwan/Hong Kong, Cambodia, North Korea, Myanmar, Thailand, Nigeria, and Ethiopia and moderate (≥2%) among those from Bangladesh, South Korea, and the Philippines (see Figure 1).
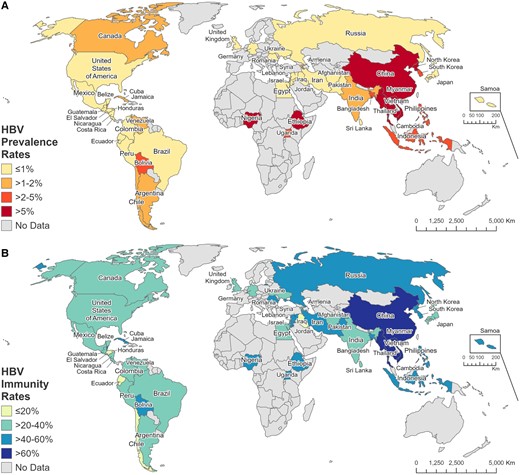
Prevalence of hepatitis B surface antigen positivity (A) and hepatitis B virus (HBV) immunity rates (B) by country of birth. Geographic boundaries are based on data from Natural Earth (country shape files, 1:110 and 1:50 million; downloaded 23 March 2023 from https://www.naturalearthdata.com).
Among those without HBV, 16.5% overall underwent HBcAb testing, with 11.2% of those tested demonstrating prior exposure to HBV (HBcAb+, HBsAb+/−) and 20.8% with vaccine immunity (HBcAb−, HBsAb+). There was substantial variation in rates of prior exposure by region, from 7% for the Region of the Americas to >40% in the African and Western Pacific regions (Supplementary Table 1).
With respect to HBV immunity, 53.2% of US-born persons had HBsAb testing, with immunity rates of 39.6% (95% CI, 38.8%–40.5%); 60.0% of foreign-born persons were tested, with immunity rates of 27.6% (26.9%–28.2%). HBV immunity rates ranged widely by country, from 9.1% (95% CI, .2%–42.3%) from Chile to 77.8% (57.7%–91.4%) from Myanmar.
DISCUSSION
This snapshot of current US immigrants within a large safety-net system with a high proportion of foreign-born persons shows that <50% of patients in primary care clinics were screened for HBV, regardless of country of birth. These data demonstrate the limitations of risk-based HBV screening as currently recommended by the United States Preventive Services Task Force and the AASLD, and we urge the adoption of universal screening by all societies. To our knowledge, this is the first report of HBV screening rates among US immigrants by country of origin, as previous studies relied on systematic reviews of native country seroprevalence, which were then applied to the distribution of foreign-born US residents [8, 9]. Seroprevalence rates were comparable to reported rates within respective countries, with variation expected as our cohort is not population based and less precise owing to smaller sample sizes at the country level [10]. In resource-constrained health systems, country-level data can guide targeted patient education and interventions.
As continued high HBV prevalence was observed among immigrants from endemic countries with low-moderate rates observed in nonendemic countries, scaling up efforts to screen foreign-born individuals is paramount for reducing HBV-related morbidity and achieving HBV elimination in the United States. Furthermore, only 50% without HBV infection were tested for immune status, of whom one-third were immune, slightly higher than the 23.1% estimated in the total US population based on National Health and Nutrition Examination Survey data [11]. This highlights the challenge of delivering vaccines to both foreign-born and US-born individuals, as the COVID-19 pandemic revealed vaccine hesitancy among vulnerable populations as a pressing public health concern. Health system interventions that couple HBV screening and vaccination in line with the new the Centers for Disease Control and Prevention recommendations for both universal screening and vaccination are needed to address the current gap [5, 6].
One limitation of the current study is that it may not be generalizable to other regions in the United States owing to differences in immigration patterns and other healthcare systems that may have different screening practices, though this is the largest US cohort to date with robust birthplace information. Estimates for certain countries with small sample sizes may not be reliable. Underestimation of rates may occur if patients were tested outside our system, though this is unlikely as the data arises from a safety-net system providing frontline non–referral-based primary care. Risk factors for lack of screening and vaccination could not be assessed in this administrative data set, and represent an important area for future investigation.
In conclusion, this study provides valuable country-specific epidemiologic data to guide public health practices and development of guideline and to monitor responses to changes in HBV screening and vaccination policy.
Supplementary Data
Supplementary materials are available at Open Forum Infectious Diseases online. Consisting of data provided by the authors to benefit the reader, the posted materials are not copyedited and are the sole responsibility of the authors, so questions or comments should be addressed to the corresponding author.
Acknowledgments
Potential conflicts of interest. K. Z. reports institutional grant support from Gilead Sciences. N. A. T. discloses institutional grant support from Gilead Sciences, GSK, Helio Health, Eiger Pharmaceuticals, and Durect. All other authors report no potential conflicts


Comments