


Abstract
Although increased occurrence of septicemia in persons with Clostridioides difficile infection (CDI) has been reported, incidence rates and risk of septicemia and urinary tract infection (UTI) after CDI are unclear.
The first episode of CDI was identified using 2011–2017 MarketScan and CMS Medicare data and CDI cases categorized by standard surveillance definitions. Uninfected persons were frequency matched 4:1 to cases by the CDI case surveillance definition. Multivariable Cox proportional hazards models were used to identify risk factors for septicemia and UTI within 90 days of CDI onset, accounting for the competing risk of death in the Medicare population.
The incidence of septicemia was highest after hospital-onset CDI in the Medicare, younger commercial, and younger Medicaid populations (25.5%, 15.7%, and 19.5%, respectively) and lowest in those with community-associated CDI (3.8%, 4.3%, and 8.3%, respectively). In contrast, the incidence of UTI was highest in those with other healthcare facility onset CDI in all 3 populations (32.1%, 24.2%, and 18.1%, respectively). Hospital-onset CDI was associated with highest risk of septicemia compared with uninfected controls in all 3 populations. In the younger populations, risk of septicemia was more uniform across the CDI surveillance definitions. The risk of UTI was significantly higher in all CDI surveillance categories compared to uninfected controls, and among CDI cases it was lowest in those with community-associated CDI.
The incidence of septicemia is high after CDI, particularly after hospital-onset infection. Additional preventive measures are needed to reduce infectious complications of CDI.
Clostridioides difficile is the most common cause of healthcare-associated infection in the United States [1], and it was responsible for an estimated 476 400 cases in 2017 [1]. Severe outcomes directly attributable to CDI include pseudomembranous colitis and toxic megacolon, colectomy, longer hospital length of stay, transfer to a skilled nursing or long-term care facility, and death [2–7].
Septicemia after CDI has been reported by several investigators, including bloodstream infection (BSI) with bacteria, fungi, C difficile itself, and polymicrobial BSI [8–14]. Possible causes of bacterial BSI after CDI include (1) gut dysbiosis due to antibiotic therapy preceding CDI and CDI treatment antibiotics and (2) disruption of the colonic mucosa by C difficile toxins resulting in translocation of resident gut flora into the bloodstream [12, 15, 16]. In addition, a small number of case reports of BSI due to organisms present in probiotic preparations [17–19], and 1 case of BSI caused by an antibiotic-resistant organism present in a fecal microbiota transplant preparation, have been reported [20].
Although less information is available on urinary tract infections (UTIs) after CDI, it is possible that gut dysbiosis due to antibiotics and/or CDI itself may result in selection of uropathogenic Enterobacterales and other Gram-negative bacteria in the gastrointestinal tract, including antibiotic-resistant organisms [16, 21]. Consistent with selection of antibiotic-resistant microorganisms by CDI is the finding that administration of a donor microbiota suspension to persons with recurrent CDI (rCDI) resulted in decreased antibiotic-resistant Enterobacterales burden in stool [22]. In addition, Thänert et al [23] found that the antibiotic-resistant uropathogen load in stool increased before appearance of the same organism in urine of some patients with recurrent UTIs.
Although existing evidence suggests that septicemia is more common after CDI than in persons without symptomatic CDI, the burden of septicemia depending on the site of CDI onset is unknown, because most studies have been conducted in patients with hospital-onset (HO) CDI. We used claims data from younger and older adults to determine the incidence and risk of septicemia and UTI in persons with CDI, to determine whether the occurrence of these infectious outcomes varied depending on the CDI surveillance definition and to study the hypothesis that CDI is associated with increased risk of septicemia and UTI.
METHODS
Data for this study from 2011 to 2017 were derived from (1) the Centers for Medicare & Medicaid Services Chronic Conditions Warehouse for a 5% sample of Medicare beneficiaries and the Merative MarketScan (2) Commercial and (3) Multi-State Medicaid databases for persons younger than 65 years. The Medicare population was restricted to elderly individuals with complete fee-for-service and no health maintenance organization enrollment, whereas the MarketScan databases were restricted to those aged 25–64 years.
Patient Consent Statement
No patient consent was obtained for this study. The Washington University Office of Human Research Protections (OHRP) approved this study with a waiver of informed consent for analyses of the Medicare data. The OHRP considered the MarketScan analyses to be exempt from human studies research requirements due to the limited dataset structure of MarketScan.
Identification of Clostridioides difficile Infection and Covariates
International Classification of Diseases, 9th/10th edition (ICD-9/-10), Clinical Modification diagnosis codes were used to identify incident cases of CDI [24], with the first episode coded for CDI used for analysis. Patients with CDI were frequency matched to uninfected individuals 1:4 based on age group, year of CDI, and CDI surveillance definition (HO, other healthcare facility onset [OHFO], healthcare facility associated [HCFA], and community associated [CA]), as described previously [24, 25]. Control patients without CDI were assigned index dates to match the distribution of CDI case onset dates, and these were classified into surveillance definitions based on their index date location and recent treatment in a healthcare facility.
Septicemia and UTI in the 90 days after the onset date were identified using ICD-9/-10 diagnosis codes (Supplementary Table 1). Septicemia required coding during a hospitalization or an emergency department encounter. For persons coded for septicemia only during an emergency department encounter, a discharge status of death was required. Infectious outcomes required coding on only 1 inpatient or outpatient claim, excluding potential rule-out diagnoses on claims for laboratory or diagnostic testing. Persons with septicemia in the 30 days before the onset date were excluded for the septicemia analyses, and persons coded for UTI in the 30 days before the onset date were excluded for the UTI models, to focus on incident infections after CDI.
Medical claims in the year before the onset date were used to define comorbidities, infections within 90 days, and other relevant medical conditions, as described previously [26, 27] (Supplementary Table 1).
Statistical Analyses
Descriptive statistics were performed using frequencies for categorical variables and means (standard deviation) or medians (interquartile range) for continuous variables. The risks of 90-day septicemia and 90-day UTI based on CDI surveillance categories were assessed using multivariable Cox proportional hazards models, controlling for clinically relevant covariates. In the Medicare population, models were performed taking into account the competing risk of death (mortality could not be completely assessed in the MarketScan populations). Variables significant in any of the 3 populations in the multivariable Cox models were retained for the septicemia and UTI analyses.
Kaplan-Meier plots for time to septicemia and time to UTI were performed in all 3 populations, and time to death in the Medicare population was performed using PROC LIFETEST, with comparisons using the log-rank test. Cox proportional hazards models were performed using PROC PHREG. For the Medicare population, the Fine and Gray subdistribution model was used to calculate infection-specific hazards. Proportional hazards were assessed visually using the Kaplan-Meier plots. All data management and analyses were performed using SAS v9.4 statistical software (SAS, Cary, NC).
RESULTS
From 2011 to 2017 60 492 persons in the Medicare population aged 66 years and older coded for CDI were identified and frequency-matched 1:4 to 241 968 uninfected controls. After exclusions for preceding infections in the 30 days before the onset date, 240 955 persons remained for the septicemia and 218 369 persons remained for the UTI analyses. In the MarketScan Commercial population, 69 610 persons were identified with CDI and frequency-matched 1:4 to 278 440 uninfected persons. After excluding for infections in the prior 30 days, 335 340 persons remained for the septicemia and 334 071 persons remained for the UTI analyses. For the MarketScan Medicaid population, 15 927 persons with CDI were frequency matched approximately 1:4 to 63 876 uninfected persons. After excluding for infections in the prior 30 days, 73 870 persons remained for the septicemia and 75 352 persons remained for the Medicaid UTI analyses (Supplementary Figures 1 and 2).
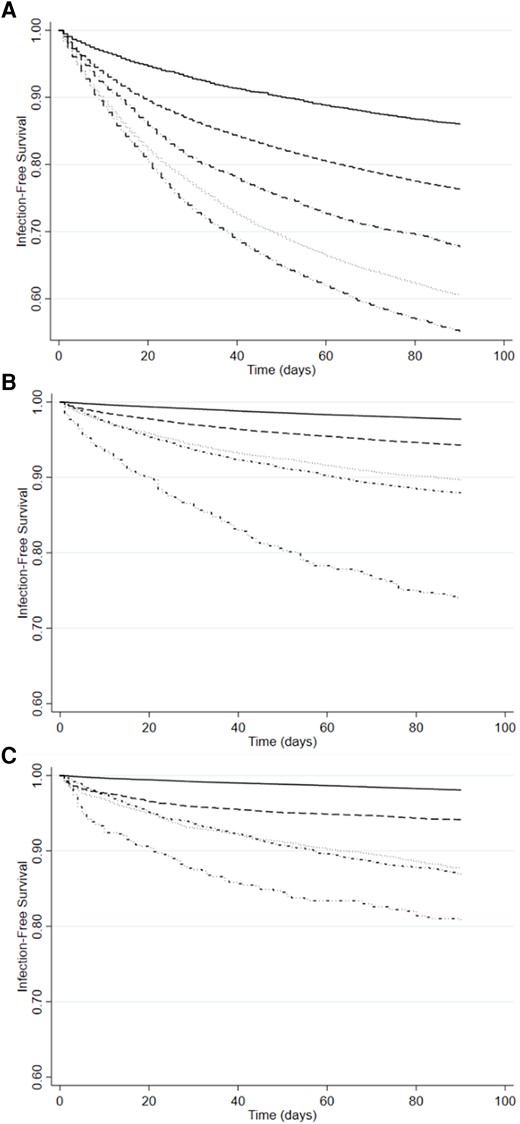
The characteristics of CDI cases and uninfected controls for the septicemia and UTI analyses are shown in Tables 1 and 2 (with complete results in Supplementary Tables 2 and 3). In all 3 populations, CDI cases were more than 60% female. In the Medicare analyses, more than 85% of both the CDI cases and controls were White race, whereas 59% of the younger Medicaid CDI case patients and 53% of the control patients were White race. More CDI case patients in all 3 patient populations developed septicemia within 90 days after the onset date compared to control uninfected patients (17.0% vs. 3.7% in the Medicare, 13.8% vs. 2.1% in the younger Medicaid, and 7.5% vs. 0.6% more in the commercially insured younger population, respectively, Table 3). In addition, the time to diagnosis of septicemia was earlier in the CDI case compared to control patients in all 3 populations (Table 3, Figure 1). Although UTI was more common within 90 days in CDI cases compared to control uninfected persons, the increase was not as marked, ranging from 24.9% vs. 13.9% in Medicare CDI cases to 7.5% vs. 2.1% in younger commercially insured persons with CDI compared to control patients (Table 3). The median time to UTI was shorter in the CDI case compared to control patients (Table 3, Figure 2).

Time to Septicemia after Clostridioides difficile infection (CDI) onset date in the Medicare, MarketScan Commercial, and MarketScan Medicaid Populations by CDI Surveillance Definition. (A) Medicare, (B) MarketScan Commercial, and (C) MarketScan Medicaid. _______, control uninfected; - - - - - -, community-associated CDI; ·············, healthcare facility-associated CDI; ·∼·∼·∼·∼·∼, hospital-onset CDI; ··−··−··−··−··−, other healthcare facility onset.
Time to urinary tract infection in the Medicare, MarketScan Commercial, and MarketScan Medicaid Populations by CDI Surveillance Definition. (A) Medicare, (B) MarketScan Commercial, (C) and MarketScan Medicaid. _______, control uninfected; - - - - - -, community-associated CDI; ·············, healthcare facility-associated CDI; ·∼·∼·∼·∼·∼, hospital-onset CDI; ··−··−··−··−··−, other healthcare facility onset.
Characteristics of Persons With and Without CDI for the Septicemia Cohort
| Population | Medicare 65 Years and Older | Commercially Insured 25–64 Years | Medicaid 25–64 Years | |||
|---|---|---|---|---|---|---|
| Characteristic | CDI Case N = 40 270 | Control N = 200 685 | CDI Case N = 61 445 | Control N = 273 895 | CDI Case N = 12 378 | Control N = 61 492 |
| Age, median (IQR) | 80 (73–87) | 80 (73–86) | 53 (43–59) | 53 (44–59) | 49 (37–57) | 50 (38–57) |
| Female sex | 27 163 (67.5) | 123 950 (61.8) | 38 919 (63.3) | 154 902 (56.6) | 8399 (67.9) | 37 692 (61.3) |
| White Race | 36 048 (89.5) | 173 710 (86.6) | N/A | N/A | 7330 (59.2) | 32 708 (53.2) |
| Black Race | 2637 (6.5) | 17 310 (8.6) | N/A | N/A | 3094 (25.0) | 18 063 (29.4) |
| Other/Unknown Race | 1585 (3.9) | 9665 (4.8) | N/A | N/A | 1954 (15.8) | 10 721 (17.4) |
| Dual Medicaid/Medicare Status | 11 458 (28.5) | 53 056 (26.4) | … | … | … | … |
| Death Within 90 Days of CDI Onset | 7415 (18.4) | 25 819 (12.9) | N/A | N/A | N/A | N/A |
Abbreviations: CDI, Clostridioides difficile infection; IQR, interquartile range; N/A, not available.
Characteristics of Persons With and Without CDI for the Urinary Tract Infection Cohort
| Population | Medicare 65 Years and Older | Commercially Insured 25–64 Years | Medicaid 25–64 Years | |||
|---|---|---|---|---|---|---|
| Characteristic | CDI Case N = 31 061 | Control N = 187 308 | CDI Case N = 62 292 | Control N = 271 779 | CDI Case N = 13 665 | Control N = 61 687 |
| Age, median (IQR) | 79 (72–86) | 79 (72–86) | 53 (43–59) | 53 (44–59) | 49 (38–57) | 50 (38–57) |
| Female sex | 19 494 (62.8) | 112 554 (60.1) | 37 757 (60.6) | 152 354 (56.1) | 8551 (62.6) | 37 434 (60.7) |
| White Race | 27 561 (88.7) | 161 677 (86.3) | N/A | N/A | 8062 (59.0) | 32 909 (53.3) |
| Black Race | 2175 (7.0) | 16 343 (8.7) | N/A | N/A | 3491 (25.5) | 18 037 (29.2) |
| Other/Unknown Race | 1325 (4.3) | 9288 (5.0) | N/A | N/A | 2112 (15.5) | 10 741 (17.4) |
| Dual Medicaid Status | 8356 (26.9) | 47 997 (25.6) | … | … | … | … |
| Death within 90 days of CDI onset | 5280 (17.0) | 23 148 (12.4) | N/A | N/A | N/A | N/A |
Abbreviations: CDI, Clostridioides difficile infection; IQR, interquartile range; N/A, not available.
Number and Percentage of Persons With Septicemia and UTI in the Medicare, MarketScan Commercial, and MarketScan Medicaid Populations by CDI Surveillance Definition
| Cohort | No. With Septicemia/Total No. in CDI Surveillance Category (%Within CDI Surveillance Category) | No. With Urinary Tract Infection/Total No. in CDI Surveillance Category (%Within CDI Surveillance Category) | ||||
|---|---|---|---|---|---|---|
| Population | Medicare 65 Years and Older | Commercially Insured 25–64 Years | Medicaid Insured 25–64 Years | Medicare 65 Years and Older | Commercially Insured 25–64 Years | Medicaid 25–64 Years |
| Control Uninfected | 7483/200 685 (3.7) | 1625/273 895 (0.6%) | 1270/61 492 (2.1%) | 25 945/187 308 (13.9%) | 5576/271 779 (2.1) | 1103/61 687 (1.8) |
| Median days to infection (IQR) | 25 (9–51) | 27 (9–54) | 32 (11–59) | 27 (10–53) | 37 (16–60) | 36 (15–64) |
| CDI Patients | ||||||
| Community-associated CDI | 302/7984 (3.8) | 1782/41 233 (4.3) | 497/6004 (8.3) | 940/6667 (14.1) | 2217/40 094 (5.5) | 337/6105 (5.5) |
| Healthcare Facility Associated CDI | 639/4473 (14.3) | 1413/11 557 (12.2) | 606/3379 (17.9) | 884/3581 (24.7) | 1154/11 610 (9.9) | 405/3528 (11.5) |
| Other health facility onset CDI | 1414/9966 (14.2) | 218/888 (24.6) | 149/636 (23.4) | 2226/6944 (32.1) | 193/797 (24.2) | 122/673 (18.1) |
| Hospital-onset CDI | 4504/17 847 (25.2) | 1216/7767 (15.7) | 460/2359 (19.5) | 3670/13 869 (26.5) | 1091/9791 (11.1) | 379/3359 (11.3) |
| Total with CDI | 6859/40 270 (17.0) | 4629/61 445 (7.5) | 1712/12 378 (13.8) | 7720/31 061 (24.9) | 4655/62 292 (7.5) | 1243/13 665 (9.1) |
| Median days to infection (IQR) | 8 (1–29) | 12 (2–33) | 13 (3–37) | 18 (4–42) | 26 (10–52) | 22 (7–47) |
Abbreviations: CDI, Clostridioides difficile infection; IQR, interquartile range; UTI, urinary tract infection.
The CDI case status of all patients with septicemia and with UTI by insurance population is shown in Table 3. In the Medicare population, of those with HO CDI, 25% developed septicemia within 90 days of CDI. In the HCFA and OHFO CDI case groups approximately 14% developed septicemia, whereas septicemia occurred in 3.8% of those with CA CDI. In the commercially and Medicaid insured populations, septicemia occurred in 25% and 23% of those with OHFO CDI, respectively, and in 16% and 20% of those with HO CDI, respectively. Septicemia occurred in a higher percentage of those with CA and HCFA CDI insured by Medicaid compared with those commercially insured (8% and 18% for Medicaid, 4% and 12% in the commercial population, respectively).
In the Medicare population, UTI was most common in those with OHFO CDI (32%), followed by HO (26%) and HCFA (25%) CDI. Approximately 14% of persons with CA CDI developed UTI within 90 days of CDI onset in the Medicare population, whereas 5.5% of those with CA CDI in both the younger commercially and Medicaid insured populations developed UTI within 90 days. Ten to eleven percent of the younger commercially and Medicaid insured populations with HO and HCFA CDI developed UTI, whereas 24% of the commercially insured and 18% of the Medicaid insured populations with OHFO CDI developed UTI (Table 3).
In the Medicare population, CDI case patients who developed septicemia were significantly more likely to die within 180 days than CDI patients who did not develop septicemia (3403 of 6859 [49.7%] versus 6425 of 33 411 [19.2%], respectively, log-rank P < .001) (Supplementary Figure 3A). The CDI case patients with UTI were also significantly more likely to die within 180 days than CDI patients without UTI (2441 of 7720 [31.6%] versus 4697 of 23 341 [20.1%], log-rank P < .001), although the mortality difference was not as dramatic as for septicemia and the curves crossed in the mortality plot (Supplementary Figure 3B).
In multivariable analysis controlling for a wide range of comorbidities, prior infections, and acute noninfectious conditions, HO CDI was associated with highest risk of 90-day septicemia compared to uninfected persons in all 3 populations. In the Medicare population, HO CDI was associated with 6-fold increased risk of septicemia (hazard ratio [HR] 6.6), and CA CDI with slightly increased risk (HR 1.3), whereas OHFO and HCFA CDI were associated with 2.5- and 3-fold increased risk of septicemia. The HRs for septicemia were higher in the commercially insured population, ranging from 7.2 for CA CDI to 11.1 for HO CDI. In the Medicaid population, the HRs for septicemia were similar across the CDI surveillance categories, ranging from 4.1 for OHFO CDI to 5.5 for HO CDI (Table 4, complete results in Supplementary Table 4). Other important independent risk factors for septicemia were having had septicemia in the prior 31–90 days before the onset date (CDI for cases, quasi-onset data for controls), other infections in the prior 90 days (eg, pneumonia, UTI), metastatic cancer, and decubitus ulcer in the prior year.
Multivariable Analysis of Risk Factors for Septicemia Within 90 Days After CDI Onseta
| Population | Medicare 65 Years and Older | Commercially Insured 25–64 Years | Medicaid Insured 25–64 Years | ||||||
|---|---|---|---|---|---|---|---|---|---|
| Risk Factor | HR | 95% CI | P | HR | 95% CI | P | HR | 95% CI | P |
| CDI surveillance definition | |||||||||
| No CDI | Reference | Reference | Reference | ||||||
| Hospital onset | 6.62 | 6.37–6.88 | <.001 | 11.13 | 10.24–12.10 | <.001 | 5.45 | 4.85–6.13 | <.001 |
| Other facility onset | 2.46 | 2.32–2.61 | <.001 | 9.24 | 7.93–10.82 | <.001 | 4.06 | 3.37–4.89 | <.001 |
| Healthcare facility associated | 2.99 | 2.76–3.25 | <.001 | 9.00 | 8.30–9.76 | <.001 | 5.05 | 4.52–5.64 | <.001 |
| Community associated | 1.32 | 1.17–1.48 | <.001 | 7.18 | 6.71–7.69 | <.001 | 4.53 | 4.08–5.04 | <.001 |
| White race | 0.87 | 0.83–0.91 | <.001 | N/A | … | … | 1.04 | 0.97–1.12 | .31 |
| Female sex | 0.80 | 0.77–0.83 | <.001 | 0.86 | 0.82–0.91 | < .001 | 0.84 | 0.78–0.91 | <.001 |
| Intraabdominal infection | 0.95 | 0.91–1.00 | .05 | 1.09 | 1.02–1.18 | .018 | 1.05 | 0.93–1.19 | .42 |
| Organ abscess/CNS infection in the prior 90 days | 1.26 | 1.07–1.50 | .006 | 1.31 | 1.09–1.56 | .003 | 1.49 | 1.06–2.08 | .021 |
| Pneumonia in the prior 90 days | 1.29 | 1.24–1.34 | <.001 | 1.41 | 1.31–1.52 | <.001 | 1.37 | 1.24–1.51 | <.001 |
| Septicemia in the prior 31–90 days | 1.61 | 1.51–1.71 | <.001 | 1.51 | 1.37–1.66 | <.001 | 1.42 | 1.25–1.62 | <.001 |
| Surgical site infection in the prior 90 days | 1.16 | 1.06–1.27 | .001 | 1.16 | 1.03–1.30 | .012 | 1.19 | 0.99–1.44 | .06 |
| Skin and soft tissue infection in the prior 90 days | 1.15 | 1.10–1.20 | <.001 | 1.19 | 1.11–1.28 | <.001 | 1.14 | 1.03–1.26 | .013 |
| Urinary tract infection in the prior 90 days | 1.47 | 1.41–1.53 | <.001 | 1.26 | 1.14–1.41 | <.001 | 1.20 | 1.01–1.42 | .034 |
| Decubitus ulcer | 1.41 | 1.35–1.48 | <.001 | 1.42 | 1.28–1.58 | <.001 | 1.71 | 1.51–1.94 | <.001 |
| Delirium | 1.11 | 1.07–1.16 | <.001 | 1.03 | 0.91–1.15 | .67 | 0.94 | 0.82–1.08 | .36 |
| Dementia | 1.20 | 1.14–1.25 | <.001 | 1.30 | 1.06–1.60 | .011 | 1.18 | 0.98–1.43 | .09 |
Abbreviations: CDI, Clostridioides difficile infection; CI, confidence interval; CNS, central nervous system; HR, hazards ratio; IQR, interquartile range.
Adjusted for comorbidities and additional acute infections and noninfectious conditions. See Supplementary Table 4 for complete model results.
Clostridioides difficile infection was associated with significantly increased risk of UTI within 90 days of CDI onset, with HRs ranging from 1.3 in those with CA CDI to 2.1 in those with HO CDI in the Medicare population. The risks of UTI were higher in the commercially insured population (ranging from HR of 2.4 in those with CA CDI to 3.8 in those with OHFO CDI) and even higher in the younger Medicaid population (HR of 3.2 in those with CA CDI to 3.9 in those with HO CDI). Other important independent risk factors for UTI were having had UTI in the prior 31–90 days before the onset date (HR ranging from 2.2 to 2.9 in the 3 insured populations), female sex, prior solid organ transplant, urinary incontinence in the prior year, and paralysis, particularly in the commercial and Medicaid insured populations (Table 5, complete results in Supplementary Table 5).
Multivariable Analysis of Risk Factors for UTI Within 90 Days After CDI Onseta
| Population | Medicare 65 Years and Older | Commercially Insured 25–64 Years | Medicaid Insured 25–64 Years | ||||||
|---|---|---|---|---|---|---|---|---|---|
| Risk Factor | HR | 95% CI | P | HR | 95% CI | P | HR | 95% CI | P |
| CDI surveillance definition | |||||||||
| No CDI | Reference | … | … | Reference | … | … | Reference | … | … |
| Hospital-onset | 2.14 | 2.06–2.21 | <.001 | 3.19 | 2.96–3.44 | <.001 | 3.94 | 3.44–4.51 | <.001 |
| Other facility onset | 1.71 | 1.63–1.79 | <.001 | 3.78 | 3.24–4.42 | <.001 | 3.63 | 2.95–4.45 | <.001 |
| Healthcare facility associated | 1.78 | 1.66–1.90 | <.001 | 2.66 | 2.48–2.86 | <.001 | 3.95 | 3.47–4.49 | <.001 |
| Community associated | 1.27 | 1.19–1.36 | <.001 | 2.37 | 2.25–2.49 | <.001 | 3.15 | 2.78–3.57 | <.001 |
| White race | 1.15 | 1.11–1.19 | <.001 | N/A | … | … | 1.10 | 1.01–1.20 | .030 |
| Female sex | 1.56 | 1.52–1.60 | <.001 | 2.31 | 2.21–2.42 | < .001 | 1.72 | 1.56–1.89 | <.001 |
| Dual Medicaid enrollment | 1.14 | 1.12–1.17 | <.001 | N/A | … | … | N/A | … | … |
| Pelvic infection | 1.34 | 1.19–1.50 | <.001 | 1.54 | 1.37–1.73 | <.001 | 1.29 | 1.02–1.62 | .035 |
| Septicemia in the prior 90 days | 1.31 | 1.26–1.36 | <.001 | 1.27 | 1.18–1.36 | <.001 | 1.03 | 0.91–1.17 | .63 |
| Urinary tract infection 31–90 days before index date | 2.71 | 2.58–2.84 | <.001 | 2.91 | 2.73–3.09 | <.001 | 2.16 | 1.88–2.47 | <.001 |
| Urinary incontinence | 1.35 | 1.31–1.39 | <.001 | 1.76 | 1.62–1.91 | <.001 | 1.38 | 1.21–1.57 | <.001 |
| Decubitus ulcer | 1.26 | 1.21–1.31 | <.001 | 1.34 | 1.21–1.49 | <.001 | 1.92 | 1.68–2.20 | <.001 |
| Delirium | 1.17 | 1.13–1.21 | <.001 | 1.17 | 1.05–1.29 | .003 | 1.16 | 1.01–1.34 | .039 |
| Dementia | 1.21 | 1.17–1.24 | <.001 | 1.30 | 1.10–1.55 | .003 | 1.25 | 1.03–1.52 | .07 |
| Solid organ transplant | 1.44 | 1.26–1.65 | <.001 | 1.42 | 1.23–1.63 | <.001 | 1.51 | 1.04–2.21 | .031 |
Abbreviations: CDI, Clostridioides difficile infection; CI, confidence interval; CNS, central nervous system; HR, hazard ratio; IQR, interquartile range; N/A, not applicable.
Adjusted for comorbidities and additional acute infections and noninfectious conditions. See Supplementary Table 5 for complete model results.
DISCUSSION
In this study of septicemia and UTI within 90 days after onset of CDI, we found that the incidence of septicemia was (1) highest in the elderly with HO CDI and (2) slightly lower in younger commercially and Medicaid-insured adults with CDI onset in other healthcare facilities (eg, rehabilitation, skilled nursing, long-term care). In contrast, the incidence of 90-day UTI was highest in both elderly and younger adults with OHFO CDI. The incidence of UTI in the elderly remained high (14%) in those with CA CDI, whereas the incidence of UTI in younger commercially or Medicaid-insured individuals with CA CDI was much lower (5.5% for both). In all populations, the risk of septicemia was highest in those with HO CDI compared to uninfected control persons, after controlling for a wide range of risk factors for septicemia. In contrast, the risk of 90-day UTI was not substantially different across the CDI surveillance definitions, after controlling for other risk factors for UTI. Not surprisingly, risk of 90-day UTI in all populations was also associated with having a history of UTI within 31–90 days before the onset date.
Other investigators have previously reported on the incidence of BSI/septicemia, including candidemia, in patients with CDI [8–10, 13, 16]. In a retrospective study from one hospital in Rome, 72 of 393 (18.3%) patients with CDI during a hospitalization developed primary BSI after CDI [10]. Length of hospital stay, intensive care unit transfer, and 30-day and in-hospital mortality were higher in CDI patients with BSI compared with hospitalized patients with CDI without subsequent BSI. The most common etiologies of BSI following CDI in that study were consistent with gastrointestinal flora, including Candida albicans, members of the Enterobacterales family, Enterococcus species, and Candida glabrata. Risk factors for BSI after CDI included C difficile ribotype 027, CDI recurrence, severe CDI infection, and treatment with high-dose oral vancomycin (possibly also a marker of severe CDI) [10]. Similarly, we found that patients with septicemia after CDI were at much higher risk of mortality within 180 days than CDI patients without septicemia, with unadjusted mortality in the elderly septicemia patients of 50%.
In contrast, Ulrich et al [11] did not find increased risk of BSI after a new episode of CDI in a retrospective cohort of hospitalized patients with stool tests for toxigenic C difficile. In that study, 36 of 570 (6.3%) of those with CDI had a BSI from 48 hours before the first positive CDI test through hospital discharge, whereas 50 of 562 (8.9%) persons who tested negative for CDI had a BSI in the same time frame. The use of a test-negative comparison population complicates the interpretation of results. Testing for C difficile may have been done as part of a general work-up due to concern for infection, and, as such, the incidence of BSI may have been higher among those without CDI because the cause of infection ultimately was the BSI and not CDI. In addition, the control CDI-negative patient population in the Ulrich et al [11] study had high acuity of illness likely resulting in higher BSI risk, with almost 50% immunosuppressed and having a central venous catheter.
Feuerstadt et al [28] used commercial claims data and a combination of ICD-9/-10 diagnosis codes for clinical sepsis and septicemia to identify sepsis within 12 months after CDI in nonelderly adults. Feuerstadt et al. found that sepsis rates increased in persons with rCDI compared with only a single episode of CDI, but they did not compare this to sepsis rates in persons without CDI. Bednarska et al [29] identified sepsis using ICD-10 diagnosis codes in patients hospitalized with a first occurrence of CDI in one hospital in Poland. They found that sepsis was independently associated with 4-fold increased risk of death during the CDI admission, but they did not distinguish between sepsis before versus after CDI [29].
Other studies using observational data have primarily focused on BSI in patients with rCDI, in contrast to our study of septicemia and UTI after an initial episode of CDI (requiring a minimum of 12 months prior without coding for CDI). Ianiro et al [30] identified BSI after rCDI in 290 patients at a single Italian medical center. More patients developed BSI within 90 days after antibiotic (22.1%) compared with fecal microbiota treatment (4.6%). Our finding of septicemia within 90 days in 25% of elderly patients with HO CDI is very similar to the 22% BSI rate in the largely elderly population treated with antibiotics in the Ianiro et al [30] study.
The origin of microorganisms associated with BSI after CDI is thought to be due to depletion of protective anaerobic bacteria in the gut microbiota, resulting in overgrowth and subsequent translocation of pathogens into the blood. Oliva et al [12] recently found biomarkers of microbial translocation in plasma from patients with CDI collected at the onset of CDI therapy, compared to control patients, in particular, high levels of lipopolysaccharide binding protein, and low levels of anti-endotoxin core antibody immunoglobulin M. In addition, intestinal damage by C difficile toxins also likely facilitates the passage of gastrointestinal flora into the blood in patients with CDI [15]. Our finding that hospital-onset CDI was associated with highest risk of septicemia is consistent with the role of intestinal damage and mediation of translocation of microorganisms into the blood by more severe CDI. The risk of UTI was somewhat less variable across the CDI surveillance definitions, suggesting that CDI severity may not be central to the pathogenesis of UTI in these patients. This finding is consistent with the speculation that gut dysbiosis, due directly to CDI or resulting from prior antibiotic treatment, results in selection of uropathogenic bacteria, because gut dysbiosis is thought to underpin most cases of CDI.
Strengths of our study include (1) the use of data from very large populations of elderly and younger adults and (2) analysis of the incidence of septicemia and urinary tract infection by CDI surveillance definition, including those diagnosed and treated in the outpatient setting. Most prior studies of BSI after CDI have been performed in patients diagnosed with CDI during a hospitalization. Unlike the study by Feuerstadt et al [28] using claims data, we excluded CDI case and control patients with septicemia in the 30 days before the CDI (or quasi) onset date to increase the likelihood of identifying new onset septicemia. Similarly, we excluded cases and controls with UTI in the 30 days before onset of UTI for the 90-day UTI analyses.
Limitations of our study include identification of CDI and confounding variables by ICD-9/-10 codes, resulting in potential misclassification. The proportion of females was slightly higher in all 3 insurer cohorts in the CDI cases than in controls. Because females are well known to have increased risk of UTI, we controlled for sex in the multivariable analyses. We did not attempt to distinguish between septicemia caused by bacteria compared with Candida species, and we may have underestimated the incidence of candidemia because a specific diagnosis code does not exist for this infection. Because we used data for elderly persons with only fee-for-service Medicare coverage, our results are not generalizable to those in managed care plans. The increasing use of nucleic acid amplification tests in the later years of our study may have resulted in overidentification of persons with CDI. Our finding of increasing incidence and risk of septicemia by surveillance definition suggests that false-positive coding for CDI in later years had minimal impact, because it would have the effect of attenuating the risk of septicemia associated with CDI.
CONCLUSIONS
We found that the incidence of septicemia and UTI were significantly higher in persons with CDI compared with control patients without CDI. The incidence of septicemia was highest in elderly persons with HO CDI and highest in younger commercially and Medicaid-insured adults with CDI onset in other healthcare facilities. The incidence of UTI was highest in all 3 populations in persons with OHFO CDI. In all 3 populations, the incidence of septicemia and UTI was lowest in those with CA CDI. The risk of septicemia and UTI was more uniform in younger Medicaid insured persons with CDI by surveillance definition. These findings emphasize the need for new strategies to prevent CDI in both the elderly and younger adults, to avoid morbidity and the significant mortality associated with infectious complications of CDI.
Supplementary Data
Supplementary materials are available at Open Forum Infectious Diseases online. Consisting of data provided by the authors to benefit the reader, the posted materials are not copyedited and are the sole responsibility of the authors, so questions or comments should be addressed to the corresponding author.
Acknowledgments
Financial support. This work was supported by a research grant from Pfizer, Inc. Access to data and additional services were provided by the Washington University Center for Administrative Data Research, supported in part by Grant UL1 TR002345 from the National Center for Advancing Translational Sciences of the National Institutes for Health.
References
Author notes
Potential conflicts of interest. The sponsor participated in study design, interpretation of the data, and final review of the manuscript. MAO reports personal fees from Pfizer for consulting work. ERD reports receipt of grant funding from Pfizer, Synthetic Biologics, and Ferring in the past 36 months and personal fees from Ferring, Rebiotix, Summit, Merck, Pfizer, and Seres. HY is an employee of Pfizer, Inc. and has stock or stock options for Pfizer. DS reports stock or stock options from AbbVie, Inc., and Bristol-Myers Squibb. Conflicts that the editors consider relevant to the content of the manuscript have been disclosed.


Comments