


Abstract
Presymptomatic plasma samples from 1596 donors reporting coronavirus disease 2019 infection or symptoms after blood donation were tested for severe acute respiratory syndrome coronavirus 2 (SARS-CoV-2) RNA and anti-S and anti-N antibodies. Prior infection and vaccination both protected from developing SARS-CoV-2 RNAemia and from symptomatic infection. RNAemia rates did not differ in the Delta and Omicron variant eras.
Strict protocols and testing are in place to ensure the safety of the blood supply. One mechanism that blood collection centers use to interdict potentially infectious blood products is to encourage blood donors to inform the center if they develop a fever or flu-like symptoms or are diagnosed with an infection after blood donation. These donors’ blood products can be removed from inventory, thereby potentially enhancing transfusion safety. Access to these quarantined blood products presents an opportunity to study infectious diseases using samples obtained during the presymptomatic phase of infection. Similar samples from paid plasma donors have allowed insight to the viral and immune dynamics of multiple viral infections, including HIV and hepatitis B and C [1–3].
We previously reported that severe acute respiratory syndrome coronavirus 2 (SARS-CoV-2) RNA was detected in the plasma of up to 15% of blood donors during their presymptomatic phase of infection [4]. In that study, the rate of RNAemia fell with the widespread introduction of vaccines. In the current study, we surveyed blood donors who reported symptoms consistent with coronavirus disease 2019 (COVID-19) ≤7 days or diagnosis of COVID-19 ≤14 days after blood donation from the period August 2021 through February 2022, which spans the Delta- and Omicron-predominant transmission waves. Detailed serology and symptom questionnaires were used to answer questions about how vaccination protected from development of symptoms, whether vaccination or seropositivity to SARS-CoV-2 spike (S) or nucleocapsid (N) proteins protected from development of RNAemia, and whether the Omicron variant behaved differently from the Delta variant in its propensity to cause RNAemia.
METHODS
Study Participants and Data Collection
The study population included blood donors who reported a COVID-19 diagnosis or positive diagnostic test within 14 days of donation and those who reported ≥2 potential COVID-19 symptoms within 7 days of donation. These symptoms were fever, cough, shortness of breath or difficulty breathing, chills, muscle pain, headache, sore throat, new loss of taste or smell, weakness or fatigue, diarrhea, nausea and/or vomiting, and new skin rash. Plasma components from donations were tested for viral RNA and serology.
Patient Consent
The study was approved by the Vanderbilt University IRB. Because blood centers routinely collect postdonation information (PDI) as part of their operating procedures, informed consent was not required.
SARS-CoV-2 RNA and Antibody Detection
Plasma samples were tested for SARS-CoV-2 RNA using the Grifols Procleix SARS-CoV-2 transcription-mediated amplification (TMA) qualitative assay (50% LOD 2.46 copies/mL). Initially RNA-reactive samples were retested in 11 replicates and considered RNA repeat-reactive based on TMA reactivity in ≥1 of 11 replicates. Serial dilutions from 56 to 1.25 gEq/mL of heat-inactivated SARS-CoV-2 were used to estimate viral loads [4].
All samples were tested for anti-SARS-CoV-2 antibody using chemiluminescent immunoassays for antispike (Ortho VITROS Immunodiagnostic Products Anti-SARS-CoV-2 Total Ig) or antinucleocapsid antibodies (VITROS Immunodiagnostic Products Anti-SARS-CoV-2 Total N or Elecsys Anti-SARS-CoV-2). Total immunoglobulin (Ig) assays were selected as the antibody signal detected over time postinfection remains relatively stable compared with IgG-only assays, making the total Ig assay format more suitable for seroepidemiology studies [5, 6].
Statistics
Analyses were performed using SAS, version 9.4. All statistical tests were based on 2-tailed hypotheses. Differences were considered significant at a P value <.05. Comparisons of subgroups (ie, RNAemic donors vs non-RNAemic donors) were done using chi-square statistics for categorical responses (eg, seropositive vs seronegative).
RESULTS
Study Participant Characteristics
Donors were identified through 4 blood collection organizations, the American Red Cross, Vitalant, the New York Blood Center, and Bloodworks Northwest. From August 2021 through February 2022, 1897 donors reported COVID-19 PDI, and we had a retained sample available to test 1596 plasma units (Supplementary Figure 1). The mean time between blood donation and reporting COVID-19 PDI was 4.2 days (±7.7) for those who did not have SARS-CoV-2 RNAemia and 3.0 days (±1.8) for those with RNAemia (P < .0001).
Majority of PDI Blood Donors Were Vaccinated and Previously Uninfected
A plasma unit was tested for 1596 blood donors who reported potential COVID-19 PDI (Supplementary Figure 1). Given that the sample was acquired before the onset of COVID-19 symptoms, we interpreted detected antibodies as having been present before the current SARS-CoV-2 infection episode. Plasma samples with isolated anti-S antibodies were consistent with prior vaccination, and those with anti-S and anti-N antibodies were indicative of prior SARS-CoV-2 infection (with or without vaccination). Our prior study of SARS-CoV-2-infected blood donors sampled nrgotr the widespread availability of vaccines revealed that almost all were seronegative at presentation [4], supporting our proposed interpretation of the current data. The majority (74%) of the current study participants with confirmed COVID-19 had detectable anti-S without anti-N antibodies at presentation, consistent with a history of vaccination but no prior SARS-CoV-2 infection (Figure 1A); this was consistent with the proportion of donors who reported prior vaccination on the donor history questionnaire (76%).
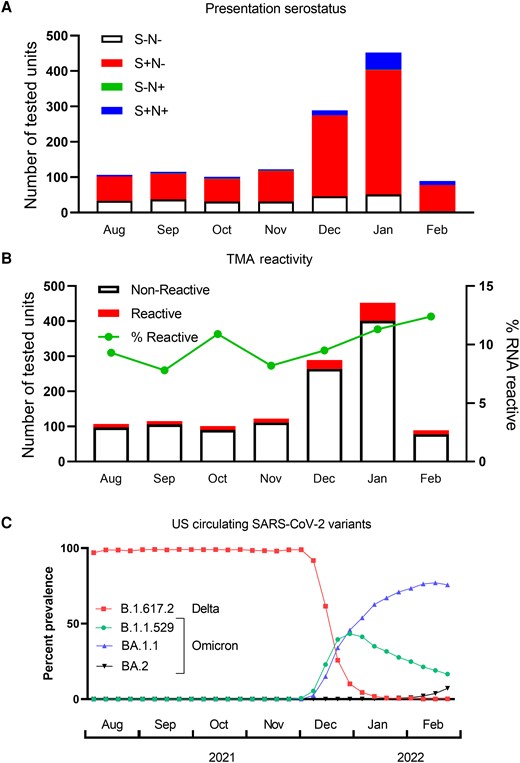
Plasma antibody and viral RNA reactivity rates. A, Donors were classified by antibody responses at the time of donation as naïve (S−N−, n = 233), vaccinated but uninfected (S+N−, n = 948), previously infected +/− vaccination (S+N+, n = 90), and isolated anti-N consistent with prior infection and S seroreversion or false-positive anti-N antibodies (S−N+, n = 4). B, Total bar height represents the number of units tested each month, and the red portion of the bar the number of positive TMA tests. The rate of RNAemia among PDI donors is shown in the green line. C, Data from the CDC Variant Tracker website were used to calculate the frequency of variants circulating in the United States. Variants present at ≥1% of reported sequences during the study period are included on the graph. Abbreviations: CDC, Centers for Disease Control and Prevention; PDI, postdonation information; SARS-CoV-2, severe acute respiratory syndrome coronavirus 2; TMA, transcription-mediated amplification.
Blood Donor Infection Rate and Detection of Plasma SARS-CoV-2 RNA
A sensitive TMA assay was used to detect SARS-CoV-2 RNA in plasma samples, with initially reactive samples tested in 11 subsequent replicates. The rate of detectable RNAemia ranged from 7.8% to 12.4% of samples tested each month (mean, 11.1%) (Figure 1B). The mean estimated viral load of the 127 plasma units with detectable SARS-CoV-2 RNA was 10 gEq/mL, and the maximum was 109 gEq/mL. During the course of the study, the Delta variant was predominant from August to November 2021, then the Omicron variant rapidly displaced the circulating strain by January 2022 (Figure 1C) [7]. Consistent with its higher transmissibility and rapid spread, the rate of donors reporting COVID-19 PDI spiked with the emergence of the Omicron variant in December 2021. The rate of RNAemia averaged 10.2% during the Delta variant–predominant months and was 12.9% during January and February 2022 when the Omicron variant predominated; these rates were not significantly different (P = .25). None of the 94 donors with anti-N antibodies at the time of donation developed RNAemia. The rate of RNAemia was more common in unvaccinated compared with previously vaccinated donors (15% vs 8.7%; P = .0024). Similarly, 32% of RNAemic participants lacked detectable anti-S antibodies, whereas only 17% of non-RNAemic donors lacked anti-S antibodies (P < .0001).
Association of RNAemia and Prior Vaccination With Symptom Prevalence
Donors with RNAemia developed symptoms sooner after donation than those without RNAemia (mean, 1.2 vs 2.3 days; P < .0001) (Supplementary Figure 2). We found that most symptoms were more prevalent in those who were not vaccinated or infected before the most recent SARS-CoV-2 infection leading to PDI reporting. Headache, muscle and body aches, malaise, fever, chills, nausea and/or vomiting, and diarrhea were all significantly more common in unvaccinated compared with vaccinated participants, and fever and muscle and body aches were more common in those with no prior infection compared with those with prior infection history (Table 1).
Association Between COVID-19-Related Symptoms and Preinfection Vaccination Status
| Vaccinated Before Donation (n = 976) | Not Vaccinated Before Donation (n = 282) | Previously Infected (Anti-N+) (n = 92) | Not Previously Infected (Anti-N−) (n = 1166) | |||
|---|---|---|---|---|---|---|
| Presence of Symptoms up to 7 Days Post–Blood Donation | No. (%) | No. (%) | P Value | No. (%) | No. (%) | P Value |
| Cough | 573 (59) | 159 (56) | .49 | 46 (50) | 686 (59) | .098 |
| Headache | 425 (44) | 147 (52) | .011 | 33 (36) | 539 (46) | .055 |
| Muscle/body aches | 379 (39) | 152 (54) | <.0001 | 28 (30) | 503 (43) | .018 |
| Weakness/fatigue (malaise) | 396 (41) | 134 (48) | .038 | 34 (37) | 496 (42) | .30 |
| Sore throat | 416 (43) | 85 (30) | .0002 | 38 (41) | 463 (40) | .76 |
| Fever | 293 (30) | 130 (46) | <.0001 | 16 (17) | 407 (35) | .0006 |
| Chills | 276 (28) | 114 (40) | .0001 | 21 (23) | 369 (32) | .078 |
| Change in taste or smell | 111 (11) | 37 (13) | .42 | 7 (7.6) | 141 (12) | .20 |
| Shortness of breath/painful breathing | 73 (7.5) | 22 (7.8) | .86 | 4 (4.4) | 91 (7.8) | .23 |
| Diarrhea | 58 (5.9) | 27 (9.6) | .032 | 6 (6.5) | 79 (6.7) | .93 |
| Nausea and/or vomiting | 50 (5.1) | 24 (8.5) | .033 | 9 (9.8) | 65 (5.6) | .10 |
| New rash (unrelated to phlebotomy site) | 4 (0.4) | 1 (0.4) | 1.0 | 0 (0.0) | 5 (0.4) | 1.0 |
| Symptom count | .0079 | .0004 | ||||
| 0 | 154 (16) | 41 (14) | 27 (29) | 168 (14) | ||
| 1–3 | 416 (43) | 95 (34) | 36 (39) | 475 (41) | ||
| 4+ | 406 (42) | 146 (52) | 29 (32) | 523 (45) |
Significant P values indicated in bold.
DISCUSSION
We previously reported that the rate of RNAemia among presymptomatic blood donors fell concomitantly with the introduction of SARS-CoV-2 vaccines [4]. In this study, we investigated the effects of vaccination or prior infection on the development of RNAemia or symptoms. Of 1275 contemporary donors with confirmed COVID-19, 128 (10.0%) were RNAemic. None of the RNAemic donors had evidence of past infection as determined by the absence of anti-N antibodies, suggesting that prior infection was protective against development of RNAemia. Additionally, SARS-CoV-2 RNA was more frequently detected in plasma among unvaccinated compared with previously vaccinated donors (15% vs 8.7%; P = .0024), showing that vaccination conferred some protection from RNAemia. Similarly, we observed that headache, muscle and body aches, malaise, fever, chills, nausea and/or vomiting, and diarrhea were significantly more common in unvaccinated vs vaccinated donors. Fever and muscle and body aches were more common in those with no prior infection vs prior infection history.
Collection of postdonation information enables retrieval of potentially contaminated blood products, enhancing the safety of the blood supply. The mean time between donation and reporting of symptom and/or diagnosis was 4.2 days (±7.7) for non-RNAemic donors and 3.0 days (±1.8) for those with detectable RNAemia at the time of donation. The interval between donation and development of symptoms and PDI report was significantly shorter in donors who were RNAemic (P < .0001), indicating that RNAemic donors recognized their infection sooner and thus reported PDI earlier, which allowed timely retrieval of their RNAemic donation.
The association between SARS-CoV-2 RNAemia, disease severity, and mortality and peripheral markers of inflammation has been documented [8–12]. It is known that naive individuals are much more susceptible to severe disease than vaccinated individuals [13, 14]. The fact that RNAemia was less frequently detected in participants with preexisting antibody responses and that symptoms were more prevalent in donors who were not vaccinated or infected before PDI reporting suggests that naive individuals may be more susceptible to severe COVID-19 due to inability to prevent systemic dissemination of the virus. The duration of protection from RNAemia after infection or vaccination is not yet known. The data collected in this study, in addition to informing transfusion safety, demonstrate the protective effects of vaccination and prior SARS-CoV-2 infection on development of presymptomatic RNAemia and symptomatic disease.
Supplementary Data
Supplementary materials are available at Open Forum Infectious Diseases online. Consisting of data provided by the authors to benefit the reader, the posted materials are not copyedited and are the sole responsibility of the authors, so questions or comments should be addressed to the corresponding author.
Acknowledgments
Financial support. The authors were supported by research contracts and grants from the National Heart, Lung, and Blood Institute (NHLBI Contracts HHSN 75N92019D00032 [S.M.] and HHSN 75N92019D00033 [P.J.N.]) as well as with funding support from the National Institute of Allergies and Infectious Diseases (NIAID), NIH.
Author contributions. P.S., R.V.F., M.S., S.H.K., M.P.B., and P.J.N. planned experiments and analyzed data, L.M., C.D.G., R.L.T., J.V., H.D., and D.E.K. collected and analyzed data, D.J.W. analyzed data, T.N., H.K., S.L.S., D.A.K., B.R.S., and D.E.K. provided clinical samples and data, and P.S. and P.J.N. wrote the manuscript. All authors reviewed and approved the manuscript.
Disclaimer. The content is solely the responsibility of the authors and does not represent the policy of the National Institutes of Health or the Department of Health and Human Services.
References
Centers for Disease Control and Prevention.
Author notes
These authors contributed equally to the work.
Potential conflicts of interest. All authors: no reported conflicts.


Comments