


Abstract
We aimed to describe psittacosis pneumonia and risk factors for developing severe pneumonia in this multicenter clinical study.
We collected the data of psittacosis pneumonia cases diagnosed with metagenomic next-generation sequencing (mNGS) assay from April 2018 to April 2022 in 15 tertiary hospitals in China.
A total of 122 patients were enrolled; 50.0% had a definite history of bird exposure. In 81.2% of cases, onset happened in autumn or winter. The common symptoms were fever (99.2%), cough (63.1%), fatigue (52.5%), shortness of breath (50.0%), chills (37.7%), central nervous system symptoms (36.9%), myalgia (29.5%), and gastrointestinal tract symptoms (15.6%). Laboratory tests showed that >70% of cases had elevated C-reactive protein, procalcitonin, erythrocyte sedimentation rate, D-dimer, lactate dehydrogenase, and aspartate aminotransferase, and >50% had hyponatremia and hypoproteinemia. The most common imaging finding was consolidation (71.3%), and 42.6% of cases met the criteria for severe pneumonia. Age >65 years and male sex were the risk factors for severe pneumonia. The effective proportion of patients treated with tetracyclines was higher than that of fluoroquinolones (66/69 [95.7%] vs 18/58 [31.0%]; P < .001), and the median defervescence time was shorter. After medication adjustment when the diagnosis was clarified, 119 of 122 (97.5%) patients were finally cured and the other 3 (2.5%) died.
Psittacosis pneumonia has a high rate of severe disease. Proven diagnosis could be rapidly confirmed by mNGS. Tetracycline therapy had a rapid effect and a high cure rate.
Psittacosis pneumonia used to be considered an uncommon pulmonary infectious disease. It is becoming more common and accounts for about 1% of cases of community-acquired pneumonia (CAP) [1]. The main route of transmission is inhalation of aerosol contaminated by Chlamydia psittaci. Human-to-human transmission has also been reported [2, 3].
Because of the lack of efficient routine laboratory tests for C psittaci in the past, psittacosis pneumonia was rarely reported in clinical practice. Nowadays, with the application of polymerase chain reaction (PCR) or metagenomic next-generation sequencing (mNGS) [4, 5], reports of psittacosis pneumonia have rapidly increased [6–8]. Some patients have developed severe pneumonia and even multiple organ failure [9], which urges us rediscover psittacosis pneumonia.
Although some case reports or small-sample studies have reported the clinical characteristics of psittacosis pneumonia, the profile of this disease remains vague. Our study aimed to elucidate the clinical features, treatment, and outcome of psittacosis pneumonia through a multicenter real-world study. We also analyzed the differences in clinical manifestations and laboratory examinations between patients with severe and nonsevere disease, so as to facilitate the early identification of severe psittacosis pneumonia.
METHODS
Patients and Study Design
This multicenter real-world study reviewed hospitalized patients with psittacosis pneumonia from April 2018 to April 2022 in 15 tertiary teaching hospitals in China: Nanjing Jinling Hospital, Hunan Provincial People's Hospital, Southeast University Zhongda Hospital, Nanjing First Hospital, The Affiliated Jiangning Hospital of Nanjing Medical University, Jiangsu Province Hospital of Chinese Medicine, Nanjing Drum Tower Hospital, Affiliated Hospital of Integrated Traditional Chinese and Western Medicine Nanjing University of Chinese Medicine, The First Affiliated Hospital of Soochow University, The Second Hospital of Nanjing, Affiliated Hospital of Xuzhou Medical University, The First Affiliated Hospital of Nanjing Medical University, The Affiliated BenQ Hospital of Nanjing Medical University, The Affiliated Suqian Hospital of Xuzhou Medical University, and The Third Affiliated Hospital of Soochow University.
Criteria for Diagnosis and Grouping
Inclusion and Exclusion Criteria
Inclusion criteria were (1) age >18 years; (2) pneumonia symptoms with or without an exposure history to birds, poultry, or patients infected with psittacosis; and (3) confirmed psittacosis pneumonia via mNGS or PCR assay.
Patients with incomplete medical records were excluded.
Criteria of Severe Pneumonia
The validated definition of severe pneumonia includes either 1 major criterion or ≥3 minor criteria [10]. Major criteria were (1) respiratory failure with requirement of invasive mechanical ventilation and (2) septic shock with requirement of vasopressors. Minor criteria were (1) respiratory rate ≥30 breaths/minute; (2) oxygenation index ≤250 mm Hg; (3) multilobar infiltrates; (4) confusion/disorientation; (5) blood urea nitrogen level ≥7.14 mmol/L; and (6) systolic blood pressure <90 mm Hg with requirement of aggressive fluid resuscitation.
Criteria of Clinical Stability
Criteria of clinical stability [10] included satisfying all of the following: (1) temperature ≤37.8°C; (2) heart rate ≤100 beats/minute; (3) respiratory rate ≤24 breaths/minute; (4) systolic blood pressure ≥90 mm Hg; and (5) arterial oxygen saturation ≥90% or PaO2 ≥60 mm Hg on room air.
Definition of effective treatment: After 72 hours of antimicrobial treatment, the clinicians judged whether the patient had reached clinical stability or the symptoms and signs were significantly improved. If the patient had reached clinical stability or the symptoms and signs were significantly improved, the treatment could be regarded as effective.
Definition of failed treatment: After 72 hours of antibiotic treatment, the clinician determined that the patient's symptoms had not improved and treatment needed to be switched, the treatment had improved and then deteriorated, or the condition progressed, and thus the treatment was considered as failure.
Criteria of Time of Defervescence
Defervescence time of fluoroquinolones, tetracyclines, macrolides, and any combination of the above 3 categories were compared. Patients with axillary temperature <37.5 °C before treatment and treated with glucocorticoid or antipyretic drugs were excluded.
Data Collection of Epidemiology, Clinical Manifestation, Laboratory Results, and Clinical Outcome
Data were collected from the electronic or hard-copy medical records, including clinical manifestations, laboratory test results, and radiological images. The researchers also directly communicated with the patients or their family members to obtain their epidemiological data and detailed clinical information. Additional data on the treatment, response to treatment, outcomes, and any relevant follow-up data were also collected. Data of 53 patients were retrospectively collected and data of 69 patients were collected in real time.
Statistical Analysis
All data were statistically analyzed using SPSS version 26.0 software (IBM, Armonk, New York). The independent sample t test was used for continuous variables with normal distributions, and the results were expressed as mean ± standard deviation. The Mann-Whitney U test was used for continuous variables with nonnormal distributions, and the results were expressed as median (interquartile range [IQR]). Kruskal-Wallis tests were used for multiple groups. The χ2 test and Fisher exact test were used for categorical variables and logistic regression was used as a multivariate analysis to determine the risk factors. P < .05 was considered statistically significant.
RESULTS
Demographic Data
A total of 122 patients with confirmed psittacosis pneumonia were enrolled, including 56 females and 66 males. The median age was 61 (IQR, 53.0–68.0) years, 68 (55.7%) patients had underlying diseases before admission, and 61 (50.0%) patients had a definite history of exposure to birds or poultry. The median time interval from onset to diagnosis was 10 (IQR, 7.0–12.0) days, and median time duration of hospitalization was 12 (IQR, 9.8–16.0) days. The proportion of severe pneumonia was 42.6%. The demographic features and characteristics of the study population are provided in Table 1.
Demographic Data of Patients With Severe or Nonsevere Psittacosis Pneumonia
| Characteristic | Total (N = 122) | Severe Pneumonia (n = 52) | Nonsevere Pneumonia (n = 70) | P Value |
|---|---|---|---|---|
| Age, y, median (IQR) | 61.0 (53.0–68.0) | 68.0 (58.3–71.0) | 57.0 (50.0–65.0) | <.001 |
| Male sex | 66 (54.1) | 39 (75.0) | 27 (38.6) | <.001 |
| Underlying diseasea | 68 (55.7) | 35 (67.3) | 33 (47.1) | .027 |
| Hypertension | 32 (26.2) | 20 (38.5) | 12 (17.1) | .008 |
| Diabetes | 16 (13.1) | 7 (13.5) | 9 (12.9) | .922 |
| Solid malignant tumor | 8 (6.6) | 4 (7.7) | 4 (5.7) | .662 |
| Cardiovascular and cerebrovascular diseases | 14 (11.5) | 10 (19.2) | 4 (5.7) | .021 |
| Autoimmune disease | 1 (0.8) | 0 (0.0) | 1 (1.4) | 1.000 |
| Structural lung disease | 1 (0.8) | 0 (0.0) | 1 (1.4) | 1.000 |
| Chronic hepatitis | 4 (3.3) | 1 (1.9) | 3 (4.3) | .635 |
| Pregnancy | 1 (0.8) | 0 (0.0) | 1 (1.4) | 1.000 |
| Smoking history | 26 (21.3) | 17 (32.7) | 9 (12.9) | .008 |
| Drinking history | 18 (14.8) | 11 (21.2) | 7 (10.0) | .086 |
| Environmental exposure | 61 (50.0) | 27 (51.9) | 34 (48.6) | .714 |
| Confirmed days, median (IQR) | 10.0 (7.0–12.0) | 9.0 (7.0–11.8) | 10 (7.0–12.0) | .434 |
| Days of hospitalization, median (IQR) | 12.0 (9.8–16.0) | 15.0 (11.0–20.0) | 11.0 (9.0–12.3) | <.001 |
Data are presented as No. (%) unless otherwise indicated.
Abbreviation: IQR, interquartile range.
Some patients had several underlying diseases.
Patients in the severe pneumonia group were older than those in the nonsevere pneumonia group (68.0 [IQR, 58.3–71.0] years vs 57.0 [IQR, 50.0–65.0] years; P < .001), and included more male patients (75.0% vs 38.6%; P < .001). The proportion of patients with underlying diseases and smoking history in the severe pneumonia group (67.3% vs 47.1%; P = .027) was higher than that in the nonsevere pneumonia group (32.7% vs 12.9%; P = .008). Hypertension, cardiovascular disease, and cerebrovascular disease were more common in the severe pneumonia group than in the nonsevere pneumonia group (38.5% vs 17.1%, P = .008; 19.2% vs 5.7%, P = .021), and the median time of hospitalization was longer than in the nonsevere pneumonia group (15.0 [IQR, 11.0–20.0] days vs 11.0 [IQR, 9.0–12.3] days; P < .001). In this study, 52.5% (64/122) of patients with psittacosis pneumonia developed their illness in winter, 28.7% (35/122) in autumn, 14.8% (18/122) in spring, and 4.1% (5/122) in summer.
Further multivariate regression analysis showed that age >65 years (odds ratio [OR], 3.11 [95% confidence interval {CI} 1.33–7.27]; P = .009) and male sex (OR, 3.61 [95% CI 1.40–9.35]; P = .008) were the risk factors for the development of severe pneumonia in patients with psittacosis pneumonia. Patients >65 years of age were 3.1 times more likely to develop severe pneumonia than those younger than 65 years, and males were 3.6 times more likely than females to develop severe pneumonia (Figure 1).
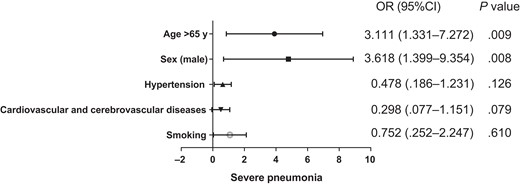
Multivariate logistic regression analysis of the factors associated with progression to severe pneumonia. Abbreviations: CI, confidence interval; OR, odds ratio.
Clinical Signs and Symptoms
The clinical symptoms and signs of patients with psittacosis pneumonia are shown in Figure 2. The most common symptom was high fever (121/122 [99.2%]) (mean maximum temperature, 39.5%), followed by cough (77/122 [63.1%]), fatigue (64/122 [52.5%]), shortness of breath (61/122 [50.0%]), expectoration (47/122 [38.5%]), chills (46/122 [37.7%]), central nervous system (CNS) symptoms (45/122 [36.9%]), myalgia (36/122 [29.5%]), gastrointestinal tract symptoms (19/122 [15.6%]), cyanosis (12/122 [9.8%]), and chest pain (5/122 [4.1%]). Shortness of breath was more common in the severe pneumonia group than in the nonsevere pneumonia group (69.2% vs 35.7%; P < .001), and the other symptoms did not show significant differences between the 2 groups. In this study, 102 of 122 (86.1%) patients with psittacosis pneumonia presented with extrapulmonary manifestations such as fatigue, myalgia, CNS symptoms, and gastrointestinal symptoms.
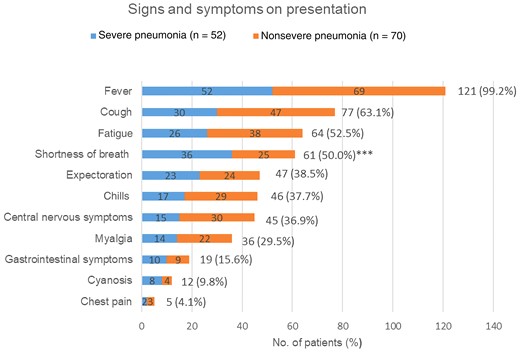
Symptoms and signs on presentation of patients diagnosed with psittacosis pneumonia. ***P < .001 when comparing severe pneumonia and nonsevere pneumonia groups.
Laboratory Examination Results
On admission, 80 of 122 (72.1%) patients presented with normal white blood cell (WBC) count, and 36 of 122 (29.5%) had elevated WBC. Seventy-two percent (88/122) had reduced lymphocyte count, and >90% of cases had elevated C-reactive protein (CRP), procalcitonin (PCT), erythrocyte sedimentation rate (ESR), and D-dimer. More than 70% of cases had elevated lactate dehydrogenase (LDH) and aspartate aminotransferase (AST). In addition, of the 122 cases, hyponatremia was found in 73 (59.8%), hypokalemia in 39 (32.0%), hypochloremia in 37 (30.3%), and hypoproteinemia in 107 (87.7%). Eighty-two patients had an oxygenation index measured on admission, with a mean of 261.6 ± 93.1. The laboratory results of patients with psittacosis pneumonia are shown in Table 2.
Laboratory Tests of Patients With Psittacosis Pneumonia
| Laboratory Test (Reference Range) | No. (%) of Patients | Total (N = 110) | Severe Pneumonia (n = 47) | Nonsevere Pneumonia (n = 63) | P Value |
|---|---|---|---|---|---|
| WBCs (3.5–9.5) × 109/L | 36 (29.5)↑ | 7.0 (5.5–9.9) | 7.2 (5.1–11.1) | 7.0 (5.7–9.6) | |
| Hb (120–160) g/L | … | 119.5 (108.8–131.3) | 119.0 (106.0–129.5) | 119.5 (108.8–134.0) | |
| PLT (100–350) × 109/L | … | 171.0 (120.0–224.5) | 141.5 (101.3–222.8) | 180.5 (143.3–224.5) | |
| NEUT (1.6–6.3) × 109/L | 57 (46.7)↑ | 5.8 (4.2–8.4) | 6.2 (4.1–10.4) | 5.4 (4.3–8.2) | |
| LYM (1.1–3.2) × 109/L | 88 (72.1)↓ | 0.6 (0.3–0.9) | 0.4 (0.3–0.8) | 0.7 (0.4–0.9) | .021 |
| NEUT% (40–75) | 101 (82.8)↑ | 87.0 (79.0–91.3) | 90.2 (86.7–94.0) | 82.9 (75.3–88.3) | <.001 |
| LYM% (20–40) | 93 (76.2)↓ | 7.9 (5.1–12.7) | 6.7 (3.3–10.3) | 9.0 (5.5–13.4) | .047 |
| CRP (0.0–8.0) mg/L, mean ± SD | 121 (99.2)↑ | 156.1 ± 81.8 | 166.8 ± 78.4 | 148.3 ± 83.9 | .218 |
| PCT (0.00–0.05) µg/L (n = 103) | 99 (96.1)↑ | 0.63 (0.21–3.23) | 1.53 (0.53–4.08) | 0.26 (0.11–1.71) | <.001 |
| ESR (0–20) mm/h, mean ± SD (n = 61) | 56 (91.8)↑ | 66.6 ± 28.6 | 67.2 ± 33.3 | 66.3 ± 25.6 | .918 |
| ALT, U/La | 83 (68.0)↑ | 62.3 (36.5–100.0) | 76.4 (44.6–114.7) | 50.0 (30.0–75.1) | .005 |
| AST, U/La | 96 (78.7)↑ | 64.3 (40.8–123.3) | 109.0 (61.7–178.3) | 49.2 (32.8–91.1) | <.001 |
| BU (3.1–8.0) mmol/L (n = 116) | … | 5.2 (4.0–7.4) | 6.9 (4.9–9.5) | 4.5 (3.5–5.8) | |
| Cr (57–97) µmol/L | 21 (17.2)↑ | 66.9 (54.0–86.6) | 73.6 (58.8–107.5) | 65.0 (52.5–81.8) | |
| ALB (40–55) g/L | 107 (87.7)↓ | 32.0 (28.1–35.7) | 30.3 (27.1–34.3) | 33.8 (30.0–37.3) | .004 |
| LDH (120–250) U/L (n = 110) | 92 (83.6)↑ | 360.6 (279.8–590.5) | 4517 (340.3–803.7) | 313.5 (251.5–431.5) | <.001 |
| Na (137–147) mmol/L, mean ± SD | 73 (59.8)↓ | 135.2 ± 5.5 | 135.0 ± 6.4 | 135.4 ± 4.8 | |
| K (3.5–5.3) mmol/L, mean ± SD | 39 (32.0)↓ | 3.7 ± 0.5 | 3.8 ± 0.6 | 3.6 ± 0.5 | |
| Cl (98–107) mmol/L, mean ± SD (n = 108) | 37 (30.3)↓ | 100.5 ± 7.0 | 101.9 ± 9.2 | 99.5 ± 4.8 | |
| D-dimer (0–0.55) mg/L (n = 116) | 105 (90.5)↑ | 1.76 (1.02–3.89) | 3.00 (1.65–6.30) | 1.44 (0.74–2.02) | <.001 |
| PO2/FIO2 (300–500) mm Hg, mean ± SD (n = 82) | … | 261.6 ± 93.1 | 221.1 ± 78.6 | 315.9 ± 83.7 | <.001 |
Data are presented as median (interquartile range) unless otherwise indicated.
Abbreviations: ↑, above normal range; ↓, below normal range; ALB, albumin; ALT, alanine aminotransferase; AST, aspartate aminotransferase; BU, blood urea; Cl, Chlorine; Cr, serum creatinine; CRP, C-reactive protein; ESR, erythrocyte sedimentation rate; Hb, hemoglobin; LDH, lactate dehydrogenase; LYM, lymphocytes; LYM%, percentage of lymphocytes; K, Kalium; Na, Natrium; NEUT, neutrophil count; NEUT%, percentage of neutrophils; PCT, procalcitonin; PLT, platelets; PO2/FIO2, oxygenation index; SD, standard deviation; WBC, white blood cell.
The ALT reference ranges for males and females were 9–50 U/L and 7–40 U/L, respectively; the AST reference ranges for males and females were 15–40 U/L and 15–35 U/L, respectively.
Patients in the severe pneumonia group had higher levels of PCT, alanine aminotransferase, AST, LDH, and D-dimer, and lower levels of lymphocytes, albumin, and PO2/FIO2 compared with the nonsevere pneumonia group.
Chest Computed Tomographic Findings and Changes
Chest computed tomography (CT) was performed in all 122 patients on admission or before. Single lung lesions accounted for 36.1% (44/122), and lesions involved in 2 or more lobes accounted for 63.9% (78/122). The most common patterns of lesion were consolidation (71.3%; Figures 3B and 5), followed by patch shadow (54.9%). Some patients had hilar or mediastinal lymphadenectasis (10.7%; Figure 4), interstitial pneumonia (5.7%), or reversed halo sign (4.1%). Fifty-one of 122 patients (41.8%) had pleural effusion. In all patients, 54.9% of patients had lesions in the right lower lobe, and 46.7% of patients had lesions in the left lower lobe.
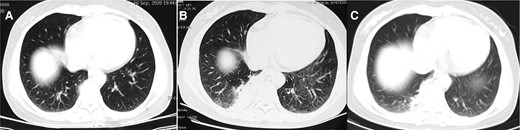
Computed tomographic images from a 49-year-old woman (case 4), with a history of pigeon contact and onset of fever. A, Image obtained on day 1 after onset of symptoms shows fibrous foci in the right lower lobe. B, Image obtained on day 4 after onset of symptoms shows consolidation in the right lower lobe (empiric treatment with cephalosporin antibiotics for 3 days). C, Image obtained on day 11 after onset of symptoms shows consolidation decreased compared with before in the right low lobe (treatment with moxifloxacin for 7 days).
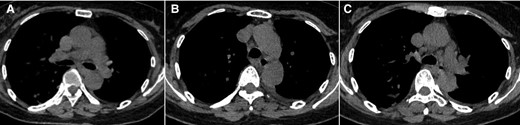
Computed tomographic images from a 61-year-old woman (case 7) with onset of fever. The images show mediastinal lymphadenectasis.
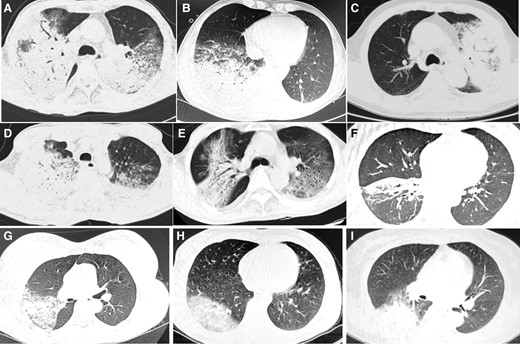
Computed tomographic scan showing consolidation in patients with psittacosis pneumonia.
Clinical Treatment and Outcomes
Initial Empiric Treatment
Most patients received initial antimicrobial treatment with β-lactams or fluoroquinolones (Figure 6) as the empiric therapy. Among them, 55 patients received initial treatment with β-lactams, 26 patients received initial treatment with fluoroquinolones, and 32 patients received initial combination treatment with fluoroquinolones and β-lactams. Only 1 patient was initially treated with tetracycline. Overall, initial empiric treatment failed in 103 of the 122 patients (84.4%). Among 58 patients initially treated with fluoroquinolones, treatment was effective in only 18 (31.0%).
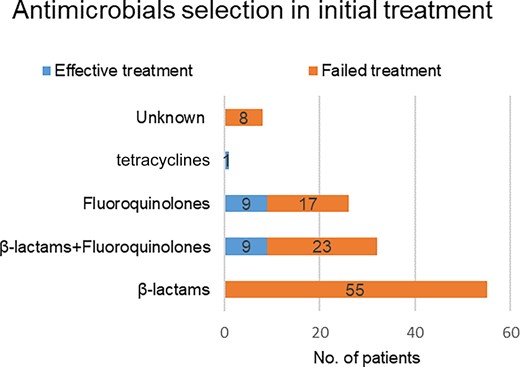
Antimicrobial selection and effective vs failed initial treatment of patients diagnosed with psittacosis pneumonia.
Target Antimicrobial Treatment
After the etiological diagnosis was confirmed by mNGS or PCR, 69 patients switched or continued to tetracyclines, 20 patients switched to tetracyclines combined with fluoroquinolones, 29 patients continued initial treatment with fluoroquinolones, and 4 patients switched to macrolides (Figure 7). Antimicrobial treatment is summarized in Table 3. Fluoroquinolones were used more frequently in the nonsevere pneumonia group than in the severe pneumonia group (32.9% vs 11.5%; P = .006). Fluoroquinolones combined with tetracyclines were more commonly used in the severe pneumonia group than the nonsevere pneumonia group (26.9% vs 8.6%; P = .007).
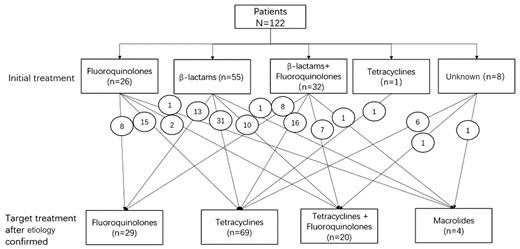
Adjustment of treatment regimen for patients with psittacosis pneumonia. The number in the circle indicates the number of cases of conversion therapy.
Target Treatment in Patients With Psittacosis Pneumonia
| Antibiotic Class | All Patients | Severe Pneumonia (n = 52) | Nonsevere Pneumonia (n = 70) | P Value |
|---|---|---|---|---|
| Tetracyclines | 69 (56.6) | 31 (59.6) | 38 (54.3) | .557 |
| Fluoroquinolones | 29 (23.8) | 6 (11.5) | 23 (32.9) | .006 |
| Fluoroquinolones + tetracyclines | 20 (16.4) | 14 (26.9) | 6 (8.6) | .007 |
| Macrolides | 4 (3.3) | 1 (1.9) | 3 (4.3) | .635 |
Data are presented as No. (%) unless otherwise indicated.
Comparison of Efficacy of Different Kinds of Antimicrobials
Treatment with tetracyclines was effective in 66 of 69 (95.7%) patients, and the effective rate was significantly higher than that of patients who were initially treated with fluoroquinolones (18/58 [31.0%]) (P < .001). The median defervescence time of fluoroquinolones, tetracyclines, and fluoroquinolones combined with tetracyclines was 4.0 [IQR, 3.0–6.0] days, 2.0 [IQR, 1.0–3.0] days, and 2.0 [IQR, 2.0–4.5] days, respectively. The median defervescence time of tetracyclines was significantly shorter than fluoroquinolones in the treatment of psittacosis pneumonia (P < .001; Figure 8). The median duration of target treatment was 21.0 [IQR, 17.0–21.0] days, and median duration of hospital stay was 12.0 [IQR, 9.8–16.0] days. There was no significant difference in the duration of antimicrobials or hospital stay between different treatments (P > .05).
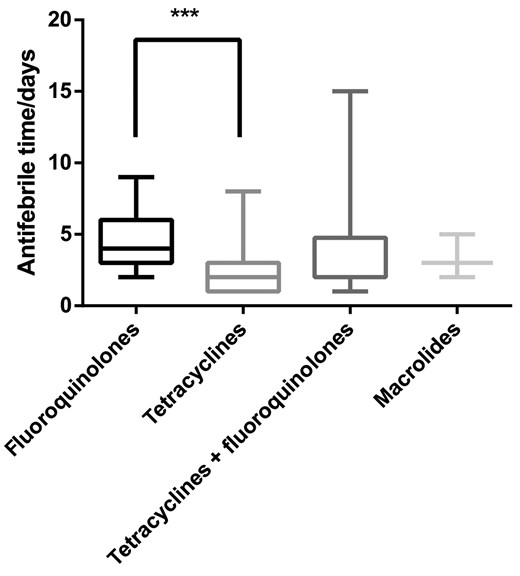
Comparison of defervescence time of psittacosis pneumonia with different antimicrobials. ***P < .001.
Outcome
In 110 patients, after adjusting medication when the diagnosis was clarified, 92 (83.6%) showed improvement in symptoms within 3 days, 101 (91.8%) showed improvement in symptoms within 7 days, 107 (97.3%) showed improvement in symptoms within 2 weeks and eventually recovered, and 3 (2.7%) died. The 3 patients who died were aged 68, 69, and 79 years, respectively. The time from onset to diagnosis of psittacosis pneumonia was 9, 7, and 10 days, respectively. All of the patients had developed severe pneumonia upon admission and were admitted to the intensive care unit, where they were given broad-spectrum antimicrobials, endotracheal intubation, and other supportive treatments. Although they were all confirmed as having psittacosis pneumonia by mNGS and were subsequently treated with tetracyclines, these patients developed multiple organ failure and eventually died. The duration of tetracycline treatment before death was 4, 6, and 2 days, respectively, and the duration from onset to death was 13, 13, and 12 days, respectively.
Among all the clinically cured patients with psittacosis pneumonia, 63 patients were tracked and reviewed by chest CT after discharge (Figure 9). The lesions were completely absorbed in 39 patients, including 10 patients with severe pneumonia and 29 with nonsevere pneumonia. The time from onset to complete absorption in imaging was 39.4 ± 17.0 days, and the time from target treatment to complete absorption of imaging lesions was 29.7 ± 17.5 days. The imaging time of complete absorption was 48.8 ± 25.3 days in patients with severe pneumonia and 36.1 ± 12.0 days in patients with nonsevere pneumonia.
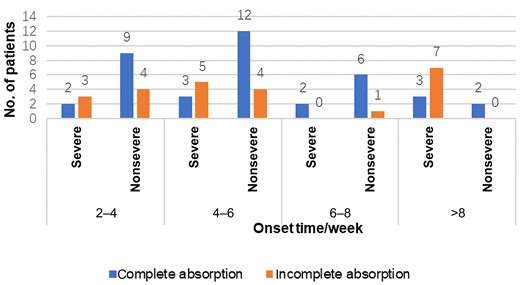
Sixty-three patients were tracked after discharge and reviewed by chest computed tomography (CT) at different times. Patients reviewed by chest CT at >6 weeks underwent at least 2 chest CT reviews and had not recovered from previous reviews.
DISCUSSION
Most cases of psittacosis pneumonia occurred in autumn and winter. Half of the patients could not provide a clear history of environmental exposure. The main symptoms were high fever, cough, fatigue, shortness of breath, expectoration, chills, myalgia, headache, and other symptoms similar to influenza. Previous studies had shown that psittacosis pneumonia was not only manifested as respiratory symptoms, but also systemic symptoms such as fatigue, headache and myalgia, CNS symptoms [11], gastrointestinal symptoms [12], infective endocarditis [13], encephalitis [14, 15], and other symptoms. In this study, 102 of 122 (86.1%) patients presented with extrapulmonary symptoms at the onset, including myalgia, headache, and gastrointestinal symptoms.
Psittacosis pneumonia mainly occur by avian-to-human transmission. In this study, 2 pairs of family members were successively infected with psittacosis pneumonia, and were all exposed to birds. It was not clear whether these infections were from human-to-human transmission. Recent report found that the transmission of psittacosis could occur by human-to-human transmission, even by asymptomatic carriers or by healthcare workers [3].
Laboratory tests showed normal or mildly elevated WBC count; elevated ESR, CRP, PCT, liver enzymes, LDH, and D-dimer; and decreased lymphocyte count, serum sodium, and albumin. Approximately 79% of the patients presented with liver damage and 17.2% with kidney injury (none of these patients had a history of renal or liver disease).
Psittacosis pneumonia, Mycoplasma pneumonia, Chlamydia pneumoniae pneumonia, and Legionella pneumonia are all atypical pneumonia. Psittacosis pneumonia shared some common and different clinical features, and seem to have a higher rate of severe pneumonia. For Mycoplasma pneumonia, radiographic changes are given priority with interstitial pneumonia, and mainly occur among adolescents. Chlamydia pneumoniae pneumonia accounts for 10% of CAP, and the dominant age of infection is 5–14 years. The clinical symptoms are mild and subacute attacks are common, manifested as runny nose and sore throat or accompanied by hoarseness; fever may occur, and hospitalization is rarely required [16–18]. Approximately 70% of serologically documented acute infections occur in individuals who do not seek medical attention [19], which is quite different from another Chlamydia pneumonia, psittacosis pneumonia. Clinical manifestations of psittacosis pneumonia are much more severe than those of Chlamydia pneumonia. Some of the manifestations of psittacosis pneumonia are quite similar to those of Legionella pneumonia, often with extrapulmonary symptoms (eg, headache, acute mental state changes, and early pleurisy) and gastrointestinal symptoms (eg, watery diarrhea and sudden abdominal pain), and quickly develop into severe pneumonia [20, 21]. Laboratory tests for psittacosis pneumonia are also similar to those for Legionella pneumonia, including hyponatremia, hypophosphatemia, elevated liver enzyme levels, and acute elevated creatine phosphokinase levels. Early diagnosis and effective therapy are critical for patient prognosis.
In this study, it was found that chest imaging lesions of psittacosis pneumonia patients were mostly consolidation and patchy shadow, and some patients showed hilar and mediastinal lymphadenectasis and some patients showed interstitial pneumonia. Previous studies of psittacosis pneumonia were mostly consolidation shadows [22], which should be distinguished from consolidation in other lung infections, such as pneumocystis pneumonia in people living with HIV or in the course of coronavirus disease 2019 [23]. Hilar or mediastinal lymphadenectasis was rarely reported [24]. For 1 patient with hilar and mediastinal lymphadenectasis, a lymph node biopsy was performed. Chlamydia psittaci was identified in the lymph node sample by mNGS. After minocycline treatment, the lymphadenectasis resolved. In this study, 54.9% of patients had lesions involving the right lower lobe, and 46.7% of patients had lesions involving the left lower lobe, with the lesions mostly accumulated in the lower lobe of the lung, consistent with previous reports [22, 25].
For the treatment of psittacosis, tetracyclines such as doxycycline or minocycline are generally recommended as the first choice, whereas macrolides such as erythromycin or azithromycin are recommended when tetracycline is contraindicated, which is different from the treatment of Chlamydia pneumoniae and Legionella pneumonia, for which macrolides or fluoroquinolones are the first choice [10, 26]. Due to the high drug resistance rate of common CAP pathogens to macrolides, β-lactams or respiratory quinolones are mostly used in the initial empiric treatment of CAP in Chinese adults. However, this empiric regimen is not effective for psittacosis pneumonia. This may be one of the reasons why C psittaci infection is more often apparent in the mNGS report than C pneumoniae in our clinical practice in recent years.
Yang and colleagues showed that 27 patients with psittacosis pneumonia were all sensitive to quinolones and tetracyclines, and the cure rate was high [8]. Butaye et al tested the susceptibilities of 14 avian strains to doxycycline and enrofloxacin in vitro; the minimum inhibitory concentration (MIC) of doxycycline ranged from 0.05 to 0.2 mg/L, whereas the MIC of the fluoroquinolone was 0.25 mg/L [27]. In this study, 58 of 122 (47.5%) patients were initially treated with fluoroquinolones, but 40 of 58 (69.0%) of them failed treatment, which urges us to reconsider the appropriate initial treatment of CAP as psittacosis pneumonia becomes increasingly common. Treatment with tetracyclines was an alternative choice since it has a higher cure rate than fluoroquinolones. Besides, we find that the median defervescence time of tetracyclines was shorter than fluoroquinolones in the treatment of psittacosis pneumonia.
Therefore, for patients diagnosed with psittacosis pneumonia, tetracyclines are the first choice in the absence of contraindications. For patients with suspected psittacosis pneumonia, tetracyclines are recommended for empiric treatment, which is consistent with the recommendation of tetracyclines as one of the drug classes for empiric treatment of CAP in the Chinese 2016 edition of the CAP guidelines.
Isolation of C psittaci from respiratory tract or blood specimens is one of the traditional methods for the diagnosis of psittacosis, but there are very few laboratories qualified to do this. In addition, this method is time-consuming, which limits its clinical application. Serological tests include the complementary fixation test (CFT) and micro-immunofluorescence (MIF), due to cross-serological reaction between different Chlamydia species. Currently, serological detection does not have the specificity to detect C psittaci from Chlamydia trachomatis or C pneumoniae. On the other hand, antibiotic treatment 2–3 weeks prior to testing may inhibit antibody development, resulting in false-negative results [22]. PCR and mNGS have higher sensitivity and specificity and are faster than culture, CFT, or MIF. The application of mNGS in refractory or critical cases facilitated the diagnosis, and allows a clear understanding of psittacosis pneumonia. Wu found that psittacosis pneumonia accounted for 8% of severe CAP with normal immune function [28], and another study showed that C psittaci is an important emerging etiology of severe CAP, contributing to 7.5% of the cases [29]. In addition, some patients may be cured by empiric treatment, leading to the underestimate of its real morbidity. Thus, C psittaci has become a common pathogen of CAP.
Chlamydia psittaci is currently divided into 9 genotypes (A–F, E/B, M56, and WC), all associated with the preferred avian host. Genotype A is associated with Psittaciformes (cockatoos, parrots, parakeets, lories), and that was the most prevalent strain. Other genotypes are associated with Columbiformes, Anseriformes, turkeys, ducks, muskrat, and cattle, respectively [30–32]. Genotyping C psittaci strains could provide earlier information on probable avian sources, allowing for appropriate outbreak control measures [33]. Is the different manifestation of psittacosis pneumonia related to different genotypes of C psittaci? In the future, we may use mNGS to conduct genotyping and predict drug sensitivity for psittacosis patients, and truly achieve targeted therapy.
CONCLUSIONS
Psittacosis pneumonia has a high rate of severe disease. At present, poor clinical recognition, delayed diagnosis, and inappropriate initial treatment are common. Suspected diagnosis of psittacosis pneumonia can be derived based on the patient’s clinical and laboratory features. Proven diagnosis could be rapidly confirmed by mNGS tests. In this study, tetracycline therapy had a rapid effect and a high cure rate.
Notes
Author contributions. X. S. was responsible for study conception and design. Y. N., H. Z., Y. G., and L. L. analyzed the patient data and contributed to the writing of the manuscript. Q. Z., L. W., B. W., S. C., M. C., J. X., C. C., Y. C., S. S., L. J., W. S., W. C., J. Y., X. L., B. S., and C. F. collected the clinical data. X. S. contributed to revision of the manuscript. All authors read and approved the final manuscript.
Patient consent. This study is retrospective, patients’ informed consent is exempt, and none of the data could be traced back to an identifiable patient. The design of the work was approved by the Ethics Committee of Jinling Hospital.
Financial support. This work was supported by the Natural Science Foundation of China (grant no. 82270019 and 82070011) and the Key project of Jiangsu Commission of Health (grant no. K2019004).
Potential conflicts of interest. The authors: No reported conflicts of interest.
References
Author notes
Yueyan Ni, Huanhuan Zhong, Yu Gu, Li Liu, Qiang Zhang, Li Wang, Bing Wan, Shi Chen, Min Cao and Jin Xu contributed equally to this work and share first authorship.


Comments