


Abstract
This study quantifies the drivers of the gender pay gap among medical doctors in the British public sector, both at the mean and across the earnings distribution. We make comparisons to private sector doctors, as well as to other public sector health professionals and find that the substantial 22% hourly gender pay gap among public sector doctors, which is predominately unexplained by personal and work-related characteristics, is far larger than in these comparator occupations. Our evidence suggests sector–occupation-specific drivers of gender pay inequality among public sector doctors, which are particularly pronounced at the top end of the wage distribution.
1. Introduction
Recent industrial action among doctors in Britain has renewed attention on salaries in the public sector and emphasized the importance of pay to the delivery of healthcare, including through worker recruitment, retention, and productivity. While the contemporary debate has focused on the relative decline in earnings across cohorts, the scale of the gender pay gap (GPG) within the profession has also prompted recent policy concern. Indeed, it was in light of evidence of a mean annual GPG of £10,000 or 15%, that in May 2018, Jeremy Hunt, as Secretary of State for Health, announced that he was determined to eliminate the GPG among doctors in the National Health Service (NHS).1
Using nationally representative data from the Annual Survey of Hours and Earnings (ASHE), this article provides new evidence on the GPG and gender pay equality among public sector medical doctors employed in Britain.2 To our knowledge, we are the first to use national survey data to examine the GPG among this highly skilled occupation and, in using these data we are able to contrast the size and drivers of the GPG with comparator occupations to explore the role of sector and occupation. We do this both at the mean and across the wage distribution to capture variation in the GPG between relatively high and low earners, and identify ‘sticky floors’ and/or ‘glass ceilings’ important in the design of effective policy interventions. In doing so, we contribute to the international literature on the GPG among physicians, which is dominated by studies from the US private sector, and make a broader contribution to understanding within-occupation GPGs and sectoral differences in the GPG in Britain.
The focus on doctors is consistent with increasing recognition of the importance of GPGs within rather than between occupations and insights provided by occupation-specific analysis, especially for highly skilled professionals (e.g. Azmat and Ferrer, 2017 and Ganguli et al., 2021 for lawyers, and Goldin and Katz, 2016 for pharmacists). An advantage of the approach is that employees within an occupation are likely to be more homogeneous than comparisons across all employees or employees within a sector therefore reducing the bias arising from unobserved heterogeneity. In the UK, existing studies have provided evidence relating to law (McNabb and Wass, 2006) and higher education (McNabb and Wass, 1997), including academic economists (Mumford and Sechel, 2020). We extend this literature by considering a prestigious, highly skilled, and highly paid occupation within the public sector, which is characterized by broadly equal gender representation. In doing so, we contribute to evidence on the public sector GPG in Britain (see Jones et al., 2018) and the GPG among high-skilled workers (see Chzhen and Mumford, 2011).
There has been interest in the GPG among physicians in the USA for several decades, with evidence suggesting a sizeable and persistent GPG among often self-employed physicians within this largely private healthcare system that is only partly explained by gender differences in observable characteristics, consistent with gender wage inequality (Ohsfeldt and Culler, 1986; Bashaw and Heywood, 2001; Esteves-Sorenson and Snyder, 2012). In the context of the public health insurance system in Austria, where self-employed physicians are unable to control the price of services, Theurl and Winner (2010) find a similarly pronounced unexplained GPG. More closely related to our study given the focus on employees, Magnusson (2016) explores the GPG for public and private sector physicians in Sweden and finds it is largely unexplained even after accounting for speciality and parenthood. While sectoral differences in the GPG are not explored in this context, Gaiaschi (2019) provides evidence of a larger unexplained hourly GPG among hospital doctors in the private relative to the public sector in Italy. Most recently, Sin et al. (2021) find a smaller, but nevertheless sizeable (11%), unexplained GPG among medical doctors employed in the public sector in New Zealand.
Our focus is Britain, where after adjusting for hours, the GPG among hospital doctors has been estimated to be about 20% (Department of Health and Social Care—DHSC, 2020), of comparable magnitude to that in the USA (20%) (Bashaw and Heywood, 2001), Austria (20%) (Theurl and Winner, 2010), and Italy (25%) (Gaiaschi, 2019) but greater than in Sweden (10%) (Magnusson, 2016) or New Zealand (13%) (Sin et al., 2021). Our analysis provides a distinct contribution to the international literature, with the focus on doctors employed in the public sector aligned to the emphasis on employer discrimination within labour economics, and driven by unique institutional features. Managerial discretion is limited by national and transparent salary scales in the UK public sector which reward time served, and annual pay recommendations are made by the independent Review Body on Doctors’ and Dentists’ Remuneration (DDRB), whose remit includes due regard for legal obligations, including under the 2010 Equality Act and Public Sector Equality Duty (PSED).3 In this respect, greater gender pay equality might be expected and has perhaps hitherto limited academic scrutiny.4
To our knowledge, the only other study to consider the GPG in this context is the recent review of the GPG in medicine (DHSC, 2020) which utilizes administrative data on hospital doctors in England.5 In stark contrast to the existing literature the review finds the majority (92%) of the 20% GPG in basic pay is explained by observable personal and work-related characteristics, particularly age and seniority, although we argue that the inclusion of the latter, when measured by pay grade, is inappropriate (see below).
We utilize nationally representative data to extend this evidence by providing the first comparative analysis which explores the relative situation of public sector doctors. Following the literature on public–private sector GPG comparisons, we first make a within-occupation between-sector comparison, that is, we compare doctors employed in the public and private sector to explore the potential influence of institutional pay setting arrangements.6 Secondly, we make a comparison within the public sector but across closely related high-skilled occupations, by considering doctors relative to other public sector ‘Health Professionals’, including psychologists, pharmacists, and medical radiographers, to assess the extent to which the findings are occupation specific. Finally, we provide a well-established benchmark, comparing doctors to all other public sector employees.7 In doing so, we explore sectoral and occupation-specific drivers of the GPG among doctors, as well as set the findings into the broader British context. Unlike the DHSC (2020), and the majority of evidence on the GPG among doctors (see Shih and Konrad, 2007 and Magnusson, 2016 for exceptions), we do not restrict our analysis to the mean and consider the GPG across the wage distribution since distributional analysis is well-established to be important in understanding the GPG (Albrecht et al., 2003), particularly through identifying variation in the GPG between the top and bottom ends of the wage distribution, and in GPG comparisons across sectors (Arulampalam et al., 2007).
We find a substantial (22%) hourly GPG among public sector doctors, which is about three times larger than among private sector doctors or other public sector health professionals. In fact, despite the likely more homogeneous workforce within a single sector–occupation, the GPG among public sector doctors is larger than estimates for the entire economy. Moreover, the vast majority (over 90%) of the mean GPG among public sector doctors is unexplained by well-established personal and work-related characteristics, suggesting potential substantial gender inequality in rewards. This is not evident among private sector doctors or public sector health professionals, consistent with sector–occupation-specific drivers. Indeed, among public sector doctors, we find a particularly pronounced unexplained GPG at the upper end of the wage distribution consistent with a marked ‘glass ceiling’.
The remainder of the article is structured as follows. Section 2 provides an overview of our data and measures analysed. A brief outline of the decomposition methods applied to explore the GPG at the mean and across the wage distribution is provided in Section 3. Section 4 presents the results and Section 5 concludes.
2. Data
The analysis utilizes data from ASHE, the main source of earnings data in Britain (ONS, 2020), which contain detailed and reliable information on pay (see below for details), occupation and sector, and for a large sample (1% of employee jobs). We provide contemporary evidence, based on the latest year of these data, April 2018.8 Our estimates therefore pre-date any changes in work patterns or reward brought by COVID-19. Unlike much of the literature on the GPG in medicine, where pay is self-reported in occupation-specific surveys (often in bands) (for a criticism see Theurl and Winner, 2010), the ASHE is based on employer payroll records. It also has several advantages in this context, particularly that these data (unlike occupation-specific payroll data, e.g. from NHS digital in England) provide information using established measures of pay that are comparable across occupations, and across Britain. Moreover, the sample is sufficiently large to explore specific occupations, including doctors. The trade-off, however, is that ASHE contains a fairly limited set of personal characteristics and does not allow us to explore occupation-specific work-related characteristics such as medical speciality for doctors.9
The sample is restricted to working-age individuals who are paid an adult rate, and whose earnings are not affected by absence. ASHE calibration weights (which are based on the Quarterly Labour Force Survey (QLFS) and account for age group, sex, occupation, and region) are applied so the estimates are representative of the respective population, and we present population sizes as well as the unweighted number of observations (denoted by N). After excluding those with missing values for any of the variables used in the analysis, we are left with 160,115 observations, which for simplicity we refer to as employees, recognizing that an employee might hold multiple jobs (see later discussion).
2.1 Public sector doctors
As is typical in the literature on the GPG, but not the existing international evidence relating to physicians, our focus is employees where information is provided via employer Pay As You Earn tax records.10 We define medical doctors using the occupation ‘Medical Practitioners’ (i.e. Standard Occupational Classification—SOC 2010 code 2211). We further separate doctors employed in the public sector based on the legal status of the enterprise from the Inter-Departmental Business Register.11 This will include doctors across all grades (from doctors in training to consultants) and medical specialities.
Private sector doctors provide our first, within-occupation, comparator. While we acknowledge they are a relatively small and self-selected group in Britain, who are likely to be employed in a more diverse range of settings, including greater presence in General Medical Practice, given the similarity in education, training, job responsibilities, and occupational preferences they form an interesting comparator with a distinct employer, operating under a different institutional and legal framework, and market-based pay setting arrangement. It is possible for doctors to hold more than one job, including potentially, simultaneously holding roles within the public and private sector. However, our data, which are recorded at the job level, suggest this is limited in practice with only about 6% of public sector doctors and 8% of private sector doctors holding another salaried job. Section 4.2 nevertheless explores the robustness of our analysis to multiple job holding.
In addition to exploring the role of sector, we assess the extent to which the GPG among public sector doctors differs from those in closely related public sector occupations who share common elements of public sector pay setting arrangements and sectoral preferences. To minimize occupational selection bias, our within sector comparator includes employees in ‘similar’ highly skilled medical occupations, defined as all other occupations, namely, Psychologists; Pharmacists; Dental practitioners; Medical radiographers; Podiatrists, and Health professionals not elsewhere classified (n.e.c.) (see Supplementary Appendix Table A1 for details) within the broader minor SOC 221 group (Health Professionals) which includes doctors.12 We also provide a broader national benchmark which includes all other public sector employees. Together these comparator occupations provide insights into the relative magnitude of the GPG among public sector doctors and the extent to which differences stem from sector or occupation-specific features.
The final sample includes 1,099 public sector doctors, who account for 0.8% (3.6%) of all (public sector) employees (see Table 1). Our sample sizes for private sector doctors and public sector health professionals are 243 and 604, respectively. Consistent with previous evidence, there is a relatively equal gender representation among doctors in Britain with females accounting for 44% and 54% in the public and private sector, respectively.13,14 Although women represent about half of all employees, consistent with previous evidence (e.g. Jones and Kaya, 2019) we find that females are concentrated in the public sector, representing more than two-thirds of public sector employees and 70% of public sector health professionals.
Number of observations and percentage female across occupations
| Public sector doctors | Private sector doctors | Rest of public sector health professionals | Rest of public sector employees | All employees | |
|---|---|---|---|---|---|
| % female | 44.30 | 54.03 | 70.13 | 68.61 | 49.54 |
| Population size | 205,838 | 45,359 | 107,218 | 5,520,052 | 24,390,290 |
| (0.84) | (0.19) | (0.44) | (22.63) | (100) | |
| [3.60] | – | [1.87] | [96.41] | – | |
| N | 1,099 | 243 | 604 | 35,560 | 160,115 |
Source: Authors’ calculations based on ASHE 2018.
Notes: Figures in () and [] are the percentage of employee jobs and those in the public sector, respectively.
2.2 Hourly pay
In line with the established GPG literature, and our focus on employees, our main dependent variable is (log) gross hourly pay, which adjusts pay during the reference period for hours worked.15 This measure is based on the ONS recommended definition, excluding overtime, but including performance-related pay (PRP) paid within the reference period.16 Unlike data from occupation-specific surveys or personnel records, our well-established measure of pay facilitates comparisons across occupations. The mean log hourly pay is reported by gender in Table 2 and confirms the relatively high hourly pay among doctors, which is about 0.11 log points (or 11.5%) higher in the public sector than the private sector on average, and 62.3% and 112.8% higher among public sector doctors than other public sector health professionals and rest of the public sector employees, respectively.17 Table 2 also confirms a substantial hourly GPG among public sector doctors of 22.0% which, despite the within-occupation-sector focus, is larger than the national GPG (18.6%). Our estimate of the hourly GPG is of comparable magnitude to the full-time equivalent (FTE) GPG among hospital doctors in England at between 20% and 23%, depending on the specific measure of pay (DHSC, 2020). The GPG among public sector doctors is, however, far wider than among private sector doctors (6.2%) and public sector health professionals (7.5%). The wider GPG among doctors in the public relative to private sector is particularly surprising given previous evidence of a lower GPG in the public relative to private sector as a whole (Jones et al., 2018).18 It is actually more comparable to the public sector (18.8%), despite its diversity in occupational composition.
Mean log gross hourly pay by gender across occupations
| Public sector doctors | Private sector doctors | Rest of public sector health professionals | Rest of public sector employees | All employees | |
|---|---|---|---|---|---|
| All | 3.486 | 3.377 | 3.002 | 2.731 | 2.643 |
| [0.520] | [0.592] | [0.367] | [0.430] | [0.521] | |
| Males | 3.574 | 3.410 | 3.053 | 2.849 | 2.728 |
| [0.528] | [0.589] | [0.403] | [0.431] | [0.547] | |
| Females | 3.375 | 3.350 | 2.981 | 2.677 | 2.557 |
| [0.487] | [0.596] | [0.349] | [0.418] | [0.478] | |
| GPG (%) | 22.0 | 6.2 | 7.5 | 18.8 | 18.6 |
Source: Authors’ calculations based on ASHE 2018.
Notes: Figures in [] are standard deviations.
Figure 1 further compares the observed GPG throughout the hourly pay distribution across the four occupations and confirms that the GPG among public sector doctors, which is greater among higher earners, is significantly greater than among private sector doctors or other public sector health professionals across most of the distribution.
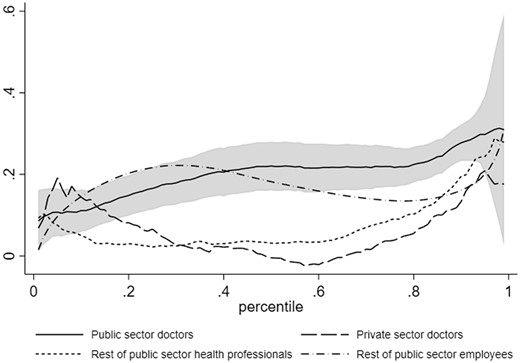
Observed hourly GPG across the distribution, across occupations
Source: Authors’ calculations based on ASHE 2018.
Notes: (i) Observed GPG is estimated using the conditional quantile model which includes personal and work-related characteristics. Specification for the rest of public sector health professionals also includes occupation dummies measured for detailed SOC 2010 codes, where 2219 Health professionals n.e.c are grouped with 2,214 Ophthalmic opticians and 2,216 Veterinarians due to small sample size in these categories. Specification for rest of public sector employees also includes SOC 2010 major groups (nine categories) and SIC sections (regrouped as: O Public administration and defence; compulsory social security; P Education; Q Human health and social work activities and Other which contains anything outside these three groups). (ii) Grey shaded area represents the 95% confidence interval for public sector doctors.
2.3 Explanatory variables
ASHE contains detailed information about the nature of the job and employer, and we control for a comprehensive range of work-related characteristics which are all well-established determinants of earnings (see Blau and Kahn, 2017) including firm size (natural logarithm of number of employees), tenure (years in the present organization) (and tenure-squared), an indicator for the coverage of collective agreements, a permanent contract indicator and a full-time employment dummy. For the entire public sector, we additionally control for industry (Standard Industrial Classification—SIC 2007 sections) and occupation (SOC unit group) and, for health professionals, we control for more detailed SOC codes. In terms of personal characteristics, in addition to gender, ASHE contains information on age (and age-squared), which is used as a proxy for work experience, and work region.19
Supplementary Appendix Table A1 contains a full set of summary statistics for the explanatory variables by gender and occupation. They identify several distinct features of doctors, particularly lower average job tenure and, in the public sector, a lower proportion with permanent contracts (potentially reflecting doctors in training) and higher rates of full-time employment. Private sector doctors are more likely to work in London, far less likely to work full-time, work in smaller organizations and are less likely to be covered by collective agreements than those in the public sector. While some established patterns by gender are evident across comparator occupations, for example, females have shorter average job tenure, there are also some distinct patterns. For instance, while females are less likely to work full-time, the gender gap in full-time employment is much narrower for public sector doctors than the other occupation groups.
3. Econometric method
To explore the mean GPG, we apply established decomposition methods (Oaxaca, 1973; Blinder, 1973), widely used to analyse the national GPG, and the international GPG among physicians, to public sector doctors in Britain. Consistent with the literature, our focus is on isolating the contribution of gender differences in observable characteristics from unobserved influences on the GPG, where the latter is typically interpreted as an upper-bound measure of discrimination since it will include the influence of gender differences in productivity or preferences, albeit these are likely to be reduced in a within-occupation context.
4. Results
4.1 Mean hourly GPG
Table 3 presents the mean hourly GPG decomposition results for the four occupations.22 In the upper panel the observed GPG is separated into its explained and unexplained components. For public sector doctors, only a small (9.3%) and statistically insignificant part of the 22.0% hourly GPG is explained by our personal and work-related characteristics. The remaining 19.7% GPG is therefore unexplained and forms our upper bound estimate of gender wage inequality among public sector doctors in Britain. Albeit in different contexts and using different specifications, our estimate of the unexplained hourly GPG is of comparable magnitude to international estimates for physicians, for example, Bashaw and Heywood (2001) for the USA (18%), Theurl and Winner (2010) for Austria (15%), and Gaiaschi (2019) for Italy (17%), but is smaller than for annual income among self-employed GPs in Britain (see Gravelle et al., 2011). In contrast, it is much larger than recent estimates of the unexplained GPG for hospital doctors in England at between 2% and 7% depending on the measure of pay (DHSC, 2020) (see Supplementary Appendix Table A3), something we return to below.
Decomposition of the mean hourly GPG across occupations.
| Public sector doctors | Private sector doctors | Rest of public sector health professionals | Rest of public sector employees | |
|---|---|---|---|---|
| Observed GPG | 0.199*** | 0.060 | 0.072* | 0.172*** |
| Explained GPG | 0.018 | 0.031 | 0.012 | 0.052*** |
| [9.3] | [51.2] | [16.7] | [30.3] | |
| Unexplained GPG | 0.180*** | 0.030 | 0.060 | 0.120*** |
| [90.7] | [48.8] | [83.3] | [69.7] | |
| Components of the explained GPG | ||||
| Age | 0.036* | 0.013 | 0.010 | −0.002 |
| [18.3] | [21.8] | [13.4] | [−1.1] | |
| Work region | −0.004 | 0.014 | −0.010 | 0.011*** |
| [−2.0] | [23.3] | [−13.8] | [6.4] | |
| Tenure | 0.014 | −0.017 | 0.016 | 0.006*** |
| [6.8] | [−28.7] | [22.3] | [3.4] | |
| Full-time | −0.031** | −0.069 | −0.018 | −0.029*** |
| [−15.6] | [−115.3] | [−25.5] | [−16.8] | |
| Permanent contract | 0.003 | 0.001 | 0.002 | 0.002*** |
| [1.7] | [2.2] | [2.3] | [1.1] | |
| Firm size | −0.000 | 0.089* | −0.003 | −0.000 |
| [−0.0] | [147.7] | [−3.8] | [−0.1] | |
| Collective bargaining | 0.000 | 0.000 | −0.001 | −0.000 |
| [0.0] | [0.5] | [−1.0] | [−0.1] | |
| Occupation | – | – | 0.017 | 0.040*** |
| [23.0] | [23.1] | |||
| Industry | – | – | – | 0.025*** |
| [14.4] | ||||
| Population size | 205,838 | 45,359 | 107,218 | 5,520,053 |
| N | 1,099 | 243 | 604 | 35,560 |
Source: Authors’ calculations based on ASHE 2018.
Notes: (i) Oaxaca–Blinder decomposition is performed using a model which includes personal and work-related characteristics. Specification for rest of public sector health professionals also includes occupation dummies for detailed SOC 2010, where 2219 Health professionals n.e.c are grouped with 2,214 Ophthalmic opticians and 2,216 Veterinarians due to the small sample size in these categories. Specification for rest of the public sector also includes SOC 2010 major groups (nine categories) and SIC sections (regrouped as: O Public administration and defence; compulsory social security; P Education; Q Human health and social work activities and Other which contains anything outside these three groups). (ii) Decompositions use the relevant male coefficients as the baseline. (iii) Figures in [] are proportions of observed GPG. (iv)
p < 0.05.
p < 0.01.
p < 0.001.
The results for public sector doctors are, however, in stark contrast to private sector doctors, where we find a small (3.0%) and statistically insignificant unexplained GPG. While potentially subject to selection bias due to unobserved characteristics affecting sector choice differentially by gender, in the context of nationally agreed salary scales and more limited scope for individual bargaining than the private sector, our findings suggest a surprisingly large unexplained GPG among public sector doctors. While the majority of the GPG among public sector medical professionals is also unexplained, it is considerably smaller than among public sector doctors and not statistically significant. The latter is consistent with previous evidence of a smaller GPG among NHS occupations covered by Agenda for Change (which explicitly evaluates jobs to ensure equity between roles with similar skill requirements) relative to doctors (Jones and Kaya, 2019; Appleby and Schlepper, 2019). Albeit likely to be minimized by the similarity in occupations, which form part of the same minor SOC group, unobserved gender differences in occupational selection may again contribute to these findings. However, to explain the differences between public sector doctors and both comparator occupations would require the influence of within-occupation across-sector selection bias to operate in the same way as across-occupation within-sector selection bias, which would seem unlikely. The absence of gender pay inequality in either of these two comparator occupations instead seems to suggest sector–occupation-specific drivers of gender wage inequality among public sector doctors. Within the public sector, where gender differences in occupational and industrial distribution contribute to the explained gap, the 12.7% unexplained gap is also below that among public sector doctors.23
It is worth noting that, consistent with the broader literature on national and sectoral differences in the GPG, and subject to the usual caveats about potential gender differences in unobserved characteristics, in the absence of controls for occupation-specific characteristics, the unexplained GPG potentially reflects within-occupation gender segregation as well as wage discrimination (i.e. unequal pay within similar job roles). While gender differences in specialism have previously been found to contribute to the GPG among US physicians (see Sasser, 2005; Esteves-Sorenson and Sydner, 2012), international studies have found modest effects (see Theurl and Winner, 2010; Magnusson, 2016; Sin et al., 2021). Consistent with this, and despite evidence of unequal gender representation across specialities, the DHSC (2020) found speciality to account for less than 1% of the FTE GPG in basic pay among hospital doctors in England (see Supplementary Appendix Table A3), a likely reflection of limited variation between specialisms in public sector salary scales. Nevertheless, while we anticipate specialism will have a limited role among public sector doctors, we cannot rule out a greater contribution among private sector doctors.24
As might be expected, seniority has been found to be an important determinant of the physician GPG internationally given the underrepresentation of females in senior roles (Gaiaschi, 2019). The recent GPG review (DHSC, 2020) found that seniority, as measured by pay grade, was the key component of the explained GPG in England, accounting for nearly two-thirds of the FTE GPG in basic pay (see Supplementary Appendix Table A3). We argue that because seniority is directly related to pay in this instance, it is inappropriate to consider it as an explanation for the GPG (see Albrecht et al., 2003 for a similar discussion relating to occupation) and more generally, the inclusion of seniority in occupational analysis can be disputed. If vertical segregation among doctors is partly due to discrimination, that is, there are barriers for females in accessing particular roles, the unexplained GPG will understate discrimination when seniority is included (see McNabb and Wass, 1997 for similar concerns in relation to higher education). In contrast, however, if seniority is determined by individual preferences (see Rizzo and Zeckhauser, 2007), possibly reflecting the ability to combine work with family commitments, its exclusion, as in our analysis, will mean the unexplained GPG likely overstates discrimination. Importantly, however, this is also true among private sector doctors and public sector health professionals, where, in complete contrast, we find no evidence of an unexplained GPG. To explain the stark variation in the unexplained GPG between public sector doctors and our comparator occupations would require a greater impact of gender segregation among public sector doctors. The inclusion of doctors in training within the public, but not the private sector, provides one potential mechanism for this.
While the explained gap among public sector doctors is relatively small, we further separate its potentially offsetting drivers in the lower panel of Table 3. We find an important role for age, which explains about 18% of the GPG among public sector doctors, as a consequence of a relatively steep age-earnings profile, combined with males being older than females on average. This is consistent with recent evidence from the GPG in medicine review (DHSC, 2020) (see Supplementary Appendix Table A3) and underpins concerns relating to long pay scales that reward time served. Consistent with this, public sector doctors are the only occupation we consider where age significantly widens the GPG.25
In contrast, gender differences in full-time employment have a negative (narrowing) effect on the GPG and act to largely offset the influence of age. While the importance of hours as a determinant of the physician GPG in the literature at least in part reflects the extensive use of annual pay this is nevertheless surprising. Consistent with broader evidence, male doctors are more likely to work full-time than women. However, in contrast to the literature on the part-time pay penalty, we find a penalty for full-time work among doctors.26 Bashaw and Heywood (2001) argue that the negative relationship between hours and hourly pay is a function of diminishing marginal productivity in the USA, where (self-employed) physicians might be able to select more profitable work. This does not appear to be a plausible reason in the British context given the nature of public sector pay scales. A more likely explanation seems to be an income effect whereby high earners have an incentive to reduce hours, particularly given historical earnings limits imposed by British pension taxation rules. Nevertheless, and in contrast to expectations, in the absence of the higher rate of part-time employment among female relative to male doctors the GPG among public sector doctors would be even larger.
4.2 Sensitivity analysis
We explore the robustness of these findings to changes to the decomposition methodology, measurement of hourly pay, model specification, and year of data in Supplementary Appendix Table A4. More specifically, we explore the sensitivity of our benchmark results to using female coefficient estimates as the baseline in the decomposition (Panel A) and using coefficients from a pooled model following Fortin (2008) (Panel B). The change in reference coefficients makes little difference to the estimates for public sector doctors, public sector health professionals, or the public sector. The estimates are more sensitive for private sector doctors, likely reflecting the small sample size, but the main patterns remain consistent, that is, the unexplained gap is significant for public sector doctors and larger than for the other three comparator occupations.
In relation to the measurement of hourly pay, we explore the robustness of our results to the inclusion of overtime (Panel C) and exclusion of additional premium payments (Panel D). Neither change affects the results, suggesting the GPG among public sector doctors is not a function of overtime or additional earnings, albeit the GPG is slightly wider than when using our preferred measure of hourly pay.
Given the importance of full-time employment as a driver of the GPG among public sector doctors, we also explore the GPG among full-time employees (Panel E) and full-time, full-year employees (defined as 40 or more weeks following Goldin and Katz, 2016) (Panel F), where gender differences in labour market commitment are minimized (Blau and Kahn, 2017). While the observed GPG for public sector doctors is similar for all and full-time employees, the explained component of the GPG increases (consistent with the negative influence of full-time work identified above). As a result, the unexplained GPG narrows relative to that among all public sector doctors. In contrast, the estimates for full-time, full-year employees look more similar to all doctors. Regardless of the choice, the unexplained GPG among public sector doctors remains larger than among public sector health professionals and within the public sector. A far smaller proportion of private sector doctors work full-time, which restricts the sample size further, meaning these results should be interpreted with caution. While the unexplained GPG widens among full-time private sector doctors the patterns for full-time, full-year doctors are more like that for all private sector doctors, and in both cases, the unexplained GPG remains insignificantly different from zero.
We also adapt the specification of our wage equation to explore the influence of weighting (Panel G) and controlling for, and alternatively excluding, multiple job holders (Panels H and I, respectively). None of these changes affects our main results. Finally, we explore the robustness of the findings to the year of analysis by using data from 2017 (Panel J) and provisional data from 2019 (Panel K). Again, while the precise estimates for private sector doctors vary, the patterns remain robust.
4.3 Mean annual GPG
Given the concerns of Bashaw and Heywood (2001) and Gravelle et al. (2011), we decompose the log of annual pay in Table 4, where our measure includes (and excludes) PRP in Panel A (Panel B). In both specifications we include controls for weekly hours and annual weeks worked (generated by dividing annual by weekly pay). As might be expected given the higher prevalence of part-time work among females, the annual GPG is consistently larger than the hourly GPG. However, the extent of this difference varies considerably across occupations. The annual GPG for public sector doctors is nearly double that of the hourly GPG but for private sector doctors the increase is nearly six times. For all occupations, a greater proportion of the annual GPG is explained, reflecting the importance of gender differences in hours and weeks worked. Indeed, for most occupations the absolute unexplained GPG is similar to that based on hourly pay. The exception is private sector doctors, where the unexplained GPG in annual pay is much larger than for hourly pay. Nevertheless, this remains insignificantly different from zero and smaller than among public sector doctors, consistent with our benchmark results. The findings are also similar when PRP, which is more accurately measured on an annual basis, is excluded from pay suggesting that, despite policy concerns and potential greater discretion in allocation, PRP is not a key driver of the GPG among public sector doctors.
Decomposition of the mean annual GPG across occupations.
| Public sector doctors | Private sector doctors | Rest of public sector health professionals | Rest of public sector employees | |
|---|---|---|---|---|
| Panel A. Dependent variable log annual pay | ||||
| Observed GPG | 0.372*** | 0.357*** | 0.196** | 0.446*** |
| Explained GPG | 0.191*** | 0.243** | 0.157* | 0.329*** |
| [51.3] | [68.1] | [79.8] | [73.7] | |
| Unexplained GPG | 0.181*** | 0.114 | 0.040 | 0.117*** |
| [48.7] | [31.9] | [20.2] | [26.3] | |
| Population size | 205,838 | 45,359 | 107,218 | 5,520,053 |
| N | 1,099 | 243 | 604 | 35,560 |
| Panel B. Dependent variable log annual pay excluding PRP | ||||
| Observed GPG | 0.376*** | 0.329** | 0.194** | 0.443*** |
| Explained GPG | 0.190*** | 0.224** | 0.155* | 0.329*** |
| [50.5] | [68.3] | [79.9] | [74.4] | |
| Unexplained GPG | 0.186*** | 0.104 | 0.039 | 0.114*** |
| [49.5] | [31.7] | [20.1] | [25.6] | |
| Population size | 205,838 | 45,359 | 107,218 | 5,520,053 |
| N | 1,099 | 243 | 604 | 35,560 |
Source: Authors’ calculations based on ASHE 2018.
Notes: (i) Oaxaca–Blinder decomposition is performed using a model which includes personal and work-related characteristics plus controls for log hours per week and log total annual weeks worked. Specification for rest of public sector health professionals also includes occupation dummies for detailed SOC 2010, where 2,219 Health professionals n.e.c are grouped with 2,214 Ophthalmic opticians and 2,216 Veterinarians due to the small sample size in these categories. Specification for rest of the public sector also includes SOC 2010 major groups (nine categories) and SIC sections (regrouped as: O Public administration and defence; compulsory social security; P Education; Q Human health and social work activities and Other which contains anything outside these three groups). (ii) Decompositions use the relevant male coefficients as the baseline. (iii) Figures in [] are proportions of observed GPG. (iv)
p < 0.05.
p < 0.01.
p < 0.001.
4.4 GPG across the distribution
Figure 2 presents the GPG decomposition results across the (conditional) hourly pay distribution for each of the four occupations (Supplementary Appendix Table A5 provides the corresponding results at selected points of the distribution). For public sector doctors, the observed GPG (solid line), is evident throughout the distribution and increases from 11.7% at the 10th percentile to 24.6% at the median. Beyond this, there is a levelling off until the 80th percentile after which the GPG continues to rise until it reaches 34.7% at the 95th percentile. Characteristics play a more important role in the middle of the distribution, but the GPG is nevertheless largely unexplained. Indeed, it is virtually entirely unexplained at the bottom end of the distribution and is more than 100% explained above the 80th percentile. The 36.5% unexplained GPG at the 90th percentile substantially exceeds that at other parts of the distribution and is consistent with the presence of a ‘glass ceiling’, or greater wage inequality among high earners.27 As such, our findings are consistent with Magnusson (2016) who finds a ‘glass ceiling’ among physicians in Sweden but contrast with Shih and Konrad (2007) who, as part of a broader analysis across the distribution, provide evidence of ‘sticky floors’ among US physicians in the 1990’s, albeit both studies use a pooled regression model rather than the decomposition methods applied here.28 In the British context of clearly defined salary scales which typically specify a salary and level of experience for each grade such findings are to likely reflect gender differences in promotion, consistent with previous evidence of an unexplained gender gap in promotion to consultant in Scotland (Mavromaras and Scott, 2006).29

Decomposition of the hourly GPG across the distribution, across occupations
Source: Authors’ calculations based on ASHE 2018.
Notes: (i) Machado–Mata decomposition is performed using a model which includes personal and work-related characteristics. Specification for rest of public sector health professionals also includes occupation dummies for detailed SOC 2010, where 2,219 Health Professionals n.e.c are grouped with 2,214 Ophthalmic opticians and 2,216 Veterinarians due to the small sample size in these categories. Specification for rest of public sector employees also includes SOC 2010 major groups (nine categories) and SIC sections (regrouped as: O Public administration and defence; compulsory social security; P Education; Q Human health and social work activities and Other which contains anything outside these three groups). Observed GPG is estimated using the conditional quantile model. (ii) Decompositions use the relevant male coefficients as the baseline.
In terms of the comparator occupations, analysis at the median confirms our benchmark findings. The GPG for private sector doctors is more pronounced at the upper and lower tails of the distribution but, as with the mean, it is not statistically significantly different from zero at most points of the distribution. There is also evidence of a ‘glass ceiling’ among public sector health professionals and in the public sector but the unexplained GPG in both these comparator occupations remains well below public sector doctors at most points of the distribution. In short, the unexplained hourly GPG for public doctors is greater than in the comparator occupations not only at the mean but across the distribution, and the difference is particularly pronounced among high earners.
In a similar manner to the mean hourly GPG, we explore the sensitivity of our findings to performing the decomposition using the female coefficients as the baseline, different measures of pay, including annual pay (including and excluding PRP), a subsample of full-time employees, different model specifications including weighting and second job holding, and different years of ASHE. These results are available upon request but show an unexplained GPG throughout the wage distribution for public sector doctors and a ‘glass ceiling’ consistent with the benchmark estimates.
5. Conclusion
Prompted by a ministerial commitment to end the GPG among doctors in the NHS, this article is the first to use nationally representative data to investigate the contemporary GPG among doctors employed in the public sector in Britain. Utilizing well-established measures of the GPG, we undertake comparisons with private sector doctors and other public sector health professionals to explore the extent to which the GPG among public sector doctors is driven by sector or occupation-specific factors. Despite the focus on a high-skilled occupation within the public sector, with a more homogeneous workforce than national or sector-specific studies and broadly equal gender composition, we find evidence of a sizeable (22.0%) hourly GPG among medical doctors, which exceeds the corresponding national GPG.
While the substantial GPG among public sector doctors in Britain is surprising given the institutional and policy context, it is consistent with international studies predominately based on private healthcare systems, where doctors are often self-employed and there is evidence of a sizeable and persistent GPG. In this respect our findings appear consistent with the suggestion by Theurl and Winner (2010) that the pronounced physician GPG is not a feature of the country-specific healthcare system and, in doing so, raise further questions about the role of, albeit potentially socially determined, gender differences in preferences relating to income and work–life balance as possible drivers (see Rizzo and Zeckhauser, 2007). In contrast, however, the findings for our comparator occupations within Britain reinforce the distinct nature of the GPG among public sector doctors and question the above interpretation. The GPG among public sector doctors is nearly three times larger than among private sector doctors (6.2%) or public sector health professionals (7.5%) consistent with sector–occupation-specific drivers.
We explore the substantial mean GPG among public sector doctors and find that it is predominately unexplained by personal and work-related characteristics typically used to explore the GPG. As a result, and albeit an upper bound measure, the evidence suggests substantial potential wage inequality (19.7%) among public sector doctors in Britain. In this respect, we argue that by controlling for pay grade the recent GPG review (DHSC, 2020) substantially underestimates the unexplained gap among doctors. We show that our findings are not driven by the focus on hourly as opposed to annual pay, or the precise measure of pay adopted, suggesting the GPG is not predominately a function of additional payments, overtime or PRP. Such wage inequality among public sector doctors is particularly surprising given the existence of transparent salary scales designed to reduce wage gaps between employees with comparable experience, and the requirements of the PSED. While gender differences in unobserved personal characteristics or occupation-specific work-related characteristics remain potential drivers, this is also true among private sector doctors or public sector health professionals, where, in complete contrast, we find no evidence of an unexplained GPG. The larger unexplained GPG among public relative to private sector doctors is particularly surprising given evidence of the reverse pattern in Italy (Gaiaschi, 2019) and among the entire workforce in Britain (Jones et al., 2018). Indeed, these findings highlight the need for additional data collection to explore the roles of the selection into, and heterogeneity in the composition of, doctors within each sector, as drivers of sectoral differences in gender pay inequality.
Unlike most of the literature on physicians, we extend our analysis beyond the mean and provide the first evidence on gender pay inequality among doctors in Britain across the earnings distribution. We find that gender wage inequality is exacerbated among high earners consistent with a ‘glass ceiling’, and that this effect is more pronounced in the public sector than in our comparator occupations, suggesting particular scrutiny at the top end of the wage distribution is required. In this respect, future research needs to consider gender differences in earnings growth (see Esteves-Sorenson and Sydner, 2012), progression, and retention of public sector doctors in Britain.
In addition to contributing new evidence from a predominately public healthcare system to the international literature on the GPG among physicians, our analysis adds occupation-specific evidence to the existing literature on high-skilled workers and an intra-occupation example to British evidence on sectoral GPG comparisons. Our findings are also particularly policy relevant given the government ambition to eliminate the GPG among doctors in the NHS and timely given the intense current scrutiny of pay within this sector. While our findings support the role of age in explaining the GPG, consistent with the existence of salary scales that reward time served (DHSC, 2020) and advantage the historical representation of men in the profession, the relatively minor role of gender differences in observable personal and work-related characteristics should be of particular concern, especially when contrasted to the absence of evidence of wage inequality in comparator occupations. Indeed, among doctors, public sector pay-setting arrangements appear to widen rather than narrow the GPG and suggest more explicit consideration of the GPG within the profession is required, including by the DDRB as it makes annual pay recommendations in an era of growing GPG transparency.
Footnotes
The GPG was viewed as inconsistent with the principle of equality enshrined in the NHS and prompted a comprehensive review (see https://www.independent.co.uk/news/uk/politics/jeremy-hunt-nhs-doctors-gender-pay-gap-inquiry-health-a8372701.html [Accessed 8 November 2023]).
We do not have comparable information for Northern Ireland.
For further information see https://www.gov.uk/government/organisations/review-body-on-doctors-and-dentists-remuneration [Accessed 8 November 2023].
McNabb and Wass (1997) note a similar dearth of analysis on UK universities relative to the USA, which they argue is a consequence of the assumption of limited discrimination in formalized salary structures. However, they find a significant unexplained GPG in UK academia. Indeed, despite the transparency of salary scales among public sector doctors, there remain elements of discretion in pay determination, for example, via promotion and performance awards.
The review also considers self-employed General Practitioners (GPs) and clinical academics separately. Gravelle et al. (2011) also consider NHS GPs, who are typically self-employed, and find a sizeable unexplained gender income gap, but limited evidence of gender discrimination in profit-sharing arrangements within practices. Appleby and Schlepper (2019) consider the GPG in the NHS and find a far larger GPG among employees outside the Agenda for Change job evaluation system, which would include doctors. Consistent with this, Jones and Kaya (2019) find a larger unexplained GPG among employees covered by the DDRB than the NHS Pay Review Body (PRB).
Public–private sector GPG comparisons are typically considered in aggregate, despite pronounced differences in occupational structure (see Arulampalam et al., 2007; Jones et al., 2018). We are not aware of any other intra-occupation sectoral comparison in the UK despite the advantages of focusing on more homogeneous employees.
For simplicity, we refer to these groups as comparator occupations throughout, noting, however, that the public sector in particular contains a diverse set of occupations.
We focus on the contemporary pattern rather than exploring the time series or longitudinal element of the data. 2018 is the latest confirmed data available at the time of writing. The analysis is therefore prior to the implementation of the 2020 junior doctor contract in England. Section 4.2 shows the robustness of our findings to using alternative years.
In order to address the former, we explored the possibility of using the UK QLFS Northern Ireland Statistics and Research Agency (NISRA), Office for National Statistics, Social Survey Division (2020) but the sample for our occupations is too small to provide reliable estimates. Estimates of the explained GPG for public sector doctors in the QLFS are, however, magnified when including a more comprehensive set of personal characteristics. Nevertheless, consistent with the analysis of ASHE the explained gap remains relatively small and statistically insignificant. These results are available upon request.
Self-employed workers, including self-employed GP partners, are excluded from the ASHE. The 2018 QLFS suggests that only 15% of doctors in Britain are self-employed and this does not differ by gender.
The public sector is defined as public corporations and nationalized industries, central government, or local authorities. The vast majority of public sector doctors work in the NHS but this definition also includes doctors working for example, in the Armed Forces. Our definition of private sector includes the voluntary sector, but our results are not sensitive to this (available upon request).
Full details and job duties are provided within the SOC classification, but all these occupations require degree-level qualifications recognized by the appropriate professional body. Consistent with this, analysis of the QLFS confirms that more than 80% of other public sector health professionals have a degree level qualification. Except for dental practitioners and veterinarians, these occupations are covered by Agenda for Change and annual pay recommendations are made by the NHS PRB. Our results are, however, not sensitive to restricting our comparator to occupations covered by Agenda for Change (results available upon request).
While exploring the reasons for the higher concentration of females among private sector doctors is beyond the scope of this article, it might partly reflect differences in speciality across sectors. More flexible scheduling, typically thought to be particularly beneficial for women, has further been suggested as a characteristic of the private sector (Scott et al., 2020). Consistent with this, the concentration of females in part-time work is greater in the private relative to the public sector (see Supplementary Appendix Table A1).
Broadly equal representation of gender among public sector doctors masks gender differences in seniority (see DHSC, 2020).
This is appropriate given public sector doctors are paid a basic annual salary based on standard weekly working hours and salaries are calculated pro rata for those working part-time. Nevertheless, given the concerns raised by Bashaw and Heywood (2001), albeit in the US context, we explore the sensitivity of the estimates with respect to annual pay (see Section 4.3). Additional payments are available for public sector doctors working overtime and antisocial hours and there is also an element of performance-related pay. These are considered in our analysis. Additional payments for shortage specialities cannot, however, be explored.
Gross hourly pay is calculated as gross weekly earnings (basic weekly earnings + incentive pay + additional premium payments for shift, night or weekend work not treated as overtime + pay for other reasons) excluding overtime for the reference period divided by basic weekly paid hours. Premium payments and paid overtime are more important for public sector doctors (received by 23% and 19%, respectively) than the comparator occupations. Gender gaps in the receipt of these additional payments are, however, less pronounced than for the comparator occupations (see Supplementary Appendix Table A2). Our findings are, however, robust to the precise measure of hourly pay (see Section 4.2). We remove wage outliers defined as above ten times the 99th percentile and below half the first percentile. Gender equality in PRP is a policy concern (see DDRB, 2021) and, consistent with this, the GPG in medicine review finds the GPG in total pay is greater than that in basic pay (DHSC, 2020) and that adjusting for Clinical Excellence Awards (CEAs) narrows the unexplained consultant GPG. Section 4.3 explores the role of PRP when considering annual pay.
Supplementary Appendix Figure A1 presents the observed hourly pay distribution for all employees, males and females for each occupation and confirms the concentration of doctors within higher pay bands.
Worth noting is that the relatively wide pay distribution among public sector doctors (measured by the standard deviation), which might contribute to the within-occupation GPG, is also evident in the private sector.
Controls for work region capture wage variation arising from health being devolved in Wales and Scotland. Due to the small samples, however, Wales is aggregated with the West of England, but the results are robust to this choice (available upon request). The sample sizes preclude detailed analysis of the GPG within each nation. Having a relatively restricted set of personal characteristics is not unusual when using payroll data but a potentially important omission is a control for dependent children. Among young US physicians, however, Sasser (2005) finds children to be an important driver of the gender income gap through changes in hours rather than hourly pay. Consistent with this we find no significant role for dependent children in explaining the GPG among public sector doctors when using data from the QLFS (results available upon request), although we recognize this may have implications for hourly pay over the life cycle through human capital accumulation.
The decomposition of differences in wage distributions is applied using the approach proposed by Melly (2006), which estimates the observed GPG by using the conditional quantile regression model and integrating over the covariates. Melly (2006) shows that this procedure is numerically identical to the Machado–Mata method when the number of simulations used in Machado–Mata procedure goes to infinity.
Our findings are not sensitive to the choice of the conditional wage distribution and are similar when estimating an extension of the Oaxaca–Blinder decomposition applied across the (unconditional) wage distribution based on recentred influence function regressions (Firpo et al., 2018) (results available upon request).
Coefficient estimates for the wage equations conform to established patterns and are available upon request.
Controlling for more detailed occupational and industrial categories is likely to increase the explained component and, consistent with this, controlling for SOC unit group narrows the unexplained public sector GPG to 10.3% (results available upon request).
In additional analysis we use detailed information on industry to control for employment in Hospital activities (SIC code 86.10/1) for public sector doctors, and General medical practice activities (SIC code 86.21) for private sector doctors. The decomposition results for public sector doctors are virtually unchanged and while the unexplained GPG is larger in magnitude for private sector doctors our conclusions remain the same (results available upon request). Unfortunately, given the small samples involved we are unable to compare doctors within the same detailed industry across sectors.
In contrast to evidence from the USA (see Lo Sasso et al., 2011) analysis by age group shows no significant GPG among public sector doctors aged under 30, consistent with the GPG developing over the life course rather than being evident on entry to the profession. These results are available upon request.
This is evident for both males and females, albeit it is larger for males in the public sector. Manning and Petrongolo (2008) find the part-time pay penalty in Britain to reflect occupational segregation, and evidence of a part-time premium within some occupations.
Arulampalam et al. (2007) define a ‘glass ceiling’ as an unexplained GPG at least two percentage points larger at the 90th percentile relative to the 50th or 75th percentiles of the wage distribution.
A ‘glass ceiling’ is also consistent with evidence relating to high skilled, white-collar workers (Chzhen and Mumford, 2011) and the public sector (Jones and Kaya, 2019).
There are, however, several alternative explanations, including that females are concentrated among lower grades due to increasing female entry, or differential selection out of the profession/sector over the career lifecycle. While also potentially driven by CEAs at the top end of the wage distribution, our findings are robust to excluding PRP from annual pay.
Supplementary material
Supplementary material is available on the OUP website. It contains the online appendix and replication files. The data used in this article are available from the UK Data Service: https://beta.ukdataservice.ac.uk/datacatalogue/studies/study?id=6689 (ASHE) [Accessed 8 November 2023] and https://beta.ukdataservice.ac.uk/datacatalogue/series/series?id=2000026#!/access-data (QLFS) [Accessed 8 November 2023].
Funding
Not applicable.
Conflicts of interest
Ezgi Kaya has no declaration of interest. Melanie Jones is a member of the DDRB which advises government on the pay of doctors and dentists. This article is, however, written in a personal capacity and should not be taken to represent the views of the DDRB.
Acknowledgements
A previous version of this article was circulated with title ‘The Gender Pay Gap in UK Medicine’. This work is based on data from the Annual Survey of Hours and Earnings (ASHE) and the Quarterly Labour Force Survey (QLFS), produced by the Office for National Statistics (ONS) and supplied by the UK Data Archive. ASHE is accessed via the Secure Data Service (SDS), and we are grateful for their support. These data are Crown Copyright and have been used by permission. The use of these data in this work does not imply the endorsement of ONS or the SDS in relation to the interpretation or analysis of the data. This work uses research datasets which may not exactly reproduce National Statistics aggregates. We are grateful to two anonymous referees, Aoife McDermott, John Heywood, Carl Singleton, Vicki Wass, and Carol Woodhams for useful comments on an earlier draft.
