


Abstract
This paper studies the impact of short-term migratory movements by parents on the educational outcomes of teenagers in a region of Poland. Using survey and administrative data for lower secondary pupils, the empirical approach exploits variation in emigration within families over time. Estimates suggest that parental employment abroad has small, positive or no impact on pupils’ grades, depending on circumstances surrounding the migration experience. Parental education, family situation, the economic environment and duration of the migratory spell are pivotal to outcomes. No negative effects are found, which contradicts the general public opinion in Poland that migration is detrimental to children’s education.
1. Introduction
The European Union enlargements from 2004 onwards triggered new migration flows within Europe. In 2014 almost 3% of EU countries’ residents were nationals of another member state (Eurostat, 2015). An increasing number of households send a member abroad rather than move as a family. A significant proportion of these families come from Poland; it is estimated that in 2009 Poles were the fourth largest national group residing in other EU countries, accounting for 4.6% of all foreign born (Eurostat, 2015). In 2011 almost 10% of all Polish households had a temporary emigrant abroad (The Central Statistical Office of Poland, 2012).
Large scale parental emigration raises questions about the impact it may have on children. There are concerns that family separation negatively affects the welfare and long-term socio-economic outcomes of children, nicknamed by some ‘Euro-orphans’ (Connolly, 2015).
There is, however, very limited quantitative evidence for Europe to verify these worries. The growing economic literature on the effects of parental migration on educational attainment of children who stay in the home country focuses predominantly on traditional sending regions, which differ significantly from the newly emerged EU source countries. The opportunities abroad faced by these migrants are rarely comparable. These distinct circumstances may alter the effect of parental foreign employment on children’s outcomes, necessitating further research.
In this paper I provide new empirical evidence on the impact of parental emigration on grades of pupils whose parents work abroad (PWA) using data from the Opolskie region of Poland in fixed effects regressions.
I offer two contributions to the literature. Firstly, I consider a high migration region in Poland—the largest sending country within the European Union. To the best of my knowledge, with exception of a few studies which focus either on non-educational outcomes (Boehme, 2015) or utilise imperfect measures of academic performance (Giannelli and Mangiavacchi, 2010; Gassmann et al., 2013; Botezat and Pfeiffer, 2014), no similar analyses in the European context have been undertaken.
Secondly, I employ a new data set which I collected—Migration and Education of Children in Poland, 2012 (MECP2012)—combining retrospective survey and administrative school data. It contains school performance, family migration and household information for over 2,800 16-year-olds. Importantly, every pupil’s average grade and information regarding parental migration are recorded for each semester of a three year period spent in lower secondary education. It is rare for data to contain both of these measures.
The panel data structure and the information collected allow for the following: use of a suitable measure of school performance, exploration of heterogenous effects of parental migration and use of fixed effects regressions to uncover a causal relationship.
The access to pupils’ grades is essential to establishing the effect. In the European context, parental emigration is unlikely to lead to school dropouts, which is how educational attainment is usually captured in empirical studies. Dropping out of school is rare in Poland where, complying with the compulsory schooling requirement, 95.1% of 16- to 18-year-olds were in full-time education in 2011 (The Central Statistical Office of Poland, 2012). Emigration is therefore more likely to impact school grades. Grades for lower secondary schooling capture pupils’ performance well. This is thanks to the standardised curriculum, the fact that all subjects are compulsory and teacher allocations are fixed over time. Additionally, class composition is set, and changes due to student dropout, grade retention and school transfers are rare. As a result pupils cover the same material with the same group of peers and are assessed by the same teacher across years.
The rich nature of the data provides context to the migratory movements and permits analysis of circumstances conditioning the overall outcome. Specifically, I explore the role played by parental education, family structure, duration of parental absence and the local labour market.
The fixed effects regression approach accounts for any time-invariant unobserved differences between respondents, confounding the relationship of interest. The effect is identified on comparison of a change in the average grade of a PWA pupil when his or her parent emigrates or returns from migration to a change in the average grade of non-PWA pupils over the same period. I run robustness checks to demonstrate that time-varying unobserved attributes affecting simultaneously the migration decision and pupils’ performance are unlikely to be driving the results.
Establishing causality is important as parental migration features heavily in Polish media and politics (TVP Info, 2018). The public focuses on the fact of family separation and is typically of an opinion that parental migration is detrimental for children. These views are reinforced by reports that children whose parents work abroad feel lonely and struggle with identity, definition of priorities, and educational responsibilities, and these struggles lead to worse school performance (Tynelski, 2010).
However, apart from family separation, parental migration may also increase household income and change the family’s perception of the value of education. The overall effect therefore depends on the balance between various factors and does not need to be negative.
Rather than a true causal relationship, what people observe may be a reflection of selection into migration. In Poland parents from lower socio-economic backgrounds engage more frequently in international migration and at the same time their children are typically performing worse at school due to their home environment rather than migration per se.
In this analysis OLS regressions reaffirm the generally held view that parental migration is negatively associated with school performance. After correcting for time-invariant unobserved heterogeneity I find that pupils with a parent abroad have on average 6.4% of a standard deviation higher grades than their counterparts. However, the coefficient is only weakly statistically significant and may be providing an upper bound on the effect. The overall impact masks significant heterogeneity. The biggest gains are made by PWA pupils whose fathers have completed at least high school education (34% of total), who have not faced additional responsibilities due to migration and live in areas of high unemployment. Furthermore, the effect surfaces for those whose parents spent more than two out of six semesters abroad. Importantly, I find no evidence for negative impacts of parental migration.
The paper is structured as follows. In Section 2 I briefly discuss relevant literature and the Polish context. In Section 3 I present data and descriptive statistics, followed by empirical framework in Section 4 and results in Section 5. I then discuss identification concerns and conclude in Section 7.
2. The effect of parental migration on children’s attainment
2.1 Related literature
Economic literature to date provided evidence of both negative (Gibson et al., 2011; McKenzie and Rapoport, 2011; Antman, 2012) and positive or no impacts of parental foreign migration (Yang, 2008; Antman, 2011a). It is context-dependent; the effect of parental migration depends on the circumstances surrounding the experience (which parent leaves, gender of the child, timing and duration of the migration spell, etc.), specifics of both source and destination countries and the data used in the investigation. In fact, different conclusions may be reached for specific subgroups within the same country, as is the case for Mexico in Antman (2011a, 2012). A very comprehensive review of the relevant studies can be found in Antman (2013).
The literature has mostly focused on American and Asian countries (Yang, 2008; Cortes, 2015). Only a few analyses considered migratory movements in the European context. The European context is rather unique; movement across borders and employment abroad is unrestricted1 for the citizens of the European Union member states. The distances covered are small in comparison to those already studied in the literature and have additionally ‘shrunk’ in recent years thanks to the expansion of cheap flights across Europe. These circumstances encouraged new migratory movements—repeated, temporary and relatively short-term—allowing the migrant to maintain close contact with the family in the home country. Impacts of such flows are likely to be different from the cases studied so far due to a lowered burden of family separation.
The few studies for European countries focus either on non-educational outcomes of children or utilise imperfect measures of academic performance. For example, Giannelli and Mangiavacchi (2010) and Gassmann et al. (2013) analyse school enrolments and Botezat and Pfeiffer (2014) consider school grades, but their measure is self-reported by pupils. Furthermore, Botezat and Pfeiffer (2014) consider only migratory movements longer than 12 months and cannot analyse the role of timing of migration due to the cross-sectional nature of their data. Data combining both robust measures of educational performance and the family migration (along with its timing) are simply largely non-existent. Therefore, despite the increase in the phenomenon, the evidence on its effects is still scarce and in case of Poland, there is none.
2.2 Channels of the effect in the Polish context
2.2.1 Income gains
The overall effect of parental employment abroad is not obvious a priori. Employment-related migration typically results in remittances, which increase the household budget and may benefit the child’s education directly via monetary investments or indirectly by eliminating the need for children to engage in labour (Yang, 2008).
Migrating Polish parents stand to make substantial gains from employment abroad. According to Polish statistics, 73% of temporary migrants have left Poland to work abroad (The Central Statistical Office of Poland, 2013a). Of those, almost a third were seeking better wages. Polish migrants’ employment abroad can potentially lead to an average three- to fourfold increase in earnings, depending on the nature of the job. Even if temporary migrants work abroad in jobs below their qualifications and earn up to a third less than natives (Barrett and McCarthy, 2007), there are still financial gains to be made, increasingly so the higher the migrant’s education level. Jończy and Rokita-Poskart (2013) estimate that in 2010 remittances from abroad amounted to 1.2% of GDP of Opolskie, the region studied.
2.2.2 Family separation
At the same time parental migration leads to family separation. This results in lower time inputs from the absent parent and an increased burden on the family members remaining at home. Children may then be negatively impacted emotionally, due to increased amount of housework or the need to engage in paid employment. This may have a knock-on effect on their school performance.
Policy reports for Poland heavily emphasise the aspect of family separation. However, its negative effect may be mitigated by the nature of Polish migration. According to Walczak (2010) only 3.2% of Polish PWA pupils experience separation of more than 12 months from the migrant parent. The majority are exposed to short-term migratory movements. This is also what I find in the data (see Section 3)—parents emigrate over short distances and short time periods, often return and have frequent contact with the family. At the same time many mothers in migrant-sending households stay at home, caring for children. If only one parent emigrates and the other stays at home with the family, children may not be faced with any additional responsibilities. In fact, only 27% of surveyed PWA children indicated that their responsibilities increased as a result of parental departure.
One may also argue that, if emigration is triggered by unemployment, the family separation may not have such detrimental impacts. For instance, imagine a family where both or one parent is unemployed prior to emigration and the unemployment not only negatively affects the family finances, but also introduces tension into the household. Then one parent’s employment abroad may be a better alternative, even if it leads to separation.
2.2.3 Who runs the house
Parental departure may also change the balance of bargaining power within a couple. Now the parent remaining at home with children is in charge of the household finances, which may result in redirection of funds (Antman, 2011a). In the Polish case, where PWA pupils are usually looked after by their mothers, more money may be invested in their education.
2.2.4 Social remittances
Social remittances constitute another channel of impact. New ideas and practices may be brought by immigrants to and from the destination country (Levitt and Lamba-Nieves, 2011). Newly acquired norms can change migrant parents’ and their children’s perception of returns to education. This can affect pupils’ motivation to study and result in a different level of investment made by parents in their skills. The direction of this effect depends on the demand for labour in destination countries, perceived returns to education at home and abroad and what the migration plans of the family are (Kandel and Kao, 2001).
2.3 Conditioning circumstances
The importance of each mechanism described above will depend on the family’s situation prior to emigration and how the experience is managed. Differences may emerge depending on parental education, family composition or the labour market opportunities at home. The length of migration spell is also likely to play a role.
2.3.1 Parental education
As the education level of migrant parents increases, the more likely they are to be employed in better paying jobs and to earn higher wages abroad. Thus better educated migrants are likely to remit more.
More educated parents may be more pro-active in mitigating the negative consequences of family separation (by staying at home and spending more quality time with children). They may also prioritise education and spend a higher proportion of income on schooling or engage in activities ensuring good school performance (Carneiro et al., 2013). The argument is even more appealing if children of educated parents perform better than their peers already prior to migration.2 Then any further investments made in their education may yield higher returns.
Better educated parents are also more likely to assimilate in the destination countries (Card, 2005) and benefit from exposure to different cultures, a more diverse network of contacts and better access to the labour market. This gained cultural capital may raise their ambitions for their children (Boehme, 2015).
Overall one may expect PWA pupils of more educated parents to be either less negatively affected or to benefit more from migration.
2.3.2 Family structure
Family composition may also play a role; for example, the burden of having a parent abroad may be lessened in larger families. Any additional responsibilities can be shared between more household members and relatives may help children cope better with the emotional impact of separation. Migration can also change roles within the household, leading older siblings to support and positively influence on the younger ones (Biavaschi et al., 2015).
2.3.3 Neighbourhood characteristics
If going abroad is the way out of unemployment in the region, family separation may be a relatively small price to pay, lowering the burden of emigration. At the same time, the increase in income will have a greater positive impact on families with a particularly difficult financial situation.
2.3.4 Duration of migration spell
The patterns of parental migration in the sample are very diverse. Thus the length of time spent abroad may alter outcomes. On the one hand, short absences help maintain contact and stronger bonds with the family, mitigating the separation effect. At the same time, however, the financial gains in these cases are likely to be lower than if the parent stayed abroad for a longer period.
3. Data and descriptive statistics
The MECP2012 data set combines administrative information about school performance of pupils (provided by participating schools) with survey responses about migration experiences and the structure and socio-economic background of families of 16-year-olds in Opolskie, a region of Poland. It contains information about 2,822 individuals over a period of six semesters from September 2009 to June 2012, which they spent in lower secondary school. In what follows I provide some background for the data. Full details about the data collection process and the data set can be found in the Online Appendix.
3.1 Education system in Poland
The Polish education system comprises three compulsory stages—primary (seven- to 12-years-old), lower secondary (13- to 15-years-old) and upper secondary (16- to 18-years-old)—and obliges pupils to attend school full time until the age of 18. During the first two stages a common national curriculum is followed with a set of obligatory subjects, leaving pupils no choice over the courses they take. Once enrolled at school, pupils are allocated to classes and taught in the same group and by the same teachers throughout their entire duration of a given stage. Tracking begins at the third stage of education when pupils are 16-years-old.
3.2 Opolskie province
Opolskie is a province in southern Poland, along the border with the Czech Republic and in close proximity to Germany, with a population reaching just over 1 million inhabitants (see Fig. 1), spread across the region’s 12 counties. According to the National Statistical Office of Poland, the registered unemployment rate in the area in 2012 was 14.4% (compared with 13.4% for Poland as a whole) and the region contributed 2.1% to the Polish GDP with a GDP per capita in Opolskie equal to 80.1% of the Polish GDP per capita (The Central Statistical Office of Poland, 2013b). With 107,985 residents of Opolskie residing temporarily abroad for at least 3 consecutive months, the region had the highest proportion of temporary emigrants per 1,000 inhabitants in the entire country in 2011. Of them 94.5% emigrated to other EU countries, almost 62% to Germany. As a result, 17.8% of all households in the region had at least one emigrant at the time of the 2011 Census.
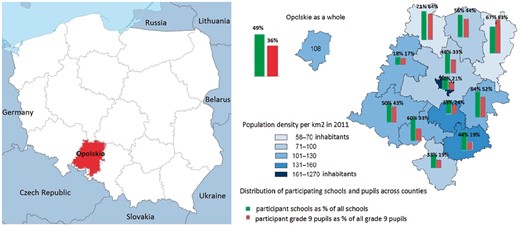
Location of Opolskie and map of school responses.
Source: Opole Education Board 2012, Census 2011 and own calculations.
3.3 MECP2012
The data come from 52 lower secondary schools in Opolskie and capture 2,822 respondents, observed over a period of 6 semesters between September 2009 and June 2012. The administrative information comprises grades, class allocations and absences of all enrolled pupils (i.e. survey respondents and non-respondents). In 13% of cases there is also information about the pupils’ individual scores in the national examination in Polish language and maths, which is taken in the last month of the final semester. Information about the student’s age, gender, nationality, number and age of siblings, parents’ age, education level and employment status as well as migration by a family member and its timing has been collected via a student survey.
I exclude from the analysis pupils for whom the detailed account of timing of parental migration over the three-year period is unavailable or whose parents were abroad during semester 1. In these cases it is not clear when exactly migration occurred. The final sample contains 2,466 16-year-old individuals in 159 classes within 52 schools.3
The class groupings are set prior to semester 1 and do not change over time. Any unplanned alterations to class composition are observed as schools provided complete register and academic performance information for all students in the cohort. Therefore any student disappearing from or appearing newly in the data can be identified. The fluctuations in class composition do not exceed 7% of the sample (see Panel B of Table 2) and occur mostly due to grade retention. For this reason, pupils disappearing from the register have on average lower grades than the remainder of the sample. Nonetheless, as I discuss in robustness checks, these differences are unlikely to have bearing on the results of the analysis.
The collected sample is representative of the population of interest—pupils in the region in lower secondary education with parents temporarily working abroad. The families captured in the sample are comparable in observed characteristics to all migrant households in Opolskie (see Section 3.5).
There are also no signs of self-selection into the study of either schools or pupils within the participating schools. In particular, participant schools are equally spread across counties of the province and capture high emigration counties in the region well (see Fig. 1). All areas are also similar in terms of the local economy.4 Furthermore, the participant and non-participant schools do not differ in terms of average quality (see Table 1), as measured by the average pupil performance of the studied cohort in the national exit exams and the schools’ Educational Value Added (EVA).5
Quality of participant and non-participant schools
| Non-participant schools | Participant schools | ||||
|---|---|---|---|---|---|
| mean | st. dev. | mean | st. dev. | t-stat | |
| Cohort size | 78.01 | 41.78 | 66.92 | 34.55 | 1.50 |
| School-level average test scores | |||||
| Polish | 63.96 | 6.28 | 64.29 | 6.69 | −0.26 |
| History | 59.18 | 6.5 | 60.21 | 6.28 | −0.83 |
| Maths | 47.08 | 7.68 | 47.42 | 8.65 | −0.21 |
| Science | 49.2 | 5.02 | 49.68 | 6.14 | −0.45 |
| Overall Score | 54.85 | 5.89 | 55.40 | 6.56 | −0.45 |
| Educational Value Added (EVA) of schools 2010-2012 | |||||
| EVA Science & Maths | −0.14 | 0.24 | −0.27 | 0.29 | 0.34 |
| EVA Polish & History | −0.37 | 0.23 | −0.78 | 0.27 | 1.15 |
Source: school level average test scores—Opolskie Education Board; Educational Value Added for all schools in the region over the period 2010–2012—the Institute of Education Studies (IBE), Poland. Own calculations.
On average 82% of the enrolled cohort participated in the study. Based on administrative information provided by schools, non-respondents performed significantly worse academically relative to the survey respondents (see Table 2). This is not surprising given that majority of non-response is due to absence at school and school attendance is strongly correlated with academic performance. The non-response rate poses a threat to internal validity of the results if the unobserved students are more likely to have experienced parental migration. In robustness checks I demonstrate that this is unlikely to be the case and that conclusions of this study would not be invalidated even if all non-respondents were children of migrants. For the sake of space the questionnaire and detailed data validity checks are deferred to the Online Appendix.
Sample description
| Panel A: Sample size | ||||
|---|---|---|---|---|
| n | % | |||
| Number of registered students | 3,423 | |||
| Number of surveyed students | 2,822 | |||
| Final sample size (full migration history) | 2,466 | 100 | ||
Panel B: Class composition changes over three-year period | ||||
| n | n | |||
| Number disappear from register: | 229 | Number appear in register: | 109 | |
| Due to: | ||||
| Unknown reason | 67 | unknown reason | 106 | |
| Grade retention | 159 | |||
| School transfer | 2 | school transfer | 3 | |
| Death | 1 | |||
Panel C: Outcomes of respondents and non-respondents | ||||
Respondents | Non-respondents | |||
| mean | st. dev. | mean | st. dev. | t-stat |
| 3.61 | 0.85 | 3.41 | 0.85 | 4.99 |
Panel D: Pupils from migrant households (irrespective of the exact timing) | ||||
| n | % | % | ||
| Total sample | 2,466 | 100 | ||
| Migrant parents—total | 281 | 11 | 100 | |
| Who emigrated: | ||||
| Only father | 173 | 7 | 62 | |
| Only mother | 64 | 3 | 23 | |
| Mother and father | 44 | 1 | 15 | |
Panel E: Timing and overall duration of migratory movements | ||||
| n | n | |||
| Away in semester 2 | 195 | Away for 1 semester | 84 | |
| Away in semester 3 | 180 | Away for 2 semesters | 59 | |
| Away in semester 4 | 174 | Away for 3 semesters | 33 | |
| Away in semester 5 | 192 | Away for 4 semesters | 28 | |
| Away in semester 6 | 194 | Away for 5 semesters | 14 | |
Panel F: Number of departures and returns from migration | ||||
| One departure | 134 | One return | 128 | |
| Two departures | 36 | Two returns | 45 | |
Panel G: Frequency of meetings with the migrant parent | ||||
| with mother | with father | |||
| Once a month | 76% | 74% | ||
| Every six months | 17% | 18% | ||
| Every year | 5% | 2% | ||
| More rarely | 2% | 7% | ||
Note: the statistics in Panel E are derived from responses of 89% of children with migrant parents. Source: MECP2012, own calculations.
3.4 Variable definitions
I define a PWA child as a child who has had at least one parent abroad at the beginning of a given semester and stayed in the home country during the parental emigration experience. Given such a definition, one may have one or both parents abroad at the same time; moreover, a migrant parent may be absent in one semester and return to Poland in another and this change will be reflected in a change in the PWA child status.
The main dependent variable is the grade of a pupil. The grade is taken as an average over all courses taken in a given semester and is measured at the end of each semester. It ranges from 1 to 6, with 6 being a top mark awarded to a pupil for extracurricular achievement in the subject area. Pupils who mastered 100% of the curriculum in a given semester are usually awarded 5; 1 is a fail mark. The grade is awarded internally but based on the requirements of the national curriculum for a given year. The average grade in the sample has a mean of 3.61 and a standard deviation of 0.85.
Only once, before progressing to the upper secondary school, do pupils write the national exams in the following areas: Polish language and literature, history, maths, science and foreign languages. They are organised nationwide by one Exam Board and blind-graded in percentage terms. Exam results are available for under 13% of the sample. It is insufficient for the main analysis but is used when verifying how well average grades measure performance (see Section 6 and Online Appendix).
3.5 PWA families in Opolskie
The migration status can be identified from two variables in the questionnaire: about family having experienced migration in the three-year period and the exact timing of migration. Based on having a migrant parent at any time during the observed period PWA children constitute 11% of the sample (see Table 2). The number of PWA children in the sample at given time t is lower than the overall measure.
The migratory movement is father dominated and a respondent indicated having both parents abroad in only 44 cases. The main receiving country in the sample is Germany, followed by the Netherlands and the UK, which points to the fact that emigration occurs over relatively short distances with the possibility of frequent returns.
Parental migratory movements can be grouped into two patterns. There are parents who left for emigration during the observed period and have since been absent and those who experience short, repetitive migration spells. Almost half of the migrant parents spent at most a year abroad over the observed three year period.
It can also be inferred from the questionnaire that parents most likely migrate for short periods of time, rather than commute across the border.6 When asked about the frequency with which they see their migrant parents, 76% and 74% of PWA children indicated that they see their mothers and fathers, respectively, once a month. Over 17% said that they see the migrant parent once every six months. PWA children seeing the migrant parent once a year or even more rarely constitute a much smaller group (see Panel G of Table 2).
Overall, migration observed in the sample is characterised by short-term, circular movements, with respondents having frequent contact with the migrant parent. These features distinguish the new European migration spells from those commonly analysed in the literature.7
Migrant and non-migrant families differ in terms of socio-demographic characteristics. Children from migrant families have on average more siblings (1.76 versus 1.62). Migrant parents are low-skilled with 46% of mothers and 65% of fathers having finished vocational schooling, and 38% of mothers and 30% of fathers high school. A greater proportion of migrant families live in counties with below voivodship average unemployment rate, which may be a reflection of high outmigration rates from the areas. The patterns and family characteristics observed in the data are in line with the 2011 Census output and the literature on Polish emigration (Kaczmarczyk and Okolski, 2008; The Central Statistical Office of Poland, 2013a). Thus the data seem to accurately reflect the reality, lessening concerns about potential reporting errors respondents could have made. Measurement errors and recall bias would be problematic if they were frequent and not random.
Performance of children also differs across the two groups. Children from migrant families obtain on average 0.15 lower average grade than children from non-migrant families (see Table 3). Nonetheless, PWA pupils are equally likely to score below or above the class average grade as their non-PWA peers.
Characteristics of children and households in the sample
| PWA pupil (n = 281) | Non-PWA pupil (n = 2,185) | |||
|---|---|---|---|---|
| mean | st. dev. | mean | st. dev. | |
| Number of siblings | 1.76* | 1.21 | 1.62 | 1.12 |
| Mother’s age | 40.26* | 5.49 | 41.37 | 5.57 |
| Father’s age | 43.13 | 6.13 | 43.90 | 5.74 |
| Child’s average grade | 3.50* | 0.84 | 3.65 | 0.85 |
| Pupils with grade below class average | 46% | 46% | ||
| Pupils with grade above class average | 54% | 54% | ||
| Mother’s education | mean | st. dev. | mean | st. dev. |
| Primary | 0.06 | 0.24 | 0.11 | 0.31 |
| Vocational | 0.46* | 0.50 | 0.38 | 0.49 |
| Secondary | 0.38 | 0.49 | 0.37 | 0.48 |
| Tertiary | 0.15* | 0.36 | 0.24 | 0.43 |
| Mother works | 0.69 | 0.46 | 0.72 | 0.45 |
| Father’s education | mean | st. dev. | mean | st. dev. |
| Primary | 0.04 | 0.20 | 0.11 | 0.31 |
| Vocational | 0.65* | 0.47 | 0.52 | 0.5 |
| Secondary | 0.30 | 0.46 | 0.32 | 0.47 |
| Tertiary | 0.04* | 0.20 | 0.15 | 0.36 |
| Father works | 0.91 | 0.27 | 0.91 | 0.29 |
| % respondents female | 0.58* | 0.49 | 0.51 | 0.5 |
| Living in counties with lower than voivodship unemployment rate | 56% | 44% | ||
| Living in counties with higher than voivodship unemployment rate | 44% | 56% | ||
Note: * next to means indicate that the mean is statistically significantly different from that of the non-PWA group.
Source: MECP2012, own calculations.
4. Empirical framework
The parameter of interest, β1, is identified on variation in parental migration within families over time. The individual fixed effects control for any unobserved individual level characteristics which do not vary over time. This isolates any confounding effect these factors may have on the parameter of interest, if they are correlated with the emigration status in the family and the school performance of children. Parental education or socio-economic characteristics of the household are an example of such time-invariant factors; from the summary statistics it is clear that low-skilled parents engage in temporary employment abroad more often than parents with higher qualifications. At the same time, one may argue that children’s school performance is likely to be correlated with educational attainment of their parents. Hence, children of low-skilled parents are likely to perform worse at school and to have a parent abroad.
The county-specific time-varying controls capture changes in the areas where schools are located which may affect the parental decision to migrate and coincide with educational performance of pupils.
The semester fixed effects control for changes in grades over time which are common to all pupils, accounting for the fact that the material studied becomes more difficult with time. Since the pupils’ performance is tracked over a three year period, some change in pupils’ grades may be attributable to the advancement in their studies and not to other circumstances.
I present results of OLS regressions with individual and county level controls and school and semester fixed effects alongside the preferred specification to demonstrate the extent to which unobserved time-invariant heterogeneity plays a role in this context.
5. Results
5.1 Baseline
The OLS regressions without individual fixed effects (Table 4, columns [1]–[2]) produce negative, statistically insignificant coefficients on emigration, varying between −0.052 and −0.120. As discussed before, these estimates are biased.
Effect of parental migration on a child’s average school grade
| Dependent variable | pupil’s average grade in semester t | ||||||
|---|---|---|---|---|---|---|---|
| OLS | OLS | FE | FE | FE | FE | FE | |
| (1) | (2) | (3) | (4) | (5) | (6) | (7) | |
| EmigrParentit | −0.052 | −0.120 | 0.054** | 0.033 | 0.051* | 0.019 | −0.020 |
| (0.076) | (0.074) | (0.027) | (0.053) | (0.030) | (0.029) | (0.030) | |
| EmigrParentit and female | 0.038 | ||||||
| (0.061) | |||||||
| 0.069** | 0.053 | 0.031 | |||||
| (0.032) | (0.040) | (0.045) | |||||
| 0.034 | 0.002 | ||||||
| (0.042) | (0.049) | ||||||
| 0.029 | |||||||
| (0.048) | |||||||
| Controls | |||||||
| Individual | No | Yes | No | No | No | No | No |
| County | No | Yes | Yes | Yes | Yes | Yes | Yes |
| Semester FE | No | Yes | Yes | Yes | Yes | Yes | Yes |
| Individual FE | No | No | Yes | Yes | Yes | Yes | Yes |
| R2 | 0.000 | 0.256 | 0.120 | 0.119 | 0.151 | 0.225 | 0.227 |
| n | 2,466 | 2,466 | 2,466 | 2,466 | 2,466 | 2,466 | 2,466 |
Notes: All regressions use only observations for pupils whose parents were present at home in semester 1. Individual controls include the pupil’s gender, number of siblings, parents’ age, employment and education level, whether parents divorced or one parent died and school dummies. County level time-varying characteristics include unemployment rate. Standard errors clustered at individual level in parentheses. Statistical significance: *** 1 % ** 5% * 10%.
Source: MECP2012.
The individual fixed effects estimate in the contemporaneous regression in column (3) implies an overall small, positive impact which is marginally statistically significant; parental absence in semester t is associated with an increase in the average grade of 0.054, an equivalent of 6.4% of its standard deviation. Furthermore, the estimates in columns (5)–(7) including combinations of lags of parental migration variable support the idea that the effect is immediate or almost immediate (i.e. occurring within six months of parental departure). For instance, when the first lag of migration variable is included, the contemporaneous coefficient remains positive but becomes insignificant and the coefficient on the first lag is statistically significant. The two migration coefficients are also jointly statistically significant. This is suggestive of the effect being delayed by one semester. The regression results including further migration lags produce insignificant coefficients. Nonetheless, they demonstrate two points: firstly, no delayed negative effects emerge and secondly, the positive effect is not sustained over longer period. I find no evidence of differential impact by gender.
These findings are suggestive of the opposing mechanisms of increased household income, social remittances and family separation cancelling each other out.
5.2 Heterogenous effects
I also run a regression splitting the parental migration experience across three dummy variables—if the parent was abroad for one semester, two semesters or longer—and keeping the specification unchanged otherwise to explore the role of duration in the overall outcome. All results are presented in Table 5.
Family and local area characteristics
| Dependent variable: | pupil’s average grade in semester t | ||||||
|---|---|---|---|---|---|---|---|
| Education | Responsibilities | Grades | Labour market | First-born | Siblings | Duration | |
| (1) | (2) | (3) | (4) | (5) | (6) | (7) | |
| EmigrParentit | 0.016 | 0.073*** | 0.060 | 0.089** | 0.095** | 0.049 | |
| (0.030) | (0.037) | (0.047) | (0.043) | (0.037) | (0.047) | ||
| EmigrParentit and father high school | 0.092* | ||||||
| (0.052) | |||||||
| EmigrParentit and extra responsibilities | −0.045 | ||||||
| (0.054) | |||||||
| EmigrParentit and below average grades | −0.008 | ||||||
| (0.056) | |||||||
| EmigrParentit and below average unemployment | −0.070 | ||||||
| (0.053) | |||||||
| EmigrParentit and first born | −0.094* | ||||||
| (0.053) | |||||||
| EmigrParentit and number of siblings | 0.002 | ||||||
| (0.020) | |||||||
| Abroad for one semester | 0.030 | ||||||
| (0.044) | |||||||
| Abroad for two semesters | 0.051 | ||||||
| (0.051) | |||||||
| Abroad for longer | 0.095** | ||||||
| (0.040) | |||||||
| Full controls | Yes | Yes | Yes | Yes | Yes | Yes | Yes |
| R2 | 0.120 | 0.120 | 0.120 | 0.120 | 0.120 | 0.120 | 0.120 |
| n | 2,466 | 2,466 | 2,466 | 2,466 | 2,466 | 2,466 | 2,466 |
Notes: All regressions use only observations for pupils whose parents were present at home in semester 1 and regressions include individual and semester fixed effects as well as county time-varying characteristics.
In column (1) the interacted variable is a dummy equal to 1 if respondent’s father has completed at least high school education.
In column (2) the interacted variable is a dummy equal to 1 if the pupil stated that he/she has more responsibilities at home as a result of parental emigration.
In column (3) the interacted variable is a dummy equal to 1 if the pupil’s average grade in the first observed semester was below the class average in that semester.
In column (4) the interacted variable is a dummy equal to 1 if the pupil lives in a county with the unemployment rate below the voivodship average in the first observed period.
In column (5) the interacted variable is a dummy equal to 1 if the pupil has no siblings or has younger siblings (i.e. is the first born in the family).
In column (6) I present results of regression where emigration dummy was interacted with dummies indicating the number of siblings a pupil has (one, two, three or more).
In column (7) the migration experience is split across three dummy variables, reflecting the duration of the migration spell.
Standard errors clustered at individual level in parentheses. Statistical significance: *** 1 % ** 5% * 10%.
Source: MECP2012.
A few patterns emerge. Firstly, I conclude that PWA pupils whose fathers have lower than secondary education have comparable grades to their non-PWA equivalents. The finding is important as these students dominate the overall group of pupils with parents working abroad. Furthermore, PWA pupils whose fathers have at least secondary education have on average 0.092 better grade than their non-PWA peers whose fathers have similar education level. This is equivalent to 11% of a standard deviation. This finding is consistent with the hypothesis that better educated parents have a greater income potential and make greater investments in their children’s education. I cannot differentiate between the two justifications.
Further, experiences abroad do not affect pupils differently, depending on how well they did at school prior to parental departure.
The results support the supposition that families mitigate the negative effect of separation. Firstly, the positive effect is visible for the group of PWA pupils who reported not having additional household responsibilities as a result of parental emigration (73% of the total). This is consistent with the argument that the negative effects of emigration emerge when children take on parental roles within the household following a migration event (Antman, 2013).
Additional responsibilities, if any, are likely to fall onto older siblings in the household. Indeed, I find that the benefits of parental migration accrue to pupils who are not first-born among the siblings.
Furthermore, the overall effect is driven by the 44% of PWA pupils who live in areas with above average unemployment rates. This is consistent with the argument that employment and income opportunities abroad are a major factor in parental emigration decisions and that returns to migration experience depend on available alternatives.
The positive effect of parental migration is driven by the group of pupils whose parent has spent more than two semesters abroad. This may be because one or two semesters is not long enough for the income increase to be significant; remittances may be low immediately after a parent leaves, as time is needed for the parent to find a job and settle in the new environment (Antman, 2011b).
The analysis shows that an average PWA pupil may benefit from parental employment abroad. The biggest gains are made by pupils whose parents are sufficiently highly educated, who have not faced additional responsibilities as a result of parental migration and in cases when the parent has been abroad sufficiently long to benefit financially. It is important to note that, although not all PWA children benefit from parental emigration, none seem to have been negatively affected in terms of their school performance.
6. Robustness checks
Despite inclusion of fixed effects and additional time-varying controls, one may have concerns about whether the results presented in the previous sections are causal; two main reasons for that could be reverse causality and omitted variable bias driven by time-varying unobserved characteristics of the households.
6.1 Reverse causality
Arguably the educational attainment of children may trigger a migration event rather than the other way round. A particular worry may be that a student’s good performance at school encourages parents to emigrate or the child’s worsening grades trigger return migration. This is unlikely in the Polish situation.10 Nonetheless, as a robustness check I follow Wooldridge (2002) and run regressions including leads and lags of the emigration variable (see columns [7]–[9] of Table 6 and the Online Appendix for technical details) to verify that the assumption of strict exogeneity, conditional on the unobserved time-invariant characteristics, holds in this context; the insignificant coefficients on leads of migration variable confirm that strict exogeneity holds and that the current school performance of pupils does not feed into migration decisions of the family in the future. The insignificant coefficients on lags of the migration variable demonstrate that past migration experiences alone do not explain current school outcomes.
Selected robustness checks
| Dependent variable | pupil’s average grade at time t | ||||||||
|---|---|---|---|---|---|---|---|---|---|
| Baseline FE | LDV | PWA subsample | Baseline FE | LDV | PWA subsample | Leads and lags | |||
| (1) | (2) | (3) | (4) | (5) | (6) | (7) | (8) | (9) | |
| EmigrParentit | 0.054** | 0.025 | 0.046 | −0.019 | 0.009 | −0.021 | 0.073* | 0.106* | |
| (0.027) | (0.026) | (0.029) | (0.030) | (0.030) | (0.032) | (0.035) | (0.044) | ||
| 0.031 | 0.001 | 0.028 | 0.038 | ||||||
| (0.045) | (0.039) | (0.048) | (0.043) | ||||||
| 0.002 | −0.009 | −0.001 | 0.006 | ||||||
| (0.049) | (0.041) | (0.051) | (0.048) | ||||||
| 0.029 | 0.053 | 0.022 | 0.029 | ||||||
| (0.048) | (0.049) | (0.051) | (0.084) | ||||||
| 0.014 | 0.033 | ||||||||
| (0.031) | (0.039) | ||||||||
| −0.018 | |||||||||
| (0.031) | |||||||||
| individual controls | No | Yes | No | No | Yes | No | No | No | No |
| individual FE | Yes | No | Yes | Yes | No | Yes | Yes | Yes | Yes |
| Semester FE | Yes | Yes | Yes | Yes | Yes | Yes | Yes | Yes | Yes |
| County controls | Yes | Yes | Yes | Yes | Yes | Yes | Yes | Yes | Yes |
| n | 2,466 | 2,466 | 281 | 2,466 | 2,466 | 281 | 2,466 | 2,466 | 2,466 |
Notes: All regressions use only observations for pupils whose parents were present at home in semester 1. LDV stands for the Lagged Dependent Variable regression. Individual controls include the pupil’s gender, number of siblings, parents’ age, employment and education level, whether parents divorced or one parent died and school dummies. County level time-varying characteristics include unemployment rate.
Standard errors clustered at individual level in parentheses. Statistical significance: *** 1 % ** 5% * 10%.
Source: MECP2012.
6.2 Time-varying unobserved characteristics
Secondly, household migration decisions—whether to migrate, who to send and how long for11—are often conditional on its unobserved characteristics. These are captured by fixed effects, provided they are time-invariant. However, if family circumstances change over time and affect both the migration decision and the pupil’s performance, then the results will be biased.
For example, if migration is costly, a positive shock may induce migration and lead to better school outcomes. Equally, a negative shock to the family (such as job loss) or region may drive individuals to emigrate and negatively affect children’s outcomes. A shock at a regional level could also trigger a change in the availability and composition of teachers in the region, which may have a direct impact on grades; this is however controlled for thanks to explicit inclusion of county level characteristics in the regression.
I cannot fully rule out the possibility that idiosyncratic household-level shocks explain the results. Nonetheless, neither specific reports for Opolskie (Jończy, 2010) nor the 2011 Census results suggest that unemployment at home is the main driver of migratory decisions. Moreover, such shocks would have to affect a significant proportion of PWA families in a similar way to entirely invalidate the findings. This is unlikely.
I employ three robustness checks to demonstrate that time-varying unobserved characteristics do not pose a threat to identification in this case. Firstly, the aforementioned strict exogeneity test shows that the explanatory variables in a given time period are not correlated with the idiosyncratic errors in any period, which would bias the estimates.
Secondly, I repeat the main analysis using solely observations for PWA pupils. By doing so, I compare changes in grades over time of PWA pupils whose parents already left with those whose parents will leave within the observed period, abstracting from selection into migration. The regression coefficients (see columns [3] and [6] of Table 6), although statistically insignificant due to sample size, closely reflect those presented in the paper, suggesting that migrant selection is not driving the results.
Lastly, I run lagged dependent variable (LDV) regressions (see columns [2] and [5] of Table 6). The past performance variable captures environmental and individual characteristics crucial for future outcomes of pupils and migration decision of parents. Now the decision of parents to emigrate needs to be exogenous only to changes in the school performance, not its overall level. This check is particularly useful because the LDV and the fixed effects models have a bracketing property. This can be informative of the true relationship being analysed (Angrist and Pischke, 2009). The LDV estimates are positive but much smaller in size and statistically insignificant, raising the possibility that migration does not impact pupils’ grades. They constitute a lower bound on the effect. Importantly, there is no evidence of a negative relationship between the two variables.12
Of a lesser concern, but nonetheless deserving of a mention, are two further issues—whether the average grade is a good measure of performance and the effect of non-responses and school dropouts on the results.
6.3 Average grade as a dependent variable
The average grade accurately records a pupil’s performance against classmates. With inclusion of fixed effects, all differences in grading across classes (e.g. due to different teachers) are controlled for. Hence, the grade’s objectivity will be of concern if teachers are inconsistent in their assessment over time and if this inconsistency systematically coincides with parental departures. As a robustness check I run the baseline regression on a subsample of students for whom exam results are available, replacing the average grade with their scores in the national exams at the end of lower secondary school. The results are consistent with these presented in the paper (see the Online Appendix).
6.4 School dropouts or grade retention
Pupils who dropped out of the class before the survey took place or did not participate in the study cannot be fully accounted for in the analysis, although information about their school performance is available.13 As noted in Section 3 they obtain lower grades than respondents. If at the same time they are more likely to have a parent abroad, the regression estimates will be biased. Using school records and information about PWA students in other cohorts, I find no evidence of their over-representation among drop-outs. I then use simulations to estimate the extent of over-representation of PWA pupils in this sample needed to invalidate the results; even assuming that all non-respondents had a parent abroad at some point in the observed period, I find positive, although much smaller and statistically insignificant effect. Importantly, in none of the simulations did the coefficients become negative (for details see the Online Appendix).
7. Discussion and Conclusion
I consider impacts of parental emigration on educational attainment of 16-year-olds. I utilise a unique data set with student-level information about teenagers in a high migration region of Poland and estimate the results using regressions with individual and semester fixed effects. The effect is thus identified on within-family over-time variation in the migratory experience and comparisons with the average grades of pupils whose parents never emigrated. This work is innovative in various ways; the migration pattern under consideration is relatively new. Furthermore, it is explored using new data which allow to capture more accurately both the short-term migration patterns within families and school performance of pupils and are sufficiently rich to uncover a significant heterogeneity masked under the average effects. This is one of the first analyses to acknowledge the different nature of European migration from the labour flows studied to date and to investigate various elements of the complicated temporary migration patterns.
Parental emigration has a small, positive immediate impact on educational attainment of children. This may be thanks to the relatively short-term nature of parental migration in the sample. It is likely to lower any potential burden on PWA children and to more effectively channel positive aspects of international experiences, such as increased income, exposure to other cultures and possibly changed perception of returns to education. I also find no evidence of any delayed impacts.
Although no one seems to lose out, not everyone benefits. The greatest gains are made by children whose migrant parents are at least high school graduates. More importantly, PWA children whose parents have lower than secondary education do not improve their performance as a result of their parents’ emigration, relative to their peers of similar socio-economic background. I associate it with a different allocation of household resources and parental involvement in child’s education, depending on the parents’ own education level as well as differential experiences and income opportunities abroad.
The findings are consistent with the hypothesis that households can mitigate the negative consequences of family separation and increase the overall benefits. I find that the biggest beneficiaries are pupils who do not report having any additional responsibilities as a result of parental employment abroad and who are not first-born. They are the least likely within the household to be asked to take on parental duties and most likely to receive additional support from the family.
I also find that bigger gains are made by pupils who live in areas with above average unemployment levels. These results emphasise the role socio-economic background plays in shaping potential costs and benefits of migratory movements.
Lastly, I establish that migration spells longer than a year result in greater grade improvements. This indicates that employment abroad needs to last sufficiently long to create significant benefits.
The lack of negative impact is consistent with the story provided by Botezat and Pfeiffer (2014) who argue that migration spells of at least 12 months positively affect Romanian teenagers’ GPA scores. It is also in line with the findings by Clifton-Sprigg (2015) who used the same data to consider classroom spillover effects of parental emigration. The fixed effects estimates suggest that the presence of PWA children in the class benefits pupils and that the effect is driven by PWA pupils whose parents are high-school graduates. This seems plausible given that I find a positive immediate effect of parental emigration, which is the biggest for PWA pupils whose parents finished high school.14
My findings contradict a number of outcomes from other studies. The difference between the economic, cultural and social situation in Poland and other source countries is the likely reason behind this. In the Polish case, parental emigration is unlikely to result in school dropouts. Rather, the impact is subtler and limited to an increase in household responsibilities. Moreover, given that within-EU migration is legal and travel to Poland relatively short and affordable, the respondents in my study are in frequent contact with the parent abroad, which mitigates the effect of separation. Contact is also maintained thanks to wide-spread use of internet communication and mobile networks. Additionally, in most cases the emigrant parents leave children with a family member, who takes over parental duties, minimising the negative impact of the departure.
The results presented in this paper may come as a surprise to the Polish public and policymakers. I cannot provide any insights on the impact of family separation on the child’s well-being and it may indeed be negative. However, grades of lower secondary pupils are unaffected by their parents’ migration and the general opinion is most likely reflecting the selection patterns into migration.
The analysis sheds new light on the role migration plays in human capital accumulation. It seems that migratory experiences, which are temporary and rather short-term in nature, and during which only one parent engages in employment abroad, may benefit children staying in the home country. The narrative depends, however, on family circumstances. Therefore, my work also highlights the importance of heterogeneity analysis in this context and of use of an array of approaches to create a comprehensive view of the analysed situation.
Supplementary material
Supplementary material is available on OUP website. These are the data and replication files and the Online Appendix.
Funding
This work was supported by the Innovation Initiative Grant from the Development and Alumni of the University of Edinburgh [grant number GR000441]; and the +3 studentship from the Economic and Social Research Council [grant number ES/J500136/1].
Footnotes
With the exception of transition periods for the new Member States, during which other EU member countries under certain provisions can restrict access to their labour market.
This is the case in the sample; the higher the education level of parents, the better the child’s school performance.
Observations for 356 pupils are effectively dropped from the analysis. This raises concerns about the potential change in the sample composition. I compare the average characteristics of PWA pupils included in this study and those who were dropped from the analysis due to incomplete parental migration history. Statistically significant differences emerge in the following characteristics: number of siblings, father’s age, education of mothers, gender composition of the group. No differences are visible in children’s grades, father’s education levels and employment—these are the characteristics most likely correlated with the migration decision of the family. Subsequently I repeat the analysis using the complete set of observations to verify the results presented in the paper. The conclusions remain unchanged. Summary statistics and regression tables can be found in the Online Appendix
Evidence on economic performance of the local areas is deferred to the Online Appendix.
The national exit exams took place in spring of 2012, were organised by one Exam Board, blind graded in percentage terms and undertaken by the studied cohort in the following four subject areas: Polish language and literature, history, maths and science. The objective was to verify knowledge of the material taught within the common curriculum.
The Educational Value Added is a school quality assessment measure, abstracting from the entry quality of the pupils. For each school the indicator compares pupils’ performance between two national exams—at age 13 (i.e. entry to school) and age 16 (i.e. exit). It reveals how high/low final exam results achieved by the school’s leavers were in comparison to the students in Poland with analogous results. The indicator is relative and equal to zero at the national level. A positive EVA indicates an above-average effectiveness of teaching, while a negative value a lower than average effectiveness. Further details can be found here: https://ewd.edu.pl/en/eva-method-in-poland/, [last accessed 30 April 2018].
The specific wording of the migration question in Polish ensures that pupils whose parents commute across the border do not answer affirmatively.
Earlier studies of migrants from countries like Mexico or the Philippines highlight the fact that children are often left with distant family members for prolonged periods of time with little contact with the migrant parents (See McKenzie and Rapoport, 2011).
Clustering at a different level, e.g. class or school, does not affect the estimation precision significantly. The effects are not nullified and results can be made available.
I focus on father’s education as a proxy for parental education as fathers have higher propensity to migrate. Since parental educational outcomes are highly correlated, this choice is not pivotal and using the mother’s education instead does not affect the results.
Participant schools have disclosed in the survey that parents underestimate the potential negative impacts migration may have on their children and base their decisions primarily on income considerations.
For detailed analysis of these factors in relation to MECP2012 data see Online Appendix.
Given the role potentially played by both lags of the dependent variable and fixed effects, one may also consider implementation of the Arellano-Bond estimator. Arellano-Bond coefficients are comparable to those obtained using LDV regressions and can be made available upon request.
Class drop outs were largely due to grade retention. Most of the others who did not participate in the survey were absent on the day it was conducted.
Parallels can also be drawn with outcomes of studies of single-parenthood and divorce in particular. In this scenario family separation is expected to be the main, if not sole, driving force behind the effect. Hence, there is an expectation of a negative relationship with grades. However, as in migration studies, the effect is confounded by endogeneity of divorce. Indeed, after correcting for selection, divorce has no impact (particularly long-term) on educational attainment of pupils (Corak, 2001; Björklund et al., 2007; Francesconi et al., 2010).
Acknowledgements
Advice given by Maia Güell, Mike Elsby, Steven Dieterle, Kerry Papps, Eleonora Fichera and Jackie Wahba has been a great help in the execution of this project. I would like to thank Agnieszka Kaczor and Karolina Janik for coordination of the data collection in Poland, as well as Anna Szatka, Ksenia Kornacka, Sabina Waluś, Malwina Wyrwich, Anna Maria Lisowska, Anna Kisiel, Henryk Kretek, Sabina Gordzielik, Natalia Lechowicz, Paulina Herba, Iwona Janczyszyn, Martyna Grzyb, Anna Hury, Damian Kolarczyk and Barbara Jankowska for their involvement in data collection in Poland. I thank participants of NORFACE Migration Conference, 6th Migration and Development Conference, IZA Brown Bag seminar, 2014 RES Annual Conference and Barcelona GSE Summer School as well as two anonymous referees and the editor for helpful comments.
