


Abstract
To help offset the increased price of cigarettes and promote brand loyalty, tobacco companies distribute coupons, particularly to price-sensitive consumers. Few studies, however, have examined the longitudinal association between coupon receipt and smoking cessation.
Using adult data from waves 1–5 (2013–2019) of the Population Assessment of Tobacco and Health Study, we examined the longitudinal association between coupon receipt and short-term smoking cessation. Multivariable discrete-time survival models were fit to an unbalanced person-period dataset for adult respondents (≥18 years) with current established smoking status at baseline (person n = 9472, risk period n = 29 784). Short-term smoking cessation was measured as discontinued cigarette use (no past 30-day cigarette use at follow-up) and self-reported complete quitting. Coupon receipt was measured as a time-varying exposure, measured in the wave preceding the outcome. Tobacco dependence and time-varying cigarette use intensity were controlled as potential confounders. Effect modification by age, sex, race-ethnicity, and education was assessed by examining interaction terms.
We found that adults who received a coupon were 19% less likely to quit smoking compared to adults who did not receive a coupon, adjusting for covariates (adjusted hazard rate [aHR]: 0.81, 95% CI: 0.74–0.89). None of the interaction terms were statistically significant, suggesting that the association between coupon receipt and short-term smoking cessation may not differ across the sociodemographic groups that we examined.
Taken together, our results reveal that coupon receipt reduces the likelihood of short-term smoking cessation, and that this association does not differ by age, sex, race-ethnicity, or education.
Tobacco companies distribute coupons for tobacco products to price-sensitive customers in the United States, and these coupons can be particularly effective in partly offsetting the impact of a tax increases and promoting brand loyalty. This study provides longitudinal evidence that coupon receipt is associated with a decrease in short-term smoking cessation among US adults who smoke cigarettes after adjusting for covariates and tobacco-related confounders. The findings from this study suggest that coupons are an effective tool for tobacco companies to prevent adults who smoke from quitting, and a national ban on coupons may help to facilitate smoking cessation.
Introduction
Taxes and other policies that increase the price of tobacco products are known to decrease the prevalence of smoking.1,2 Smoking, however, continues to be the leading cause of preventable death in the United States,3 due in part to the selective marketing techniques used by the tobacco industry.4–6 Price discrimination, which lowers the price of tobacco products for certain customers, is used by the tobacco industry to offset the effects of price increases of tobacco tax and price policies in the United States.7 Price discounts currently represent the largest category of cigarette advertising and promotional expenditures,8 as tobacco companies reported spending $6.065 billion, accounting for 77.4% of the advertising and promotional industry expenditure in 2020.9
One method of price discounting is the distribution of coupons, which help partly offset policy price increases while also fostering brand loyalty.10 Coupons have traditionally been distributed directly to consumers via mail and email, but more recently coupons have also begun to be sourced through an array of social media platforms.11,12 Coupons primarily affect the most price-sensitive customers, whose purchasing behaviors are most dependent on the price of tobacco products. Price-sensitive consumers for tobacco products are generally those with less expendable income, such as youth or adults who are of low socioeconomic status.8 Using customer databases, tobacco companies often identify these price-sensitive customers based on their purchasing habits, brand preferences, and interests.8,10,13
In addition to being more likely to receive tobacco coupons, price-sensitive customers may also be more likely to use them; a recent study found that individuals who smoke who reported difficulty paying important bills were more likely to both receive tobacco coupons in the mail and to redeem them.14 This is concerning because coupon receipt affects tobacco initiation and cessation.15 Furthermore, coupons may exacerbate tobacco-related disparities as tobacco companies specifically target people from socially and economically marginalized communities.4
Although a recent systematic review found that coupon receipt was associated with lower cessation odds,13 only a small number of longitudinal studies have examined the coupon receipt-cessation association and these studies have had heterogeneous results.4,6,14,16,17 Two longitudinal studies conducted in the US state of Minnesota produced conflicting findings, with one reporting a null association between coupon receipt exposure and smoking cessation,17 and the other reporting a significant inverse association.5 Currently, only one longitudinal study examined the coupon receipt-cessation association at the national level. Using waves 1–2 from the Population Assessment of Tobacco Health Study (PATH), Choi et al. found that adults who received coupons at baseline had 29% lower odds (AOR = 0.71, 95% CI: 0.58–0.88) of smoking cessation at follow-up compared to those who did not receive coupons.4 None of these prior studies that examined the association between coupon receipt and smoking cessation have included more than two-time points. Furthermore, no longitudinal studies have tested whether the coupon receipt-cessation relationship was moderated by factors such as sex, race-ethnicity, or socioeconomic status.
In this study, we use data from a nationally representative prospective longitudinal study to examine the association between coupon receipt and smoking cessation. We add to the literature by: (1) examining whether time-varying coupon receipt is associated with smoking cessation using multiple waves of a nationally representative sample of US adults, (2) testing whether the coupon-cessation association differs based on sociodemographic characteristics, and (3) controlling for the potential confounding of cigarette use intensity and tobacco dependence. Regarding the latter, a recent systematic review concluded that tobacco-use intensity is positively associated with coupon receipt, potentially acting as a confounder.15 Therefore, controlling for cigarette use intensity could offer a potentially less biased estimate of the association between coupon receipt and smoking cessation.
Methods
Data
The data used in this study came from waves 1–5 (2013–2019) of the PATH Study, a nationally representative longitudinal study of the non-institutionalized civilian US population. Wave 1 data were collected from September 2013 to December 2014, wave 2 data were collected from October 2014 to October 2015, wave 3 data were collected from October 2015 to October 2016, wave 4 data were collected from December 2016 to January 2018, and wave 5 data were collected from December 2018 to November 2019. Analyses were conducted using the restricted-access PATH adult data files,18 which allowed us to include age as a continuous predictor. Further details about the design of the PATH Study, including how to access the restricted use data, are available elsewhere.18–20 The University of Michigan Institutional Review Board deemed the current study to not be human subjects research due to the use of deidentified secondary data.
The analytic sample for the study was restricted to adult respondents aged 18 years or older at wave 1 with current established smoking status and who participated in at least one of the follow-up interviews. Current established smoking status were defined as respondents who had smoked at least 100 cigarettes in their lifetime and reported smoking every day or some days at the baseline interview. Of the eligible 11 402 adults who were classified as current established cigarette users at baseline, 1609 were excluded because they did not participate in any follow-up wave. An additional 321 respondents were excluded due to missingness, resulting in a final analytic sample of 9472 respondents. A flowchart summarizing the stages of sample selection can be found in Figure 1.
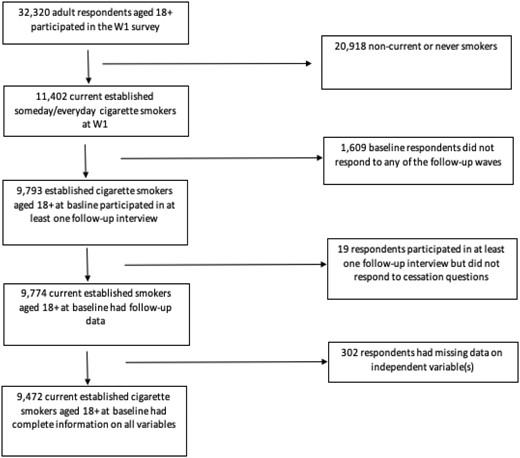
Flowchart of sample selection for analytic sample, PATH waves 1–5.
The 9472 respondents in our analytic sample were then restructured to an unbalanced person-period data set where each respondent (N) contributed a separate row of data for each discrete-time interval (T), with a maximum of four rows per respondent, until they quit smoking or were right censored, meaning they had not quit smoking at their last follow-up interview. The person-period data set, constructed based on N × T, had 29 784 observations, and provided the data for the discrete-time survival analysis (described below).
Measures
Consistent with other research using PATH data, short-term smoking cessation was operationalized through a two-step process.21 Respondents were considered to have successfully quit smoking if they reported (1) discontinued cigarette use and (2) that they had completely quit smoking cigarettes. Discontinued cigarette use was defined as respondents who smoked at baseline (wave 1) but reported no past 30-day cigarette use at follow-up. Respondents who discontinued cigarette use were then asked the question, “have you completely quit smoking cigarettes?” Among respondents who discontinued cigarette use, those who answered “yes” to the question were counted as having quit smoking. This measurement strategy ensured that short-term discontinued cigarette use was accompanied by self-reported cessation.
Receipt of cigarette coupons was the exposure variable. Respondents were asked about coupon receipts at each wave, but the wording of the questions changed slightly over time. In waves 1 and 2, respondents were asked whether they received promotions or coupons for cigarettes or other tobacco products in the mail or by email. In waves 3 and 4, respondents were asked whether they received promotions for coupons separately for each tobacco product. For waves 1 and 2, the coupon receipt exposure included coupons for cigarettes and other tobacco products. In waves 3 and 4, we classified respondents as having received coupons if they responded “yes” to receiving coupons for cigarettes. In waves 3 and 4, 85% of coupons received were for cigarettes. To capture changes in coupon receipt over time, our coupon exposure variable was time-varied and was measured one wave preceding the outcome.
To examine sociodemographic differences in the association between coupon receipt and smoking cessation, we included mean-centered age (continuous), sex (female, male), race-ethnicity (NH White, NH Black, NH Other, Hispanic), education (high school/GED or less, some college, and college degree or higher), and household income (less than $49 999, $50 000 or more, missing) as baseline sociodemographic variables. Missing values for baseline sociodemographic variables were updated with data from other waves when available to reduce item non-response.
To account for the potential confounding of cigarette smoking histories, we included two additional covariates. First, we included current cigarette use intensity, defined as the average number of cigarettes smoked per day for those with current established smoking status at each wave. Smoking intensity was measured from 0 to 100, with respondents who reported smoking between 100 and 199 cigarettes per day top coded as 100 cigarettes or more (5 packs per day). Respondents who reported smoking more than 200 cigarettes per day (10 packs per day) were assigned a missing value for current smoking intensity because this response was not considered plausible.22 The smoking intensity measure was included as a time-varying covariate, measured in the wave preceding the outcome. Second, we included tobacco dependence, derived from a validated 16-items scale at baseline to control for differences in nicotine addiction among respondents.23,24 The tobacco dependence score for every respondent was calculated by taking the linear average of the rescaled 16 items into a score of 0 to 100.
Statistical Analysis
Descriptive statistics were first calculated for sociodemographic characteristics at baseline and for the time-varying covariates. Lifetables were then used to describe the distribution of smoking cessation at follow-up (w2–w5). The discrete-time baseline hazard function reflects the weighted conditional probability of smoking cessation at each discrete-time period given the individual had not quit smoking during a previous period. Once individuals quit smoking, they were removed from the risk set, meaning these models were restricted to the time until the first smoking cessation. Respondents who did not quit smoking were right censored at the last discrete-time interval. The discrete-time baseline hazard function is represented by the following equation:
where represents the conditional probability that individual i will experience smoking cessation event t during the discrete-time interval j given that the individual has not yet quit smoking.
The baseline hazard function was extended to test the hypothesis that smoking cessation differs by coupon receipt status. The discrete-time baseline hazard function was therefore extended to include the coupon receipt exposure,. Thus,
where now represents the conditional probability that individual i, distinguished by their coupon receipt status successfully quits smoking, T, during discrete time-interval, j, given that the individual has not yet quit smoking before that time interval. Note that the coupon use exposure for each individual i was lagged by one time-interval j (t−1), meaning that coupon receipt was measured at the time interval preceding the smoking cessation T outcome.
The conditional probability of smoking cessation by coupon use status without any adjustments was included as model 1 in the discrete-time survival analysis. Model 1 was then extended to include a series of additional covariates, C,in three subsequent models. Model 2 added the sociodemographic control variables while model 3 added cigarette smoking intensity and tobacco dependence. Models 4–7 tested the multiplicative interactions between coupon receipt and age, sex, race-ethnicity, and household income respectively. The marginal interactive estimates represent whether the change in the probability of smoking cessation was statistically different across the sociodemographic groups. All discrete-time survival models were estimated using a complementary log-log link function on the person-period data.
Data for all years were weighted using wave 1 weights, including full-sample and 100 replicate weights, to ensure that our respondents were representative of non-institutionalized adult population in the United States at baseline. We conducted several sensitivity analyses. First, multivariable models were estimated using a general coupon receipt measure which includes all tobacco products compared to only cigarettes (Supplementary Table S1). Second, multivariable models were estimated with the longitudinal cohort of respondents who participated in all waves of the PATH Study using the “all waves weights” (Supplementary Table S2). A third sensitivity analysis included other combustible tobacco use as a time-varying confounder in multivariable models (Supplementary Table S3). For all analyses, variances were computed using the balanced repeated replication methods with Fay’s adjustment set to 0.3 as recommended by the PATH Study.25,26 All analyses were conducted using Stata 17.1.27
Results
Table 1 presents the weighted sociodemographic characteristics and smoking behaviors at baseline. Adults with current established cigarette smoking status at baseline had a mean age of 41.6 (SD = 14.5), and more than half of the population was male (53.8%), NH White (69.5%), and reported a household income of $49 999 or less (73.9%). The mean tobacco dependence score at baseline was 52.7 (SD = 26.4), and respondents reported smoking an average of 13.4 cigarettes per day (SD = 10.4). Coupon receipt was reported by 36.7% of adults with current established cigarette smoking status at baseline (95% CI: 36.7–38.8).
Sample Characteristics by Coupon Use Status of Current Established Adult Cigarette Smokers (≥18 Years) at Baseline, Population Assessment of Tobacco and Health Study (2013–2014)
| Total | No coupon receipt | Coupon receipt | |||||
|---|---|---|---|---|---|---|---|
| N | % or mean | 95% CI | % or mean | 95% CI | % or mean | 95% CI | |
| Coupon receipt | |||||||
| No | 5865 | 62.3 | 61.2–63.3 | ||||
| Yes | 3607 | 36.7 | 36.7–38.8 | ||||
| Age (mean, SD) | 9472 | 41.6 (14.5) | 42.3 (15.6) | 40.4 (13.2) | |||
| Sex | |||||||
| Female | 4636 | 46.2 | 45.1–47.4 | 42.9 | 41.4–44.4 | 51.7 | 50.1–53.9 |
| Male | 4836 | 53.8 | 52.6–54.9 | 57.1 | 55.6–58.6 | 48.3 | 46.6–49.9 |
| Race-ethnicity | |||||||
| NH White | 6276 | 69.5 | 68.1–70.8 | 66.4 | 65.0–67.8 | 74.5 | 72.4–76.5 |
| Hispanic | 1195 | 11 | 10.3–11.7 | 12.8 | 11.9–13.8 | 7.9 | 7.0–9.0 |
| NH Black | 1300 | 13.8 | 12.9–14.7 | 14.6 | 13.6–15.6 | 12.4 | 10.9–14.1 |
| NH other | 701 | 5.7 | 5.2–6.4 | 6.2 | 5.5–7.0 | 5.1 | 4.4–6.0 |
| Household income | |||||||
| $49 999 or less | 7189 | 73.9 | 72.6–75.2 | 72.8 | 71.3–74.2 | 75.8 | 73.7–77.8 |
| $50 000 or more | 2094 | 24 | 22.7–25.2 | 24.6 | 23.3–26.0 | 22.9 | 21.0–24.8 |
| Income missing | 189 | 2.1 | 1.8–2.5 | 2.6 | 2.2–3.1 | 1.4 | 0.93–2.0 |
| Tobacco dependence (mean, SD) | 9472 | 52.7 (26.4) | 49.5 (27.0) | 58.0 (24.5) | |||
| Cigarette smoking intensity (mean, SD) | 9472 | 13.4 (10.4) | 12.4 (10.0) | 15.2 (10.8) | |||
*p < .05.
**p < .01.
***p < .001.
*Percentages were calculated using wave 1 weights.
Table 1 also presents the sample characteristics by coupon receipt status. Compared to adults who did not report receiving a coupon at baseline, those who did report receiving a coupon were younger (40.4 vs. 42.3), more likely to be female (51.7% vs. 42.9%), more likely to be NH White (74.5 vs. 66.4), and were more likely to report a household income of $49 999 or less (75.8% vs. 72.8%). In addition, adults who received coupons had higher tobacco dependence (58.0 vs. 49.5) and smoked more cigarettes per day (15.2 vs. 12.4) than those who did not receive a coupon.
Table 2 presents lifetables describing the time until first smoking cessation for adults with established cigarette smoking status at baseline. Smoking cessation was reported by 2479 of the 9472 respondents in the analytic sample, with a weighted annualized hazard of 8.3% (range: 6.8%–10.2%). There was an increased hazard in the last time interval, likely reflecting the longer time interval between wave 4 and wave 5.
Life Tables Describing Time Until First Smoking Cessation Among Current Established Adult (≥18 Years) Smokers, Population Assessment of Tobacco and Health Study (Waves 1–5, 2013–2019)
| Interval | Total | Smoking cessation | Censored | Survival estimatea | Hazard estimateb |
|---|---|---|---|---|---|
| Period 1 (w1–w2) | 9472 | 819 | 654 | 0.9135 | 0.0883 |
| Period 2 (w2–w3) | 7999 | 634 | 576 | 0.8411 | 0.0775 |
| Period 3 (w3–w4) | 6789 | 456 | 836 | 0.7846 | 0.0676 |
| Period 4 (w4–w5) | 5479 | 570 | 4927 | 0.7033 | 0.102 |
| Average annual incidence | 0.0833 |
aSurvival estimates were based on unweighted data.
bHazard estimates were calculated with the replicate weights.
Table 3 presents the results from the discrete-time survival models predicting smoking cessation. The exposure variable, past year coupon receipt, was associated with a reduced hazard of smoking cessation (HR 0.69, 95% CI: 0.63, 0.76) in model 1 before adjusting for covariates. This association remained statistically significant once we added sociodemographic characteristics in model 2 (aHR, 0.69, 95% CI: 0.62, 0.75) and tobacco-related covariates in model 3 (HR 0.81, 95% CI: 0.74, 0.89). We examined effect modification of the association between coupon receipt and smoking cessation by sociodemographic characteristics in models 4–7. None of the interactions were statistically significant, indicating that the association of coupon receipt on smoking cessation was similar for respondents regardless of their age, sex, race-ethnicity, or household income.
Discrete-Time Survival Analysis Predicting Smoking Cessation Among Adults (≥18 years), Population Assessment of Tobacco and Health Study (Waves 1–5, 2013–2019)
| Model 1 | Model 2 | Model 3 | Model 4 | Model 5 | Model 6 | Model 7 | ||||||||
|---|---|---|---|---|---|---|---|---|---|---|---|---|---|---|
| Hazard | 95% CI | Hazard | 95% CI | Hazard | 95% CI | Hazard | 95% CI | Hazard | 95% CI | Hazard | 95% CI | Hazard | 95% CI | |
| Coupon receipt TVC | 0.69*** | 0.63–0.76 | 0.69*** | 0.62–0.75 | 0.81*** | 0.74–0.89 | 0.81*** | 0.74–0.89 | 0.80** | 0.71–0.91 | 0.81*** | 0.73–0.91 | 0.80*** | 0.72–0.89 |
| Agea | 0.99*** | 0.98–0.99 | 1 | 0.99–1.00 | 1 | 0.99–1.00 | 1 | 0.99–1.0 | 1 | 0.99–1.00 | 1 | 0.99–1.00 | ||
| Sex (male = 1) | 1.02 | 0.93–1.10 | 1.09* | 1.01–1.19 | 1.09* | 1.01–1.19 | 1.08 | 0.99–1.19 | 1.10* | 1.01–1.19 | 1.09* | 1.01–1.19 | ||
| Race-ethnicity | ||||||||||||||
| NH White | REF | REF | REF | REF | REF | REF | REF | REF | REF | REF | REF | REF | ||
| Hispanic | 1.22** | 1.08–1.39 | 0.84* | 0.73–0.96 | 0.84* | 0.73–0.96 | 0.84* | 0.73–0.96 | 0.83* | 0.71–0.98 | 0.84* | 0.73–0.96 | ||
| NH Black | 0.72** | 0.60–0.86 | 0.56*** | 0.46–0.67 | 0.54*** | 0.46–0.67 | 0.56*** | 0.45–0.67 | 0.58*** | 0.48–0.70 | 0.56*** | 0.46–0.67 | ||
| NH Other | 1.05 | 0.86–1.27 | 0.85 | 0.69–1.04 | 0.85 | 0.70–1.04 | 0.85 | 0.70–1.04 | 0.81 | 0.63–1.02 | 0.85 | 0.69–1.04 | ||
| Household income | ||||||||||||||
| $49 999 or less | REF | REF | REF | REF | REF | REF | REF | REF | REF | REF | REF | REF | ||
| $50 000 or more | 1.49*** | 1.34–1.65 | 1.30*** | 1.18–1.44 | 1.30*** | 1.18–1.44 | 1.30*** | 1.18–1.45 | 1.30*** | 1.18–1.44 | 1.27*** | 1.13–1.43 | ||
| Income missing | 1.15 | 0.83–1.60 | 1.1 | 0.80–1.52 | 1.1 | 0.80–1.52 | 1.1 | 0.80–1.52 | 1.1 | 0.79–1.52 | 1.11 | 0.77–1.58 | ||
| Nicotine dependenceb | 0.94*** | 0.92–0.96 | 0.94*** | 0.92–0.96 | 0.94*** | 0.92–0.96 | 0.94*** | 0.92–0.96 | 0.94*** | 0.92–0.96 | ||||
| Cigarette smoking intensity TVCb | 0.94*** | 0.94–0.95 | 0.94*** | 0.94–0.95 | 0.94*** | 0.94–0.95 | 0.94*** | 0.94–0.95 | 0.94*** | 0.94–0.95 | ||||
| Coupon Interactions | ||||||||||||||
| Coupon receipt*age | 1 | 0.99–1.01 | ||||||||||||
| Coupon receipt*sex | 1.03 | 0.84–1.25 | ||||||||||||
| Coupon receipt*race-ethnicity | ||||||||||||||
| NH White | REF | REF | ||||||||||||
| Hispanic | 1.02 | 0.76–1.38 | ||||||||||||
| NH Black | 0.84 | 0.61–1.15 | ||||||||||||
| NH Other | 1.26 | 0.82–1.93 | ||||||||||||
| Coupon receipt*household income | ||||||||||||||
| $49 999 or less | REF | REF | ||||||||||||
| $50 000 or more | 1.08 | 0.89–1.30 | ||||||||||||
| Income missing | 0.96 | 0.30–3.08 | ||||||||||||
Person N = 9472; Risk N = 29 784; *p < .05, **p < .01, ***p < .001.
aAge was mean-centered.
bVariable rescaled to reflect intervals of 10.
In the multivariable main effect model (model 3), smoking cessation was lower for Hispanic (aHR 0.84, 95% CI: 0.73, 0.96) and NH Black respondents (aHR 0.56, 95% CI: 0.46, 0.67) compared to NH White respondents. The likelihood of smoking cessation was inversely associated with cigarette smoking intensity, as an increase in every 10 cigarettes per day reduced smoking cessation by 6% (aHR 0.94, 95% CI: 0.94, 0.95). Moreover, smoking cessation varied as a function of nicotine dependence, as every 10% increase in nicotine dependence was associated with a 6% reduction in smoking cessation (aHR 0.94, 95% CI: 0.92, 0.96). Respondents who reported a family household income of more than $50 0000 had a 30% increased likelihood of smoking cessation (95% CI: 1.18–1.44) compared to those who reported a family income of $49 999 or less.
Sensitivity Analyses
As a sensitivity analysis, we used a general measure of coupon receipt for any tobacco product that was measured consistently across the waves (see Supplementary Table S1). The substantive results for the revised general coupon use exposure variable (model 3, aHR 0.82, 95% CI: 0.74, 0.90) were nearly identical to the results from the exposure variable used in the main analysis (model 3, aHR 0.81, 95% CI: 0.74–0.89) in model 3. In a second sensitivity analysis, the multivariable discrete-time models were estimated using the longitudinal cohort with the “all waves” weights, which resulted in a reduced sample size (person n = 5636, risk n = 21 845) because participation was required for all five waves (see Supplementary Table S2). Again, the substantive results for the coupon use exposure were nearly identical for the longitudinal cohort who participated in all waves of follow-up (model 3, aHR 0.81, 95% CI: 0.72, 0.91) compared to the results from the main analysis (model 3, aHR 0.81, 95% CI: 0.74, 0.89). A third sensitivity analysis included time-varying combustible tobacco use as a potential confounder (see Supplementary Table S3), and the results for the coupon exposure variable remained unchanged in the multivariable model (model 3, aHR 0.81, 95% CI: 0.74, 0.89).
Discussion
This study examined the longitudinal association between coupon receipt and short-term smoking cessation among a representative sample of US adults who smoke. Consistent with past research, we found that respondents who received cigarette coupons were less likely to quit smoking compared to those who did not receive coupons. Moreover, this association remained statistically significant although reduced among US adults who smoke after controlling for the potential confounding of time-varying cigarette intensity and baseline tobacco dependence.
Previous research suggests that the association between coupon receipt and smoking cessation may be modified by sociodemographic characteristics. We tested for effect modification based on age, sex, race-ethnicity, and self-reported household income. We did not find any statistically significant interactions, suggesting that coupon receipt lowers the likelihood of smoking cessation among adults who smoke, without differences by these sociodemographic characteristics. This finding highlights the importance of taking action to mitigate the effects of tobacco coupons. Even though the association between coupon receipt and short-term cessation did not differ based on the sociodemographic characteristics we measured in our study, our findings align with research demonstrating that coupon receipt is more common among sociodemographic groups who are more likely to smoke.15,28 Thus, tobacco coupons are highly likely to exacerbate smoking-related health disparities. It is certainly possible that other sociodemographic characteristics moderate the association between coupon receipt and cessation. For example, we did not include any measures for other measures of social identity, including sexual or gender minority identity. Additionally, our data precluded us from investigating whether coupons are distributed preferentially in areas with higher taxation. Future research should investigate these questions further.
Our finding that coupon receipt was negatively associated with smoking cessation was robust in several sensitivity analyses. To assess the stability of our findings, we conducted sensitivity analyses using a general measure of coupon receipt for any tobacco product and fit discrete-time models using the “all waves weights,” which adjust for observable patterns of attrition. We also tested whether the coupon receipt-cessation association was affected by including respondents’ use of other combustible tobacco products in the model. To do so, we ran a model that was parallel to the model used in our main analyses but also included a time-varying variable representing respondents’ use of other combustible tobacco products. We found that use of other tobacco products was not significantly related to cigarette smoking cessation, and our coupon receipt variable remained a statistically significant predictor of cessation in the model that accounted for other combustible tobacco use. Overall, our findings are cause for concern given tobacco companies’ continued use of coupons as a tool to counteract the effects of taxes and other policies that aim to increase the price of cigarettes to reduce smoking. While some states and localities have implemented policies to restrict coupon use at point-of-sale,29 coupon use is still unregulated in most places throughout the United States. A 2016 modeling study found that eliminating price discounts on cigarettes would lead to a substantial decrease in the prevalence of smoking; banning tobacco coupons would be an important step toward that goal.30
There are several noteworthy limitations to the current study that should be considered. First, the coupon receipt variable was self-reported, indicating a possible bias as respondents may not be able to accurately recall if they received a coupon in the past year. Second, our exposure variable of tobacco coupon receipt was dichotomous, failing to capture the frequency of coupon receipt, which may be linked to cigarette smoking cessation. Third, our exposure variable examined the receipt of coupons and not the redemption of coupons, which may also be linked to smoking cessation. Future longitudinal studies would benefit from examining both the frequency of coupon receipt and the redemption of coupons to more fully understand the coupon-smoking cessation association. Fourth, the PATH Study does not ask about the source of the coupons. To efficiently target interventions, it is important to better understand how coupons are being distributed. Several studies have conducted descriptive analyses that look into the source of coupons, but most do not include measures of social media,11 which may constitute an important and emerging mode of coupon distribution. Future longitudinal studies should aim to include the source of coupons as well as the frequency with which coupons were received or redeemed. Fifth, while we adjusted for two tobacco-related confounders, it remains possible that unmeasured confounding may be affecting the precision of our results. For instance, we did not adjust for geographic variation in tobacco regulations, and future research would benefit from a better understanding of how state-level policies impact the association between coupon receipt and smoking cessation. Finally, our study examined short-term smoking cessation, and we did not examine longer-term smoking cessation or relapse. Future research would benefit from examining disparities in both smoking relapse and longer-term smoking cessation for adults who receive coupons.
Conclusion
To the best of our knowledge, this is the first nationally representative study in the United States that examined the longitudinal association between coupon receipt and smoking cessation using more than two waves of follow-up while adjusting for potential tobacco-related confounders. We found that coupon receipt reduced the likelihood of smoking cessation, and this finding remained statistically significant once we controlled for cigarette use intensity and tobacco dependence. We further examined whether there were differences in the association by age, sex, race-ethnicity, and household income, but did not find any differences. Taken together, our findings suggest that tobacco coupons function as an effective tool for tobacco companies to prevent adults who smoke from quitting, thus maintaining their customer base. A national ban on tobacco coupon distribution or additional state- and local-level policies restricting coupon use at the point of sale could help to facilitate smoking cessation.
Supplementary Material
A Contributorship Form detailing each author’s specific involvement with this content, as well as any supplementary data, are available online at https://dbpia.nl.go.kr/ntr.
Funding
This work was supported by the National Cancer Institute of the National Institutes of Health [grant number U54-CA229974]. The opinions expressed in this article are the author’s own and do not reflect the views of the National Institutes of Health, the Department of Health and Human Services, or the United States government.
Acknowledgments
We would like to thank the HELPER team and other partners for their comments during the creation of the manuscript.
Declaration of Interests
The authors have no conflicts of interest to declare.
Data Availability
The PATH public use files are available at doi: https://doi.org/10.3886/ICPSR36231.v29. For our analysis, we used the restricted use data file because some key variables were not available in the public use data file.

Comments