


Abstract
Flavored tobacco sales restrictions (FTSRs) are implemented to reduce access to flavored tobacco products. We examined the association between seven cities with local FTSRs implemented in 2018/2019 and e-cigarette use among high school students in the California Bay Area.
We analyzed data from the California Healthy Kids Survey using a difference-in-differences (D-I-D) strategy. We compared pre- and post-policy changes one year after implementation in current and ever e-cigarette use among students attending school in a city with a FTSR (exposed) (n = 20 832) versus without (unexposed) (n = 66 126). Other outcomes included ever marijuana use in an e-cigarette and ease of access to e-cigarettes.
Pre- to post-policy, the adjusted odds of current and ever e-cigarette use did not significantly change among students exposed and unexposed to a FTSR. In the adjusted D-I-D analysis, the odds of current (aOR: 1.25, 95% CI: 0.95, 1.65) and ever e-cigarette use (aOR: 1.06, 95% CI: 0.89, 1.26) did not significantly change by exposure group. However, one year post-implementation, the odds of ease of access to e-cigarettes significantly increased among exposed (aOR: 1.57, 95% CI: 1.27, 1.95) and unexposed students (aOR: 1.54, 95% CI: 1.39, 1.70). Similarly, the odds of ever using marijuana in an e-cigarette significantly increased among exposed (aOR: 1.35, 95% CI: 1.19, 1.53) and unexposed students (aOR: 1.29, 95% CI: 1.20, 1.39).
Local FTSRs in the California Bay Area were not associated with a change in e-cigarette use one year post-implementation. Increased ease of access and marijuana use may be explanatory factors.
FTSRs were not associated with a decrease in current or ever e-cigarette use among high school students in the California Bay Area one-year post-implementation. Potential explanatory factors are that ease of access to e-cigarettes and using marijuana in an e-cigarette increased. More research is needed to understand the influence of these factors on youth access and behaviors. To address the youth e-cigarette epidemic, a comprehensive approach is needed, including policies, media campaigns, education programs, and cessation tools targeted to youth.
Introduction
The U.S. Surgeon General reported that youth vaping is an epidemic.1 Past 30-day e-cigarette use among U.S. high school students nearly doubled in one year from 9.5% in 2017 to 18.3% in 2018 and continued to increase to 22.5% in 2019 and 21.8% in 2020.2 This dramatic increase in use was driven by flavors that appeal to youth, a discreet design, social media marketing, and high nicotine levels.3 Indeed, among current users, 97% used a flavored product in the past month.4
There is currently no national policy banning all flavors from all tobacco products. Flavors (except for menthol) were banned from cigarettes through the 2009 Family Smoking Prevention and Tobacco Control Act, and the FDA recently announced that it will work towards banning menthol from cigarettes and all flavors from cigars.5 Municipalities have passed local flavored tobacco sales restrictions (FTSRs) that are more restrictive than national policies.6 As of December 2021, 353 U.S. jurisdictions have some type of restriction on the sale of flavored tobacco products, many of which are in California.6 Most recent estimates (2020) show that 22.1% of the California population was covered by a local FTSR, including those with and without exemptions, such as allowing menthol or sales in adult only stores.7
Studies show that local FTSRs decrease the availability and sales of flavored tobacco products in retail stores.8–10 However, there is limited evidence examining the impact of FTSRs on change in e-cigarette use and only three studies have included data before policy implementation as a comparison. In addition, no studies have examined using marijuana in an e-cigarette. This may be an important outcome to study as half of current youth e-cigarette users had ever used marijuana in an e-cigarette.11 In Massachusetts, local FTSRs were associated with a decrease in youth e-cigarette use,12–14 and the San Francisco FTSR was associated with a decrease in young adult tobacco and flavored cigar use.15 FTSRs have also been associated with individual users switching sources of flavored tobacco products from retail stores to social sources.16
The aim of this study is to examine if FTSRs were associated with a change in e-cigarette use among high school students in California. We also examined ease of access to e-cigarettes and use of marijuana in an e-cigarette. This study includes data before and after policy enforcement and a comparison group without a policy. Given prior empirical evidence linking FTSRs to reduced e-cigarette use,12–15 we hypothesize that there will be an association between FTSRs and decreased prevalence of e-cigarette use.
Methods
Data Source
The California Healthy Kids Survey (CHKS) is a comprehensive whole child, school climate, and youth risk behavior data collection service available to all California local education agencies, and is funded by the California Department of Education. Students attending middle and high schools (grades 9 and 11) in California completed an in-person survey during the academic school year from September to June. Although most schools participate once every two years, schools are on different two-year cycles so that data is collected every year. Participation is voluntary, confidential, and passive parental consent was obtained. Student response rate was 75% in 2017–2019.17 According to the CHKS survey administrators, a majority of completed surveys for the Spring 2020 data were administered in-person before school closures due to COVID-19.
Since all cities with a FTSR that met our inclusion criteria (see below) were in the San Francisco Bay Area (a region of almost 7000 square miles and 7.1 million people), we restricted the analysis to nine counties in the Bay Area (Alameda, Contra Costa, Marin, Napa, San Francisco, San Mateo, Santa Clara, Solano, and Sonoma). We merged the CHKS data from the 2017/2018 and 2019/2020 school years (n = 277 449) with 2020 data from the California Department of Education to determine the city each high school was located in, school size, and the percent of the school eligible for free or reduced-price meals.18 For additional city characteristics, we also merged population density data from 2015 to 2019 American Community Survey and tobacco retailer data from the 2018 California Department of Tax and Fee Administration, obtained from the California Community Health Assessment Tool.19 The Public Health Law Center provided a list of all FTSR policies in California, their implementation or enforcement dates, and any exclusions (M. Meany, personal communication, November 16, 2020). This list matched the policy information in the Flavored Tobacco Policy Evaluation Tracking System, a database maintained by the American Non-Smokers Rights Foundation and California Tobacco Control Program.10 After merging, there were 274 550 students.
We restricted the data to students attending public high schools or K-12 schools (n = 157 606), who were not missing information on current e-cigarette use (n = 134 604), and reported that they answered all or most of the questions honestly (n = 129 658) (Figure 1). Cities with FTSR polices that were not implemented in 2018/2019 or did not have CHKS data in both 2017/2018 and 2019/2020 were excluded, for a final sample size of 86 958 (46 535 in 2017/2018 and 40 423 in 2019/2020). Table 1 shows a list of included cities and their characteristics. Supplementary table 1 suggests that the students included in our sample were not substantially different from all students in the Bay Area region of California. The UC Davis Institutional Review Board determined that this study was “exempt”.
Characteristics of Cities in the Bay Area Region of California With and Without Flavored Tobacco Sales Restrictions (FTSR)
| Effective/enforced date | Policy type | Population | Land area (square miles) | Number of tobacco retailers within 1000’ of a public school | Number of public high schools | |
|---|---|---|---|---|---|---|
| Unexposed citiesa(median) | NA | 69 567 | 14.4 | 5 | 4 | |
| Exposed cities (median) | 425 097 | 46.9 | 20 | 31 | ||
| Oakland | 7/18/2018 | Adult-only stores excluded | 425 097 | 55.8 | 10 | 34 |
| Windsor | 7/30/2018 | Menthol and several tobacco products excludedb | 27 447 | 7.3 | 2 | 3 |
| Palo Alto | 1/1/2019 | Adult-only stores excluded | 66 573 | 23.9 | 1 | 2 |
| San Francisco | 1/1/2019 | Comprehensive | 874 961 | 46.9 | 101 | 31 |
| Lafayette | 6/26/2019 | Comprehensive | 26 305 | 15.2 | 2 | 1 |
| Alameda | 7/1/2019 | Comprehensive | 78 522 | 10.6 | 7 | 7 |
| Livermore | 8/7/2019 | Comprehensive | 89 699 | 25.2 | 8 | 7 |
Unexposed cities include: American Canyon, Brentwood, Calistoga, Castro Valley, Concord, Daly City, Dixon, Fairfield, Forestville, Gilroy, Healdsburg, Martinez, Millbrae, Milpitas, Moraga, Mountain View, Napa, Oakley, Orinda, Petaluma, Piedmont, Pleasant Hill, Pleasanton, Rohnert Park, San Bruno, San Lorenzo, San Mateo, Santa Rosa, Sebastopol, St. Helena, Vacaville, Vallejo, Walnut Creek.
Premium cigars (priced over $5), large packs of cigars and smokeless tobacco (5 units or more), and pipe tobacco excluded.
Sources:
Dates—Public Health Law Center.
Population (2015–2019 American Community Survey), number of tobacco retailers within 1000’ of a public school (2018 California Department of Tax and Fee Administration), and number of public high schools (2020 California Department of Education) obtained from The California Tobacco Health Assessment Tool (https://cthat.org).
Land area—2010 Census.
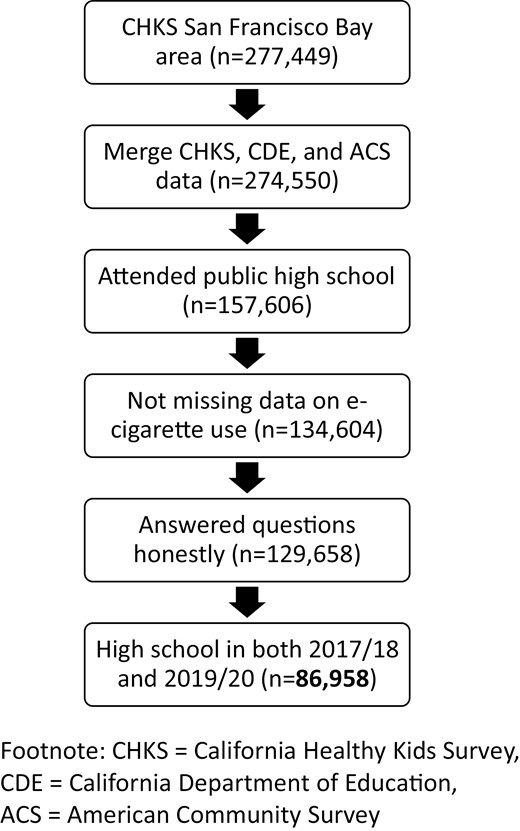
Analysis sample accrual flowchart.
Exposure to FTSR
Students were classified as being exposed to a FTSR if their high school was in a city with a FTSR implementation date (enforcement or effective date) during the 2018/2019 school year, or the summer before or after (July 2018–August 2019). Seven cities met these criteria, resulting in 20 832 high school students classified as exposed to FTSR policies (Table 1). The unexposed group included students living in cities in the Bay Area without a FTSR policy adopted before June 2020 (n = 66 126). County FTSR policies only applied to unincorporated areas and were excluded. A timeline of cities with FTSRs included in the analysis is shown in Supplementary figure 1 and a map is shown in Supplementary figure 2.
Among the seven cities with FTSRs, four had comprehensive policies (ie, all flavors from all tobacco products were banned). The three cities with exemptions included two cities that excluded adult-only stores and one city that excluded several products (menthol, premium cigars, large packs of cigars, smokeless tobacco, and pipe tobacco). Two sensitivity analyses were conducted. In the first, students were classified as (1) exposed to comprehensive FTSRs or (2) exposed to a FTSR with an exemption or not exposed to a FTSR. In the second sensitivity analysis, students exposed to FTSRs with exemptions were excluded from the unexposed group.
Outcome Variables: E-cigarette Use
The main outcome variable was current e-cigarette use. The questions for current e-cigarette use changed slightly over time to account for the introduction of JUUL. From 2017 to 2019, the question was “During the past 30 days, on how many days did you use electronic cigarettes, e-cigarettes, or other vaping device such as juul (added in 2018/2019), e-hookah, hookah pens, or vape pens.” In 2019/2020, each question was shortened to ask about “vape products”, which were defined at the beginning of the question as “Electronic devices like vape pens, e-cigarettes, e-hookah, hookah pens, e-vaporizers, tanks, pods, or mods used to inhale a vapor.” To capture the prevalence of tobacco use, we coded any respondent who reported ≥1 days as having used, 0 otherwise. Among current e-cigarette users, students were classified as using almost daily if they reported using an e-cigarette 20–30 days in the past month (coded as 1 = daily user, 0 otherwise).
Other outcomes included ever e-cigarette use, ever using marijuana in an e-cigarette, and ease of access to e-cigarettes. For the latter, students were asked “How difficult is it for students in your grade to get any of the following if they really want them [E-cigarettes (electronic) or vaping device]?” Students who responded with “very easy” were compared with those who responded with “fairly easy”, “fairly difficult”, “very difficult”, or “don’t know”.
Covariates
Covariates include time-invariant characteristics at the student, school, and city-level. Student level covariates included gender (male, female), grade (9th, or 11th), term (fall or winter), race/ethnicity (Hispanic, Non-Hispanic [NH] Asian, NH Black, NH White, NH other [American Indian/Alaskan Native and Native Hawaiian/Pacific Islander combined for models], and NH mixed race), sexual orientation (straight, gay/lesbian/bisexual, or not sure/something else), parents’ education (did not finish high school, graduated from high school, attended some college, graduated from college, or don’t know), type of home (a home with a parent, a relative, or friends home, or a foster home, hotel, shelter, or other), and home language (English, Spanish, or other).
School level covariates were obtained from the 2020 California Department of Education data and included school size (≤2000, >2000) and the percent of the school eligible for free or reduced-priced meals (>50%, ≤50%). City level covariates included population density (from 2015 to 2019 American Community Survey) and number of tobacco retailers within 1000 feet of schools (from the 2018 California Department of Tax and Fee Administration). Population density was calculated by dividing the population by the land area and categorized into quartiles.
Statistical Analysis
The percent of students in each FTSR exposure category was calculated for each covariate and differences were examined using a chi-square test. In addition, the prevalence of each outcome was calculated before (2017/2018) and after (2019/2020) policy implementation by FTSR category. We estimated difference-in-differences (D-I-D) models using logistic regression to compare how the prevalence of each outcome changed post-policy to pre-policy, and between students exposed to a FTSR relative to unexposed students. To obtain the D-I-D odds ratio, we included an interaction term between year (2019/2020 compared with 2017/2018) and exposure group (FTSR: yes or no). Models were adjusted for covariates previously described. To account for clustering of students within schools, SAS survey procedures were used. All analysis was conducted using SAS version 9.4 (SAS Institute, Cary, NC).
To assess the parallel trends assumption for a D-I-D model, the percent of high school students who had ever or were currently using an e-cigarette was calculated from 2015/2016 to 2019/2020 for exposed and unexposed students (Supplementary figure 3). Data on two variables, marijuana use in an e-cigarette and ease of access to e-cigarettes, was not available until 2017 and was not included in the parallel trends analysis. Before policy implementation (2018/2019), current and ever e-cigarette use appeared to decrease from 2015 to 2016 and then increase in 2017. Therefore, we assessed the parallel trends assumption by including an interaction term (year × FTSR), using 2016 as the referent category, in logistic regression models. We found no difference in current and ever e-cigarette use over time by FTSR group, suggesting that the parallel trends assumption holds. Results of the logistic regression models are shown in Supplementary tables 2a and 2b.
Results
Among high school students living in the San Francisco Bay Area of California, approximately 20% were in cities with a FTSR. As shown in Table 2, approximately half of the students in the analysis were male, in the 11th grade, and had a parent that graduated from college. Over 1/3 (35.5%) of students were Hispanic, 19.1% were NH Asian, 4.7% NH Black, and almost a quarter (26.8%) were NH White. Almost 10% of students were gay, lesbian, or bisexual. Most (92.9%) students lived in a home with a parent and 2/3 spoke English at home. There were no differences in student variables by exposure status. However, schools in cities with a FTSR had more students eligible for free or reduced-price meals.
Characteristics of High School Students in California by Flavored Tobacco Sales Restriction Category, CHKS 2017/2018 and 2019/2020 (n = 86 958)
| 2017/2018 and 2019/2020 | Pre-policy 2017/2018 | Post-policy 2019/2020 | |||
|---|---|---|---|---|---|
| Unexposed (n = 35 070) | Exposed (n = 11 465) | Unexposed (n = 31 056) | Exposed (n = 9367) | ||
| Number of cities | 40 | 33 | 7 | 33 | 7 |
| Number of schools | 79 | 53 | 26 | 53 | 26 |
| Student variables | |||||
| Male | 49.9 | 49.9 | 50.1 | 49.7 | 50.4 |
| 11th grade | 45.5 | 46.0 | 45.2 | 45.3 | 44.5 |
| Race/ethnicity | |||||
| Hispanic | 35.5 | 35.2 | 33.7 | 36.9 | 34.6 |
| NH American Indian/Alaskan Native | 0.53 | 0.54 | 0.42 | 0.57 | 0.49 |
| NH Asian | 19.1 | 18.3 | 22.0 | 17.8 | 23.1 |
| NH Black | 4.7 | 3.7 | 8.6 | 3.5 | 7.5 |
| NH Native Hawaiian/Pacific Islander | 2.2 | 2.6 | 1.7 | 2.3 | 1.4 |
| NH White | 26.8 | 28.1 | 23.6 | 27.8 | 22.3 |
| NH Mixed | 11.2 | 11.5 | 10.1 | 11.2 | 10.8 |
| Sexual orientation | |||||
| Straight | 84.7 | 85.4 | 84.8 | 84.4 | 82.8 |
| Gay, lesbian, or bisexual | 9.0 | 8.1 | 8.7 | 9.6 | 10.4 |
| Not sure or something else | 6.3 | 6.5 | 6.5 | 5.9 | 6.8 |
| Parents education | |||||
| <High school | 11.9 | 10.4 | 16.0 | 11.1 | 15.2 |
| High school | 13.5 | 13.5 | 14.3 | 13.2 | 13.5 |
| Some college | 11.9 | 13.2 | 10.2 | 11.9 | 9.2 |
| College graduate | 51.9 | 50.1 | 46.7 | 53.5 | 48.5 |
| Don’t know | 10.8 | 9.9 | 12.7 | 10.3 | 13.6 |
| Type of home | |||||
| Home with a parent | 92.9 | 93.2 | 91.4 | 93.6 | 91.8 |
| Relative/friend’s home | 5.0 | 4.7 | 6.3 | 4.5 | 5.9 |
| Foster, hotel, shelter, other | 2.1 | 2.1 | 2.3 | 2.0 | 2.3 |
| Home language | |||||
| English | 68.8 | 69.3 | 61.3 | 72.1 | 65.0 |
| Spanish | 19.2 | 17.8 | 21.0 | 19.5 | 21.8 |
| Other | 12.0 | 12.9 | 17.7 | 8.3 | 13.2 |
| School level variables | |||||
| >2000 students | 25.8 | 30.1 | 15.2 | 28.0 | 15.7 |
| ≥50% of school eligible for FRPM | 18.6 | 11.4 | 39.4* | 13.4 | 37.6* |
| City level variables | |||||
| Population density (population/land area) | |||||
| <3520 | 28.5 | 31.4 | 17.9 | 31.8 | 20.2 |
| 3520–4226 | 22.8 | 24.0 | 20.6 | 24.9 | 14.4 |
| 4226–7620 | 21.1 | 25.3 | 9.7 | 23.8 | 10.9 |
| >7620 | 27.5 | 19.4 | 51.9 | 19.5 | 54.5 |
| Number of tobacco retailers within 1000 feet of a school (mean) | 9.2 | 5.9 | 12.5 | 6.0 | 12.7 |
Abbreviations: CHKS, California Healthy Kids Survey; FRPM, Free or Reduced Price Meal; FTSR, Flavored Tobacco Sales Restriction; NH, Non-Hispanic.
*p-value from chi-square test <.05 comparing unexposed (no FTSR) to exposed (FTSR) students by year.
Sources:
School level variables (school size and percent eligible for FRPMs) from the 2020 California Department of Education.
Population (2015–2019 American Community Survey) and number of tobacco retailers within 1000’ of a public school (2018 California Department of Tax and Fee Administration) obtained from The California Tobacco Health Assessment Tool (https://cthat.org).
Land area—2010 Census.
As shown in Table 3, there was no significant change in the adjusted odds of current e-cigarette use pre- to post-policy among students exposed to a FTSR (aOR: 1.12, 95% CI: 0.86, 1.45) and unexposed (aOR: 0.90, 95% CI: 0.81, 1.00). Adjusted D-I-D estimates show no pre- to post-policy difference in the odds of current e-cigarette use among students exposed to a FTSR relative to those unexposed to a FTSR (aOR = 1.25, 95% CI: 0.95, 1.65). Among current e-cigarette users, there was a significant increase in the adjusted odds of almost daily e-cigarette use among students unexposed to a FTSR (aOR: 1.25, 95% CI: 1.10, 1.42). However, the increase among exposed students was not significant (aOR: 1.27, 95% CI: 0.91, 1.79).
Association Between Exposure to Any Flavored Tobacco Sales Restrictions and Student E-cigarette Use, CHKS 2017/2018 and 2019/2020
| Pre-policy 2017/2018 | Post-policy 2019/2020 | Post compared with pre-policy | ||||||
|---|---|---|---|---|---|---|---|---|
| Unadjusted (n = 86 958) | Adjusteda (n = 77 760) | |||||||
| OR (95% CI) | D-I-D OR (95% CI) | pb | OR (95% CI) | D-I-D OR (95% CI) | pb | |||
| Current e-cigarette use | ||||||||
| Exposed | 10.5 | 11.1 | 1.06 (0.84, 1.36) | 1.22 (0.94, 1.58) | .14 | 1.12 (0.86, 1.45) | 1.25 (0.95, 1.65) | .11 |
| Unexposed | 12.8 | 11.4 | 0.88 (0.79, 0.98) | ref | 0.90 (0.81, 1.00) | ref | ||
| Almost daily e-cigarette usec | ||||||||
| Exposed | 20.8 | 22.7 | 1.12 (0.81, 1.55) | 0.94 (0.66, 1.33) | .71 | 1.27 (0.91, 1.79) | 1.01 (0.71, 1.46) | .94 |
| Unexposed | 21.2 | 24.3 | 1.19 (1.06, 1.34) | 1.25 (1.10, 1.42) | ||||
| Ever e-cigarette use | ||||||||
| Exposed | 20.8 | 21.5 | 1.04 (0.91, 1.18) | 1.05 (0.90, 1.22) | .51 | 1.08 (0.91, 1.27) | 1.06 (0.89, 1.26) | .52 |
| Unexposed | 24.0 | 23.8 | 0.99 (0.91, 1.07) | 1.02 (0.94, 1.09) | ref | |||
| Ever used marijuana in an e-cigarette | ||||||||
| Exposed | 16.9 | 20.6 | 1.27 (1.14, 1.42) | 1.04 (0.91, 1.18) | .59 | 1.35 (1.19, 1.53) | 1.05 (0.91, 1.21) | .53 |
| Unexposed | 17.6 | 20.8 | 1.23 (1.14, 1.32) | ref | 1.29 (1.20, 1.39) | ref | ||
| Access to e-cigarettes | ||||||||
| Easy to obtain | ||||||||
| Exposed | 30.6 | 39.2 | 1.46 (1.17, 1.84) | 1.01 (0.78, 1.29) | .96 | 1.57 (1.27, 1.95) | 1.02 (0.81, 1.29) | .85 |
| Unexposed | 34.6 | 43.5 | 1.46 (1.30, 1.62) | ref | 1.54 (1.39, 1.70) | ref | ||
Abbreviations: CHKS, California Healthy Kids Survey; D-I-D, Differences in differences analysis; OR, odds ratio.
Bold values indicate statistically significant odds ratios comparing pre- to post-policy change in each outcome (p < .05).
Adjusted for gender, grade, race/ethnicity, sexual orientation, parent education, type of home, home language, term, school size, percent of school eligible for Free or Reduced Price Meals, population density, and the number of tobacco retailers within 1000’ of a school.
p-value for interaction term between year and FTSR exposure status.
20–30 times/month among current users (n = 10 304).
Consistent with the current e-cigarette results, there was no significant change in the adjusted odds of ever e-cigarette use pre- to post-policy among students exposed (aOR = 1.08, 95% CI: 0.91, 1.27) and unexposed (aOR = 1.02, 95% CI: 0.94, 1.09) to a FTSR. Adjusted D-I-D estimates show no pre- to post-policy change in exposed compared with unexposed students (aOR: 1.06, 95% CI: 0.89, 1.26).
Two factors had significant increases pre- to post-policy among both FTSR exposure groups. The adjusted odds of ease of access to e-cigarettes significantly increased 57% among students exposed (aOR = 1.57, 95% CI: 1.27, 1.95) and 54% among students unexposed (aOR = 1.54, 95% CI: 1.39, 1.70) to a FTSR. Likewise, the odds of ever using marijuana in an e-cigarette significantly increased 35% among students exposed (aOR = 1.35, 95% CI: 1.19, 1.53) and 29% among students unexposed (aOR = 1.29, 95% CI: 1.20, 1.39) to a FTSR. Adjusted D-I-D estimates show that for both outcomes, pre- to post-policy increases were not significantly different for students who were exposed and unexposed to a FTSR.
These findings remained consistent in a set of sensitivity analyses. In the first set of analyses, we compared students who were exposed to a comprehensive FTSR versus a combined group of students who were either exposed to a FTSR with an exemption or unexposed to a FTSR (Supplementary table 3). In the second set, we compared students exposed to a comprehensive FTSR versus those unexposed to a FTSR (Supplementary table 4).
Discussion
Based on the D-I-D estimates, we did not detect a significant association between FTSRs (any or only comprehensive) and current and ever e-cigarette use one-year post-implementation in the California Bay Area. However, when looking at students’ outcomes with and without exposure to a FTSR separately, some interesting patterns emerge. Among current e-cigarette users, almost daily use increased pre- to post-policy, but only the increase in unexposed students was statistically significant. In both exposure groups, there was an overall increase in ease of access to e-cigarettes. Marijuana use in an e-cigarette also increased pre- to post-policy among students with and without exposure to a FTSR.
The lack of substantial change in current e-cigarette use in students exposed and unexposed to a FTSR is consistent with overall trends in California youth. Among all 11th graders in the CHKS, e-cigarette use remained stable from 2015–2017 (10%) to 2017–2019 (11%)20 and among high school students in the California Student Tobacco Survey e-cigarette use was 8.6% in 2016, 10.5% in 2018, and 8.2% in 2020.7 Tobacco control efforts other than FTSRs targeted toward youth may have contributed to this overall lack of substantial change in e-cigarette use, such as the Tobacco 21 policy (June 2016), the $2.00 increase in tobacco tax (January 2017), school education programs, or media campaigns, such as California’s Flavors Hook Kids.21
Our results of no association between FTSRs and e-cigarette use one year post-implementation is not consistent with prior research suggesting that FTSRs reduced retail availability8–10 and youth and young adult use of tobacco products.12–15 A possible reason for our different results is that the survey questionnaire did not differentiate between flavored and non-flavored e-cigarettes. Among students exposed to a FTSR, it is possible that pre- to post-policy flavored e-cigarette use decreased and non-flavored e-cigarette use increased, resulting in the overall lack of change we observed. Substitution has previously been found after flavor ban policies.22,23 Rather than quitting e-cigarettes if flavors are no longer available, youth may turn to replacement products.
In addition to switching products, youth may be switching sources of flavored e-cigarette products. For example, among current flavored e-cigarette users in California (age 15–29 years), those in cities with a policy were less likely to obtain them from a retail store and more likely to obtain them from social sources, compared with their peers in the rest of the state without a policy.16 Another possible reason for the lack of change in the exposed group is that cities with FTSRs may have already had strong tobacco control efforts and a lower prevalence of youth e-cigarette use. Indeed, students exposed to a FTSR had a lower pre-policy e-cigarette prevalence, but the post-policy e-cigarette prevalence was similar for students unexposed (11.4%) and exposed (11.1%) to a FTSR.
Our finding of an increase in ease of access to e-cigarettes among all groups, irrespective of whether they were exposed or unexposed to a FTSR, is consistent with research showing that non-flavored e-cigarettes are still available in stores, and a lack of complete compliance of retail stores to FTSRs and minimum age policies. Flavored e-cigarettes were still available to purchase in approximately 20% of retail stores one year after San Francisco’s FTSR.15 In addition, nearly half (45%) of vape shops and tobacco stores in California still sold e-cigarettes to underage youth in 2018.24,25 Likewise, youth and young adults exposed to a FTSR in California were more likely to report difficulty in accessing flavored vaping products, but the percentages reporting difficulty were low in those exposed (17.5%) and unexposed to a FTSR (14.8%).26 National studies also show that youth are still able to purchase tobacco products.27,28
An increase in ease of access to e-cigarettes may also result from students traveling to nearby cities without a FTSR to obtain flavored e-cigarettes. As shown in Supplementary figure 2, all exposed cities were adjacent to at least one city without a FTSR. A state level policy may help prevent cross city border purchasing. In 2020, California passed a FTSR at the state level, but the tobacco companies filed a referendum, and the FTSR will not be implemented until January 2023, if approved by voters.29 More research is needed to examine other sources for the increase in access, such as online sales or peer access.
Our finding of an increase in ever using marijuana in an e-cigarette among students exposed and unexposed to a FTSR is consistent with national data on ever using marijuana in an e-cigarette30 and California data on marijuana use.31,32 Research showed an increase in marijuana use among youth31 and young adults32 in California following the November 2016 legalization of recreational marijuana, which passed one school year before our pre-policy period. Students may switch to flavored marijuana products in an e-cigarette if flavored e-cigarettes are no longer available. Among high school students in Northern and Central California, 58% of those who smoked marijuana in an e-cigarette used a flavored product.33 Future policies may consider restricting youth access to retail sales of marijuana. In 2019 the Surgeon General issued an advisory statement about marijuana being harmful to the developing adolescent brain.34
Limitations
Exposure to FTSRs was determined based on the city where each student attended high school, not where they lived, resulting in potential non-differential exposure misclassification, biasing the results towards the null. In addition, in order to have pre- and post-policy data, we only included seven cities with FTSRs out of the 76 municipalities that prohibit all flavors including menthol.6 The cities with FTSRs in our sample may be different than cities with FTSRs outside of our sample. We did not have information on all tobacco products, such as flavored cigar use (which decreased after the San Francisco FTSR)15 or quit attempts. In California, the percent of high school students who tried to quit e-cigarettes in the past 12 months increased from 27.0% in 2018 to 54.6% in 2020.7 We did not consider FTSR implementation time, which ranged between one month and one year. Students from cities with longer FTSR implementation time may have had more time for behavior change. This is an opportunity for future research, as it may even take longer than one year post-implementation to see a change in youth e-cigarette behavior. Last, our estimates of tobacco use are not representative of all high school students in the San Francisco Bay Area, as the data are not weighted. However, estimates for current e-cigarette use from the 2017–2019 CHKS (11.0%) were similar to those from the 2017–2018 California Student Tobacco Survey (10.9%), a weighted survey that is representative of all high school students in California.7
Conclusions
Using a D-I-D analysis with a large sample, results suggest that local FTSRs in the California Bay Area were not associated with a change in e-cigarette use one-year post-implementation. Increased ease of access and marijuana use may be explanatory factors. The steep increase in e-cigarette use among U.S. youth in 2018 will need a comprehensive approach to counteract, including policies (FTSRs, e-cigarette inclusive smoke-free policies, etc.), media campaigns, education programs, and cessation tools targeted to youth.
Supplementary Material
A Contributorship Form detailing each author’s specific involvement with this content, as well as any supplementary data, are available online at https://dbpia.nl.go.kr/ntr.
Funding
Melanie Dove was supported by the National Center for Advancing Translational Sciences, National Institutes of Health, through grant number UL1 TR001860 and linked award KL2 TR001859. Elisa Tong was supported by the National Cancer Institute Award Number P30CA093373-15S and UC Davis Health System.
Declaration of Interests
None declared.
Acknowledgments
The authors would like to acknowledge Mark Meany from the Public Health Law Center for providing detailed information on Flavored Tobacco Sales Restrictions in California. We would also like to acknowledge Ben Trigg from WestEd for his help with the California Healthy Kids Survey data.
Data Availability
The California Healthy Kids Survey data is available by request: https://calschls.org/reports-data/.

Comments